Show, Don’t Tell
Infographic Design and Data Visualization Blog by Easelly
Do You Know Your Carbon Footprint? A Case Study & Infographics
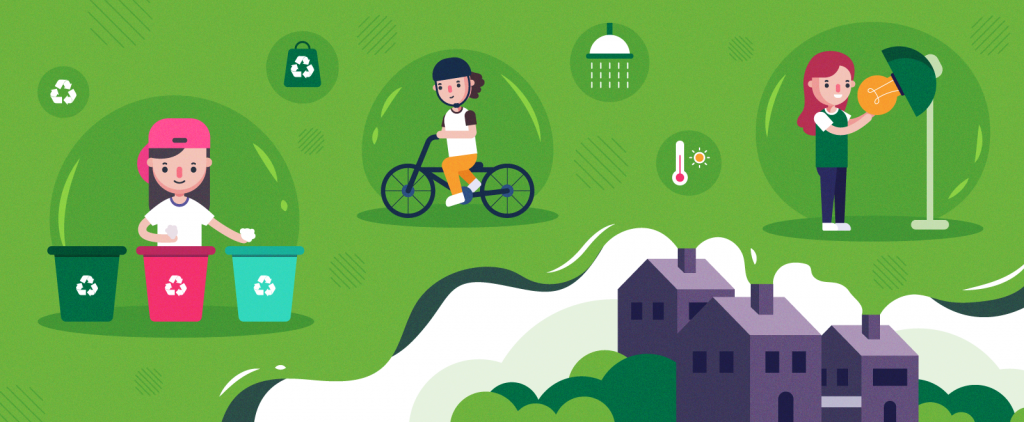
At Easelly, we believe that each one of us can take small yet significant steps to protect our planet and future generations from rising global …
Webinar Recap: Create Infographics to Turn Your Data into a Powerful Marketing Tool
Let’s be honest, many of us will skim through or turn away from a report or a presentation filled with blocks of texts and figures. …
Guide to Infographic Size and Dimensions: A Cheat Sheet
Here’s a guide to the most common infographic sizes and dimensions. What size should your infographic be? Depends on the platform. Read on to find out.
Text vs. Images: Which Content Format is Effective?
A copywriter and a graphic designer walk into a bar. The copywriter confidently declares “text trumps visuals” but the graphic designer shouts in protest “no …
What Does an Information Designer Actually Do? Meet Nigel Hawtin
You’re probably wondering what information designers do and end up not finding clear, articulate answers. As part of our ongoing deep-dive blog series on information …
10 Easelly Shortcuts to Help You Make Infographics in Minutes
We wholeheartedly agree that all good things take time, but technology has also made it possible for us to work smarter and get things done …
10 Amazing Infographic Templates You Can Use Today
Are you looking for free infographic templates that you can edit and download for your next powerpoint presentation, school project, or business meeting? You’ve come …
VIDEO: The History of Infographics and its Evolution
Infographics have come a long way. But where did infographics come from and how did they get to be so popular? Infographics, by definition, mean …
What is Information Design and Why It Matters Now More Than Ever
Have you ever found yourself squinting hard while reading too small instructions in your coffee maker manual? Or have you had problems filling out an …
Why You Need a Call to Action in Your Infographic
Creating an infographic for your nonprofit organization or business is a great way to boost awareness, increase conversions, and generally entertain and attract viewers. But …
7 Infographics to Celebrate International Women’s Day
March 8 is almost here and it means one thing — International Women’s Day (IWD) is just around the corner! The goal is to celebrate …
Data Visualization Guide: Choosing the Right Chart to Visualize Your Data
Are you about to make a pie chart but you’re unsure if it’s the right chart to effectively convey your message? Quick fact: most of …