
A copywriter and a graphic designer walk into a bar.
The copywriter confidently declares “text trumps visuals” but the graphic designer shouts in protest “no way, visuals rule the world!”
So who should we root for?
There’s no two ways about it — thoughtful content and beautiful visuals can help make your story, message, or content into an engaging piece that gets the attention of your audience.
While thoughtful, text-only content has its pros in communicating with impact, there’s been a significant shift in recent years favouring a combination of text and visuals — eye-catching infographics, beautifully crafted animations, clever gifs, and stunning Powerpoint presentations.
But have you ever wondered why would you rather click on a social media post with a gif or video than a link with no visuals?
Why is it easier to comb through an article with images peppered in between texts?
In this case study, we make a case for visuals over text in powerful business communication, learning, and memory recall.
Sure, we might be a bit biased because we help people create engaging, effective infographics and animation, but we made sure to stick with the facts, latest findings, and reliable insights that we can find.
Why your brain loves looking at pictures

Vision trumps all senses. Pictures beat text as well, in part because reading is so inefficient for us. Our brain sees words as lots of tiny pictures, and we have to identify certain features in the letters to be able to read them. That takes time.
Text vs. images in everyday communications
Here are several insights and research findings on why visuals trump text in everyday communications:
The human brain can process entire images that the eye sees for as little as 13 milliseconds. – Source
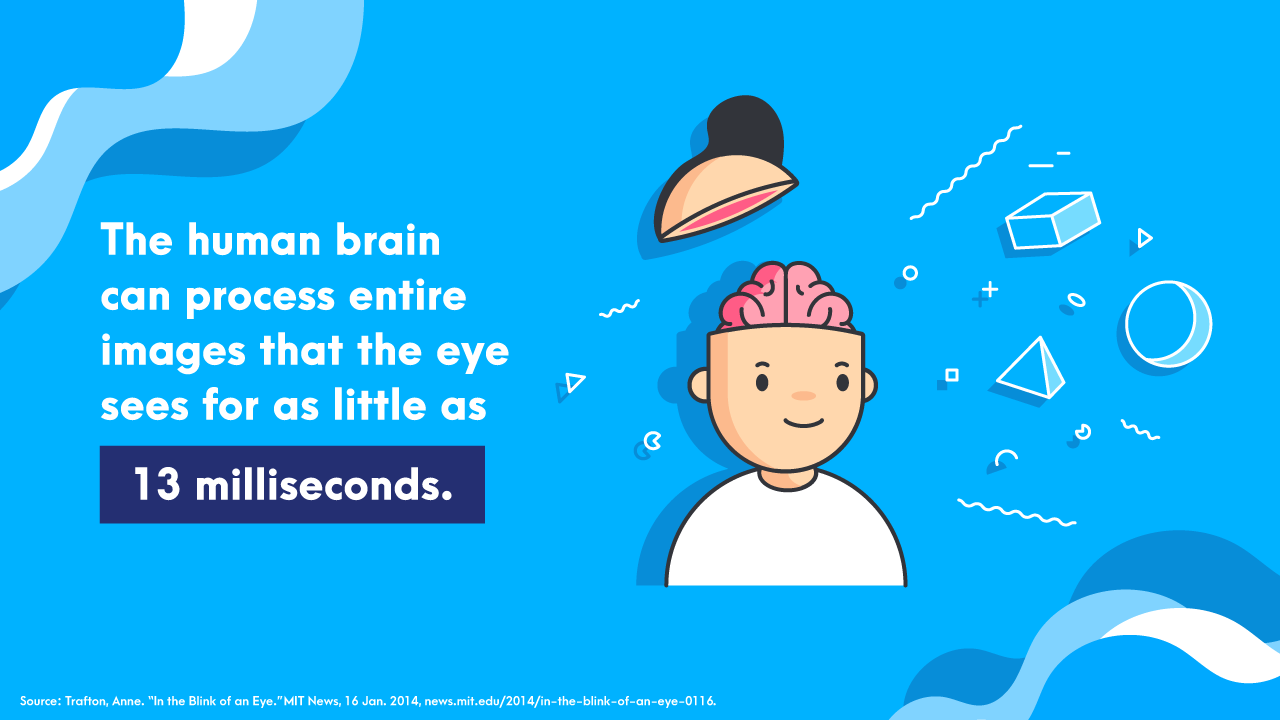
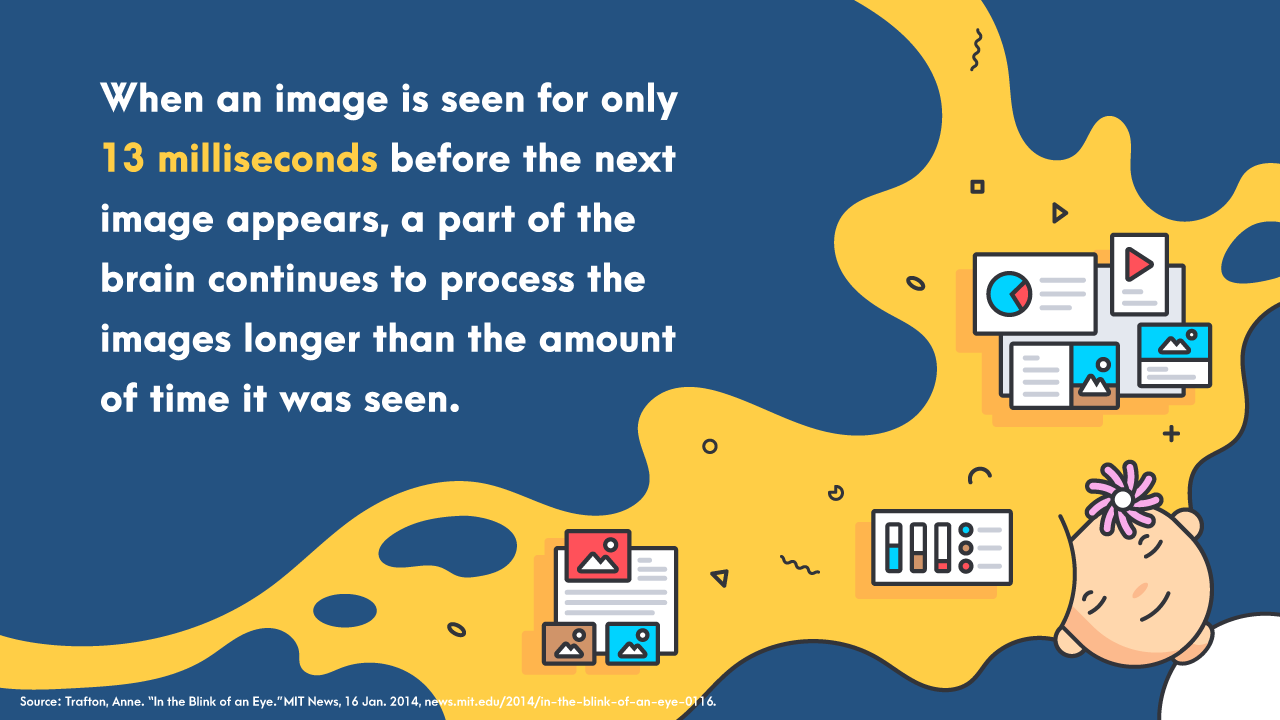
When an image is seen for only 13 milliseconds before the next image appears, a part of the brain continues to process the images longer than the amount of time it was seen. – Source
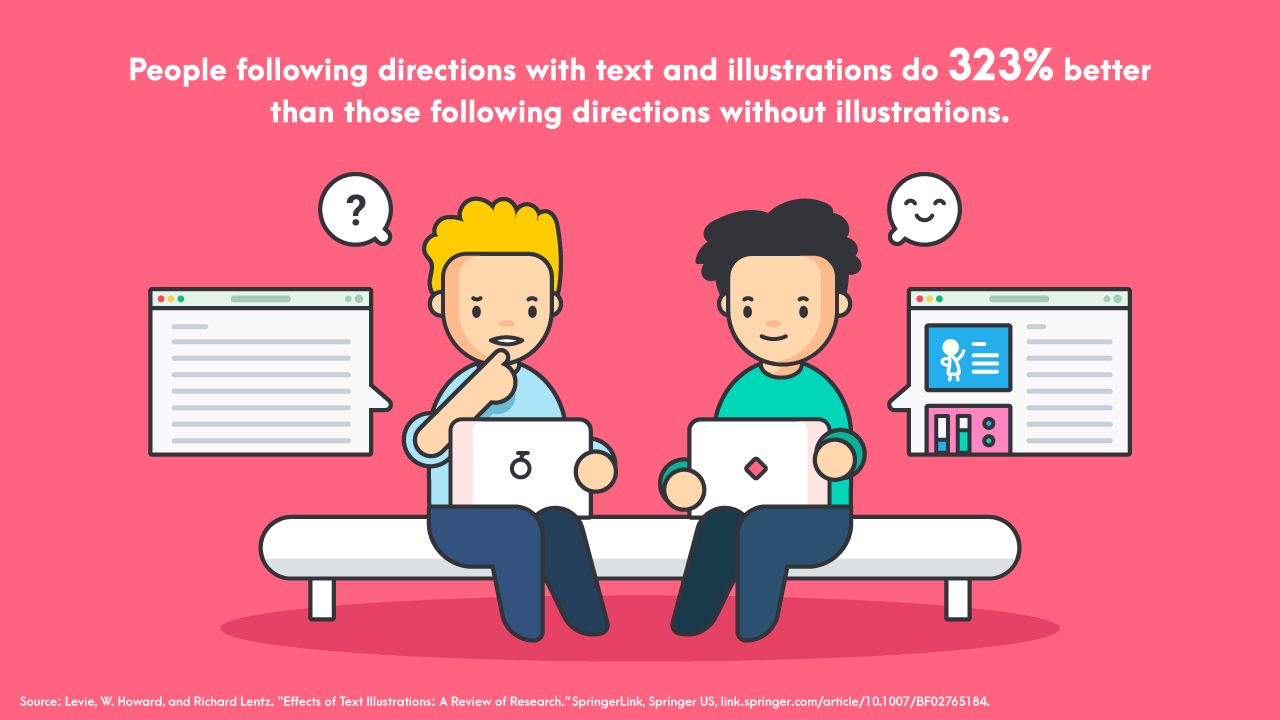
People following directions with text and illustrations do 323 percent better than those following directions without illustrations. – Source
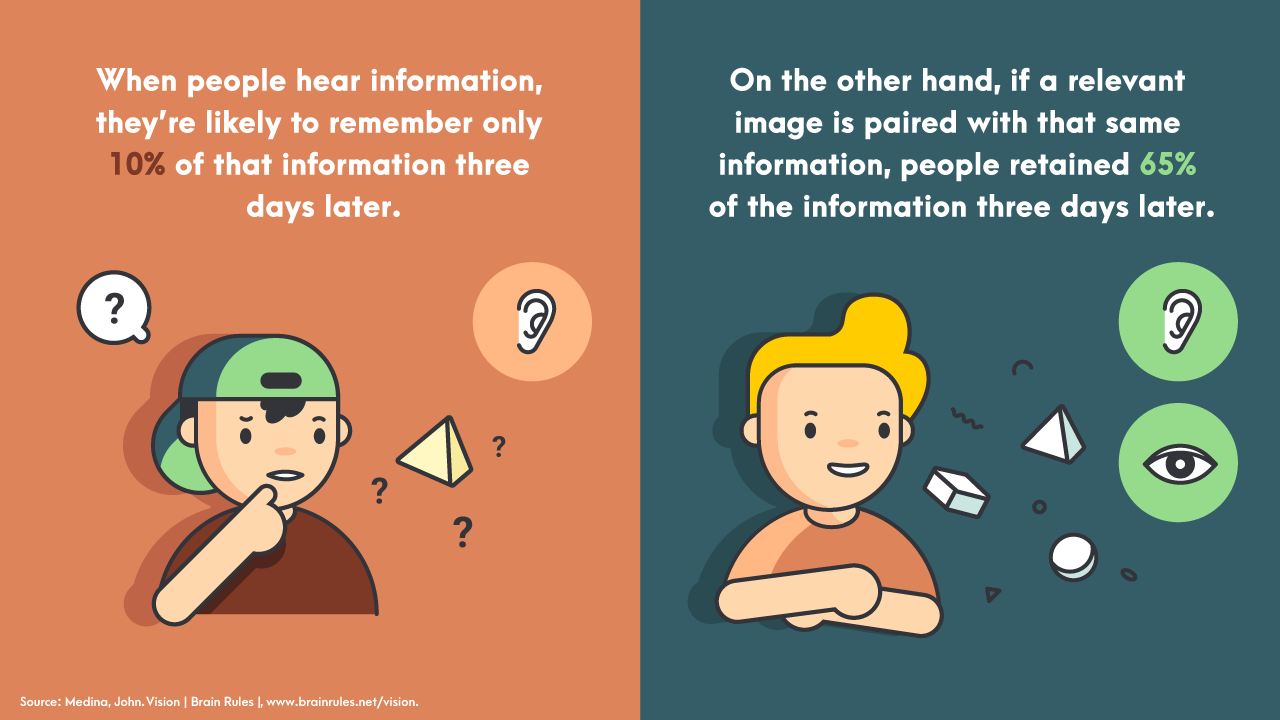
When people hear information, they’re likely to remember only 10 percent of that information three days later. On the other hand, if a relevant image is paired with that same information, people retained 65 percent of the information three days later. Source
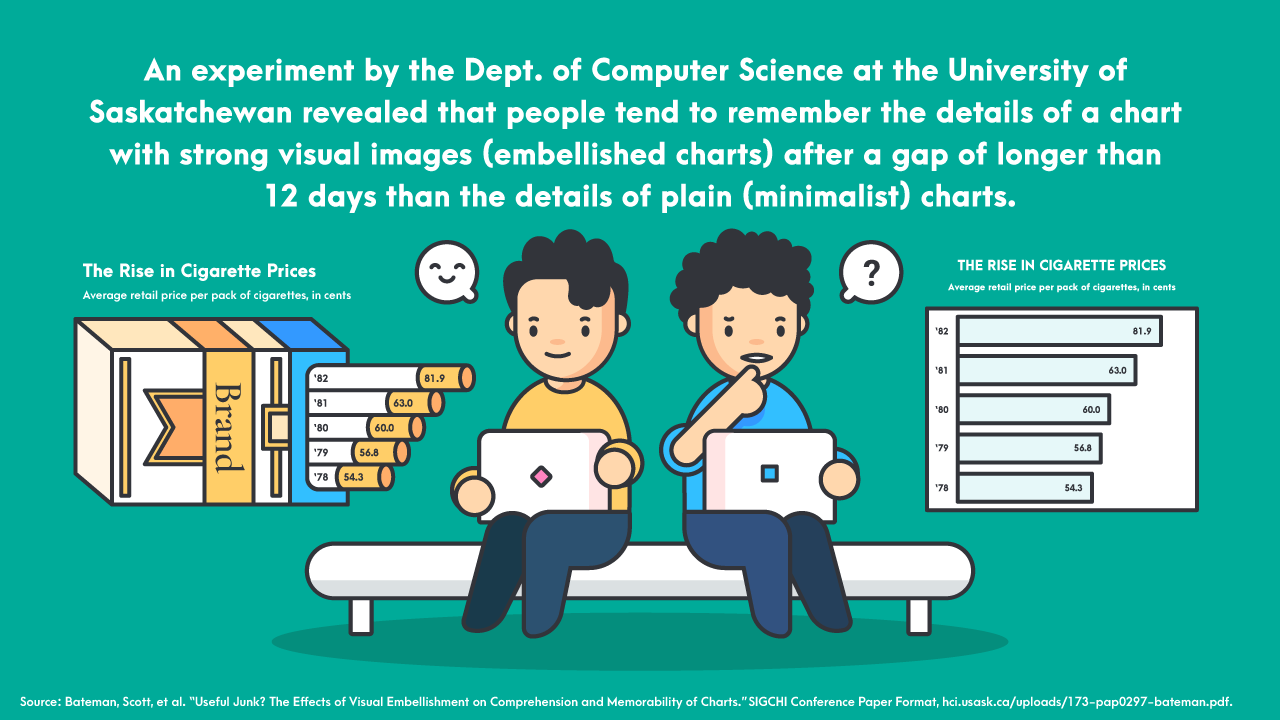
People tend to remember charts with strong visual images than its plain counterparts. – Source
An experiment by the Department of Computer Science at the University of Saskatchewan revealed that participants preferred embellished charts over plain (minimalist) charts in terms of aesthetics. Furthermore, there was no difference in the participants’ accuracy in interpreting the embellished charts and the plain charts during the experiment.
Meanwhile, participants were able to remember significantly more about the embellished charts after a gap of longer than 12 days, suggesting that the addition of strong visual images in the embellished charts helped participants to remember both the topic and details of the chart.
Text vs. visuals in education
It’s as important to be visually literate, to understand pictures and how they affect us, as it is to be word-literate. Many of us employ visual language, often without realising it. Being fluent in the language of images gives us an advantage at school, at work, and at home.”
Using visual aids in the classroom help improve learning by up to 400 percent. Specifically, it helps students improve in the following areas:
- Clarification of content
- Student’s motivation to learn
- Saves time with lesson preparation
- Vocabulary enhancement
- Avoid dullness during class
- Provide direct experience as sensory objects which initiate or stimulate learning
Researchers at Georgetown University Medical Center’s Department of Neuroscience found out that your brain learns new words by adding these words to your brain’s “visual dictionary”. – Source

Text vs. visuals in marketing and business communications
Visuals aren’t just flashy; they can help define and complicate a brand’s identity by giving marketers another language to speak. And it’s not just logo design—branded visual content tells its own story through color, rhythm, humor, and tone. If you can show your audience who you are, you don’t have to waste time telling them over and over. – Emily Gaudette, Engaging Your Audience With Visual Content: The 2019 Report
Animated infographics tend to generate the highest number of social shares than charts, graphs, and other visuals. – Source
An analysis of blogs in different industries done by Quicksprout revealed that articles with data-driven visuals such as charts and graphs receive more trackbacks – 258 percent more than blog posts with other types of images.
They also discovered that animated infographics generated the highest number of social shares compared to graphs, charts, and other visuals.
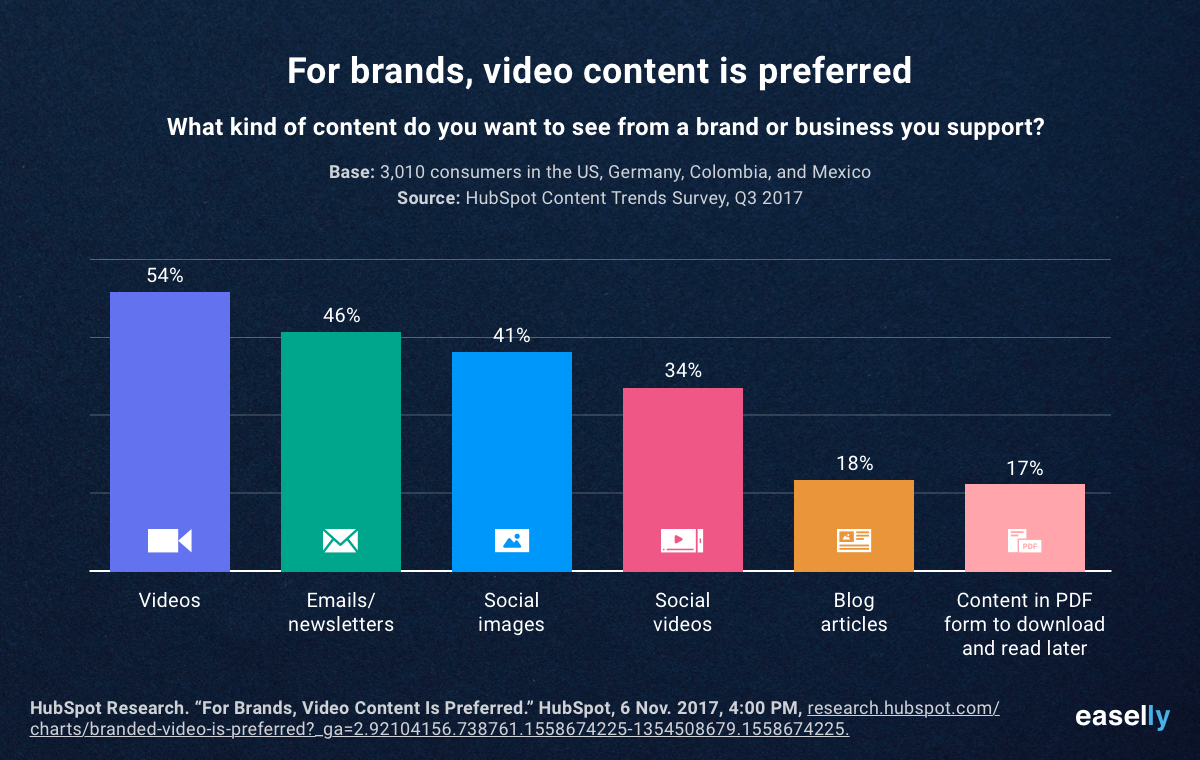
In a HubSpot survey, 54 percent of consumers wanted to see more video content from a brand or business they support. – Source
Eye-tracking research reveal that users pay close attention to photos and other images that contain relevant information but ignore fluffy pictures used to “jazz up” web pages. – Source
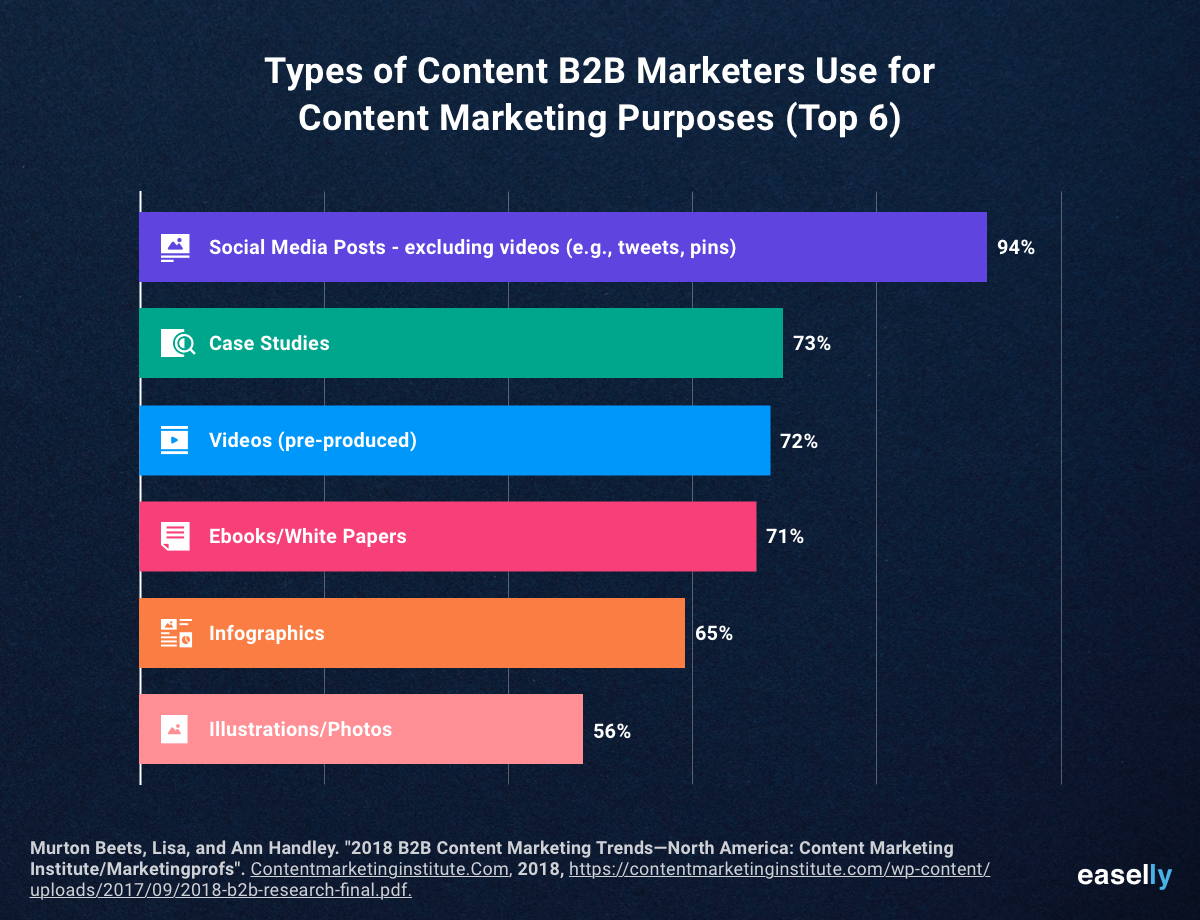
Visual types of content like infographics, photos, and videos comprise a significant portion of content that B2B marketers use. – Source
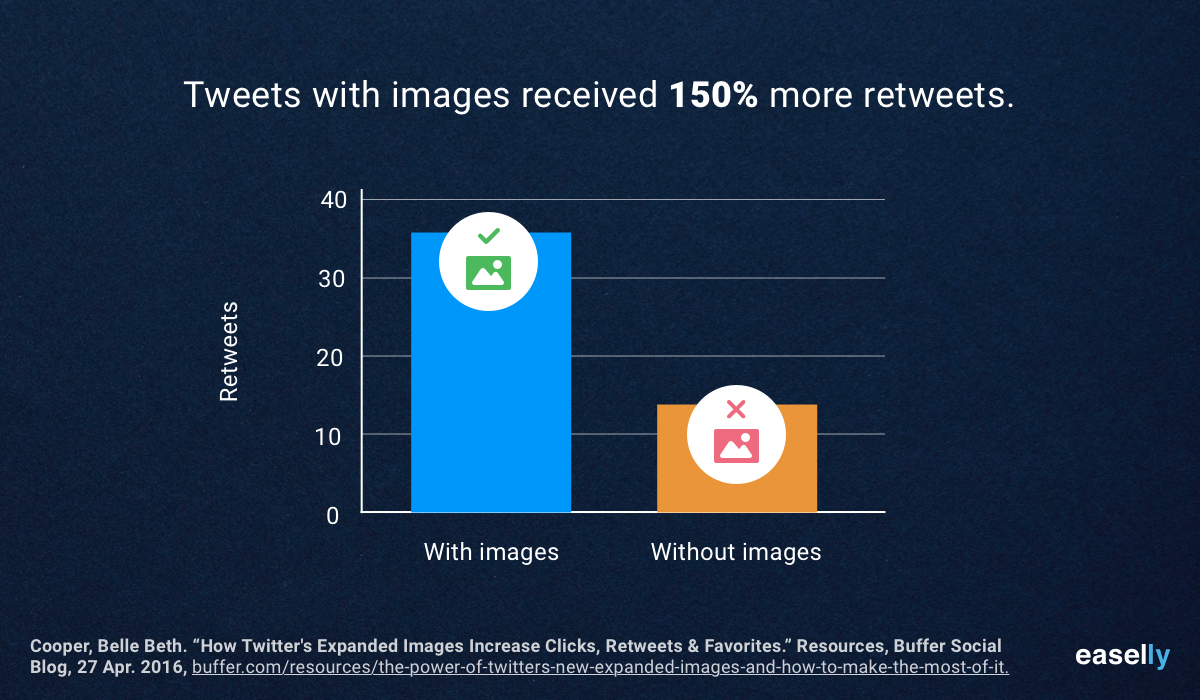
Tweets with images receive 150 percent more retweets than tweets without images. – Source
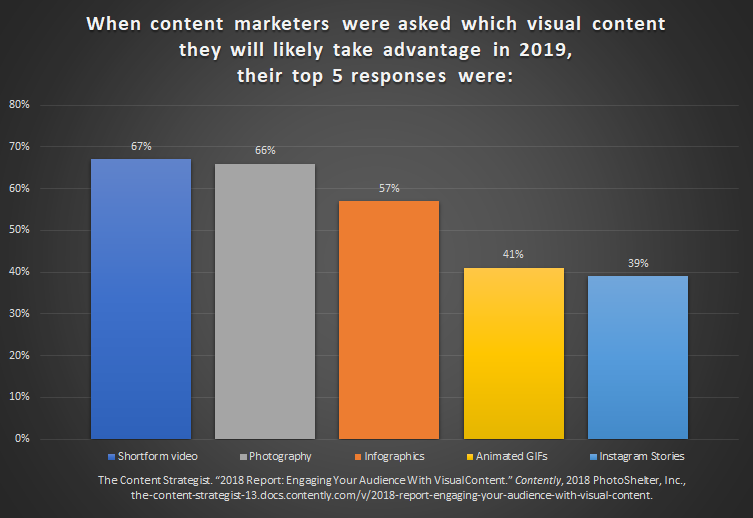
When content marketers were asked which visual content they will likely take advantage in 2019, their top 5 responses were: short-form video, original photographs, infographic, animated gifs, and Instagram stories. – Source
Your action plan
In summary, using visuals with text makes more sense if you’re looking to communicate with impact and make your content more memorable.
Use the following guides to help you get started with your efforts to communicate using images and visuals, whether for school or business:
- 10 Great Examples of Using Infographics for Education (Guide)
- 5 Ways to Use Infographics in Business (Guide)
- 5 Creative Ways to Differentiate Your Small Business and Rise Above the Competition (Guide)
- Using Infographics for Lead Generation ( Video)
- 10 Types of Infographics and When to Use Them (Guide)
Want to share this article in video format? Check out the video below!
Need help making your infographic? We’ve got you covered with our infographic maker tool or through our infographic design service team.