Show, Don’t Tell
Infographic Design and Data Visualization Blog by Easelly
Black Friday vs. Cyber Monday: A Visual Case Study
Black Friday and Cyber Monday are just around the corner. As customers, these days mean big one-off deals and huge discounts. For business owners and …
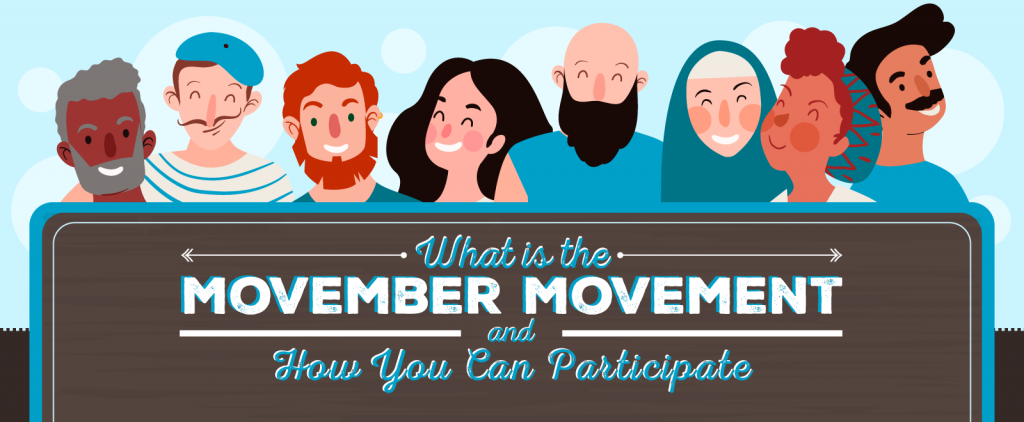
What is the Movember Movement About? A Visual Case Study
College student Doug Mcarthur just got back from studying abroad in Europe when he noticed that something was off during a testicular self-examination. “I definitely …
Cancer in Children Facts and Statistics: A Visual Case Study
On May 13, 2019, no one would have guessed that 5-year-old Kensley from Montana will end up at her local ER due to fever and …
What Your Pet of Choice Says About Your Personality – A Visual Case Study
We, humans, are a complex bunch. Our pet of choice is another layer that adds to this complexity. Why do you think your friend prefers …
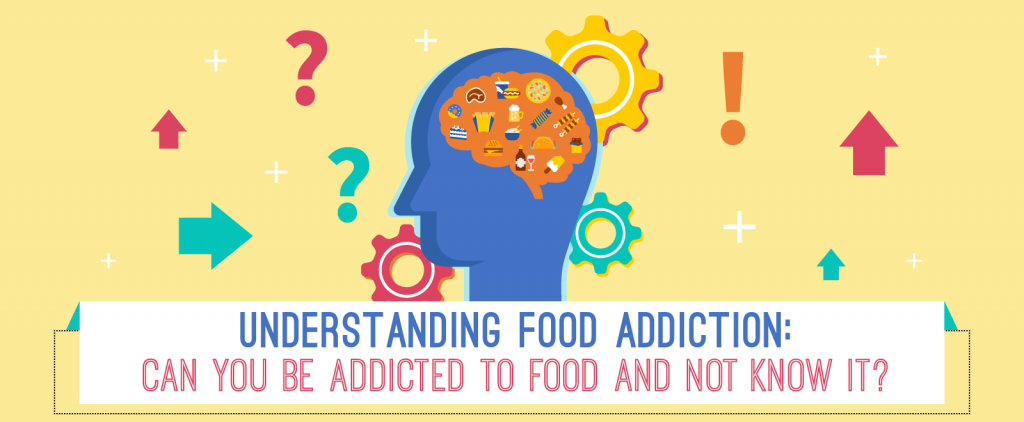
Is Food Addiction Real? – A Visual Case Study
You’ve probably wondered if your occasional pizza cravings and late-night ice cream binges are signs that you’re addicted to food. But what if it’s that …
Yoga for Pain Relief – A Visual Case Study
Everyone’s talking about yoga — from your company HR to your therapist to your Instagram feed. Your health insurance would likely even pay for it. …
Do You Know Your Carbon Footprint? A Case Study & Infographics
At Easelly, we believe that each one of us can take small yet significant steps to protect our planet and future generations from rising global …
Text vs. Images: Which Content Format is Effective?
A copywriter and a graphic designer walk into a bar. The copywriter confidently declares “text trumps visuals” but the graphic designer shouts in protest “no …
Mental Health Statistics: Socioeconomic Costs (An Infographic)
In honor of Mental Health Awareness Month this May, we’re highlighting recent figures and findings on mental health and substance abuse in an infographic. There’s no arguing …
A Snapshot of a Woman’s Life After 60 (An Infographic)
This infographic and case study is part of our Women’s Month series this March! You can check out the previous case studies in the series …
What Makes Baby Boomer Women Buy (An Infographic)
This infographic and case study is part of our Women’s Month series this March! Check out the first in the series – 7 Infographics to …
Do Long Distance Relationships Really Work? (An Infographic)
Whether we realize it or not, building romantic relationships is a big part of being human. Since February (or love month if you prefer to …