At Easelly, we believe that each one of us can take small yet significant steps to protect our planet and future generations from rising global greenhouse gas emissions.
World Environment Day is celebrated every 5th of June. Before the month comes to an end, our team did some digging to understand how we live impacts the planet— as a collective and as individuals – in terms of carbon dioxide emissions.
This case study is divided into three sections: carbon emission statistics from a broader context, our individual carbon footprints, and simple ways to reduce and offset your carbon footprint.
Carbon footprint infographic: The bigger picture
According to the United Nations Environment Programme, carbon dioxide emissions account for 82 percent of today’s global warming. The rest comes from more potent greenhouse gases like methane and nitrous oxide.
A 2018 report by the World Meteorological Organization of the United Nations highlighted that global concentrations of carbon dioxide (CO2) rose to 405.5 parts per million (ppm) in 2017, up from 403.3 ppm in 2016 and 400.1 ppm in 2015. Methane and nitrous oxide concentrations also increased.
Furthermore, there has been a resurgence of an ozone-depleting substance called CFC-11. It’s worth noting that this substance is regulated under an international agreement to protect the ozone layer.
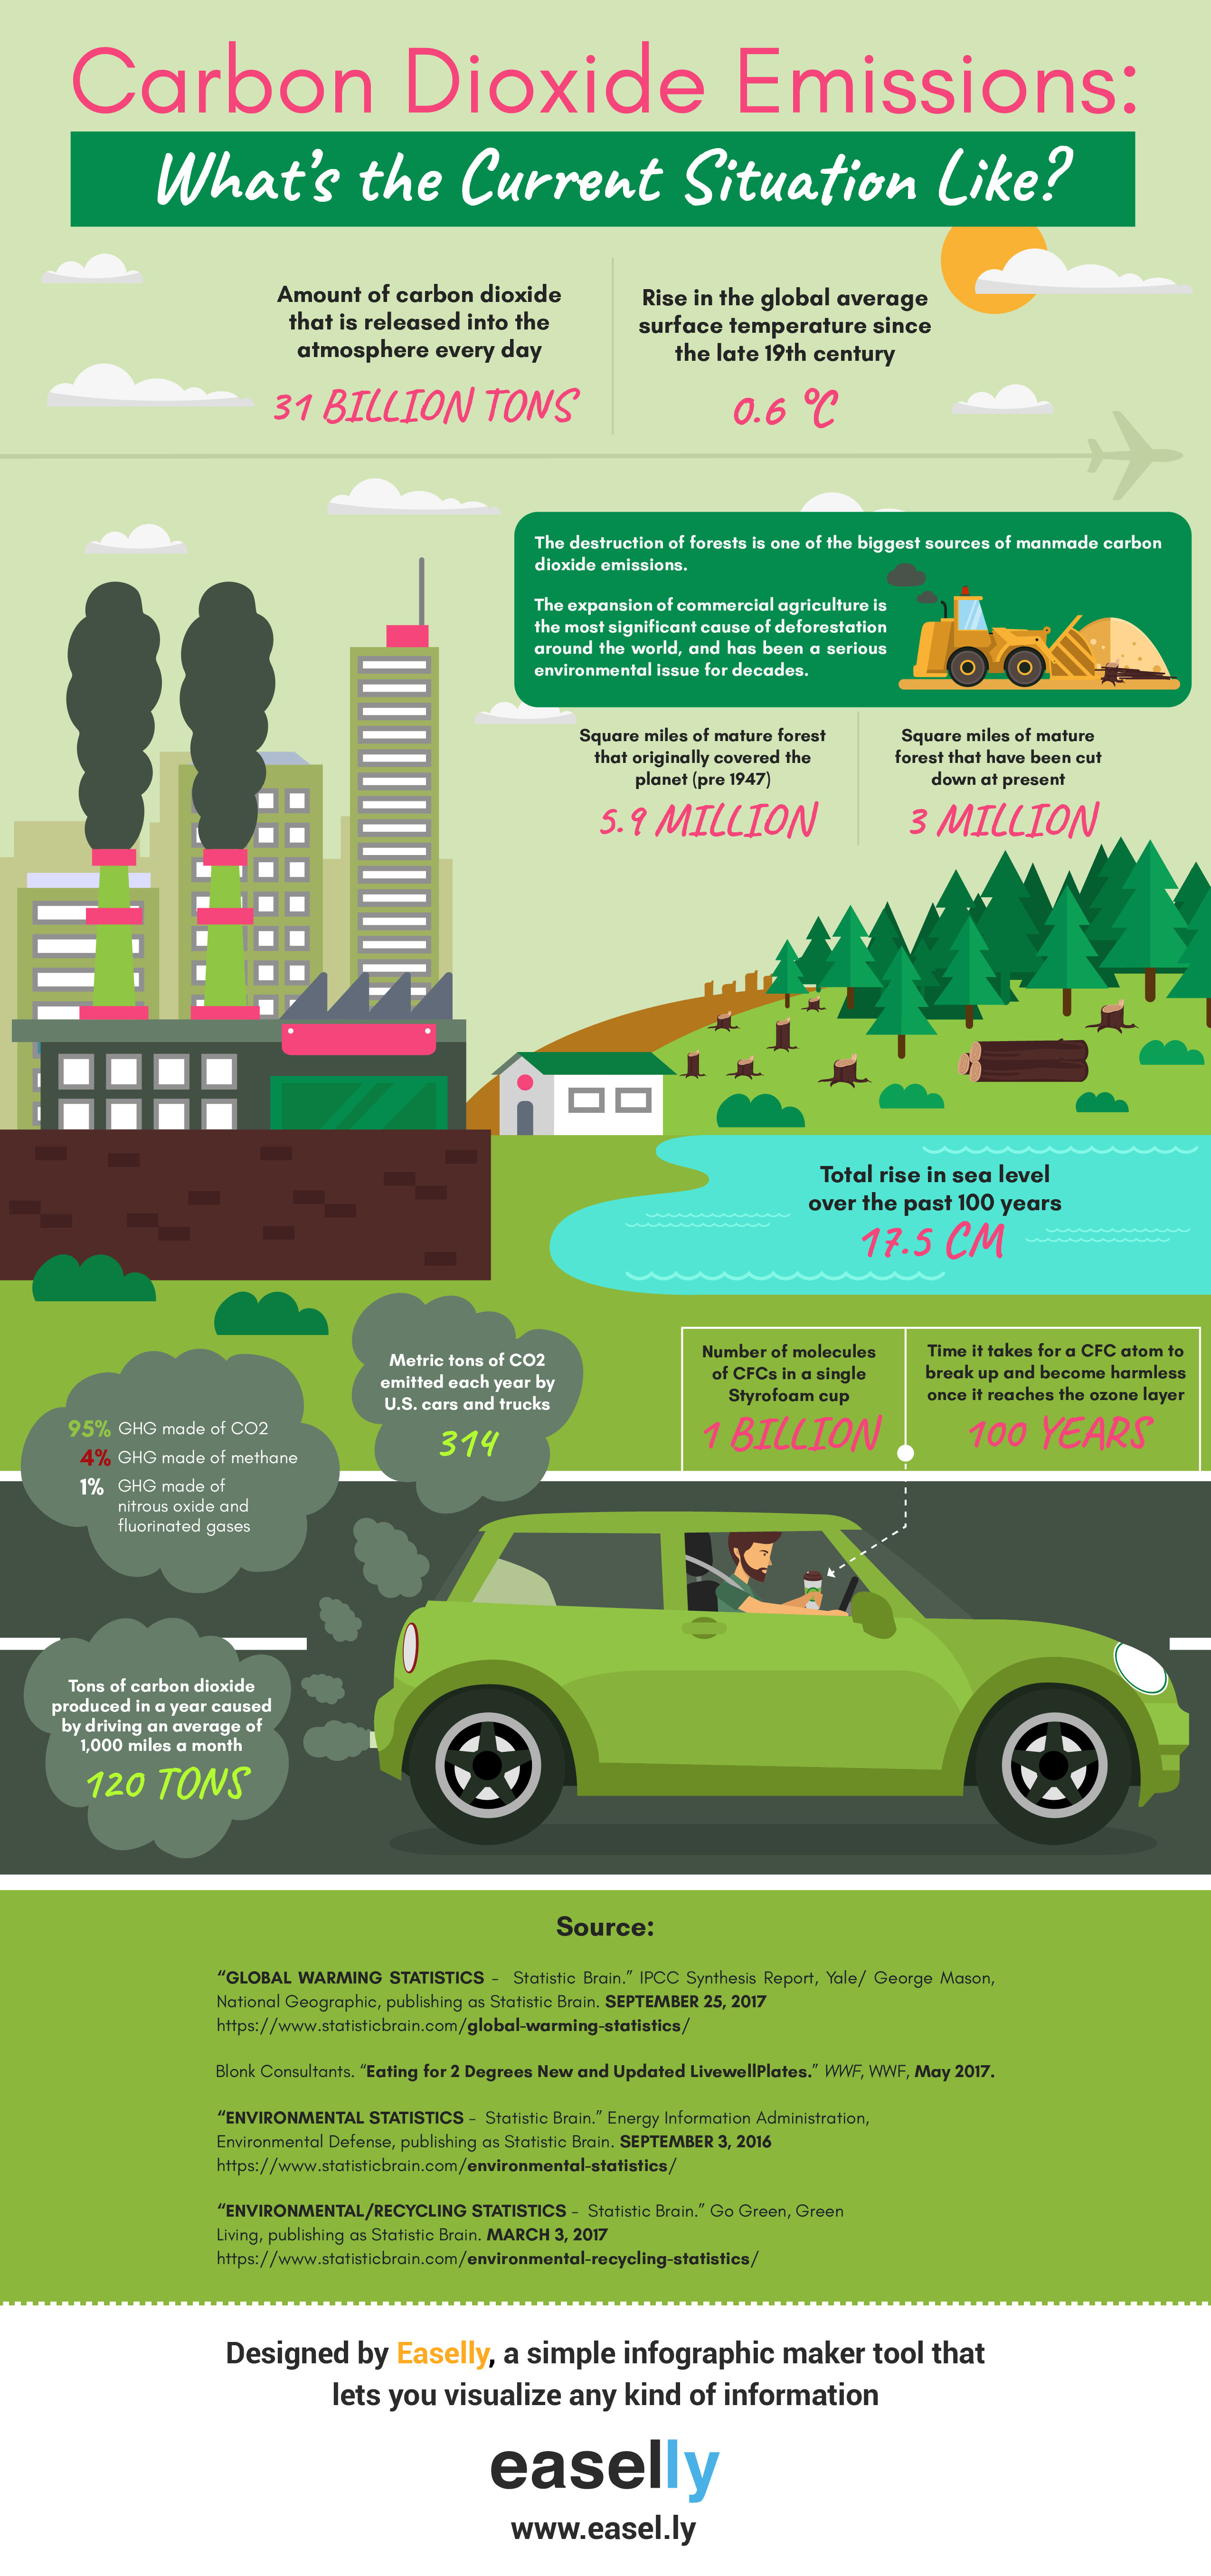
The destruction of forests is one of the most significant sources of humanmade carbon dioxide emissions.
Expansion of commercial agriculture is the most significant cause of deforestation around the world, and has been a serious environmental issue for decades.
As for countries emitting the most carbon, China tops the list, closely followed by the US, India, Russia, and Japan. Germany, South Korea, Iran, Indonesia, and Saudi Arabia completes the top 10.
How your daily activities impact the planet
According to greenhouse gas foot-printing expert Mike Berners-Lee, a carbon footprint is a way of estimating the total climate change impact of something you do or buy — all along the supply chain, from manufacturing to delivery to use. Its metric is called carbon dioxide equivalent, or CO2e, which translates all the different greenhouse gases into a comparable amount of CO2 by impact.
An individual’s carbon footprint, like real footprints, will vary from one person to another. The data below are the average amount of individual carbon dioxide emissions emitted per year as we go about our daily life.
Global experts call for a target limit of approximately 2 tonnes (roughly 4400 lbs) per person per year. Currently, the global average is 4 tonnes (approximately 8800 lbs) per person, with a wide variation between countries.
Simple ways to reduce carbon footprint
Your “carbon footprint” is a measure of the impact your activities have on the amount of carbon dioxide (CO2 ) produced through the burning of fossil fuels and is expressed as a weight of CO2 emissions produced in tonnes.
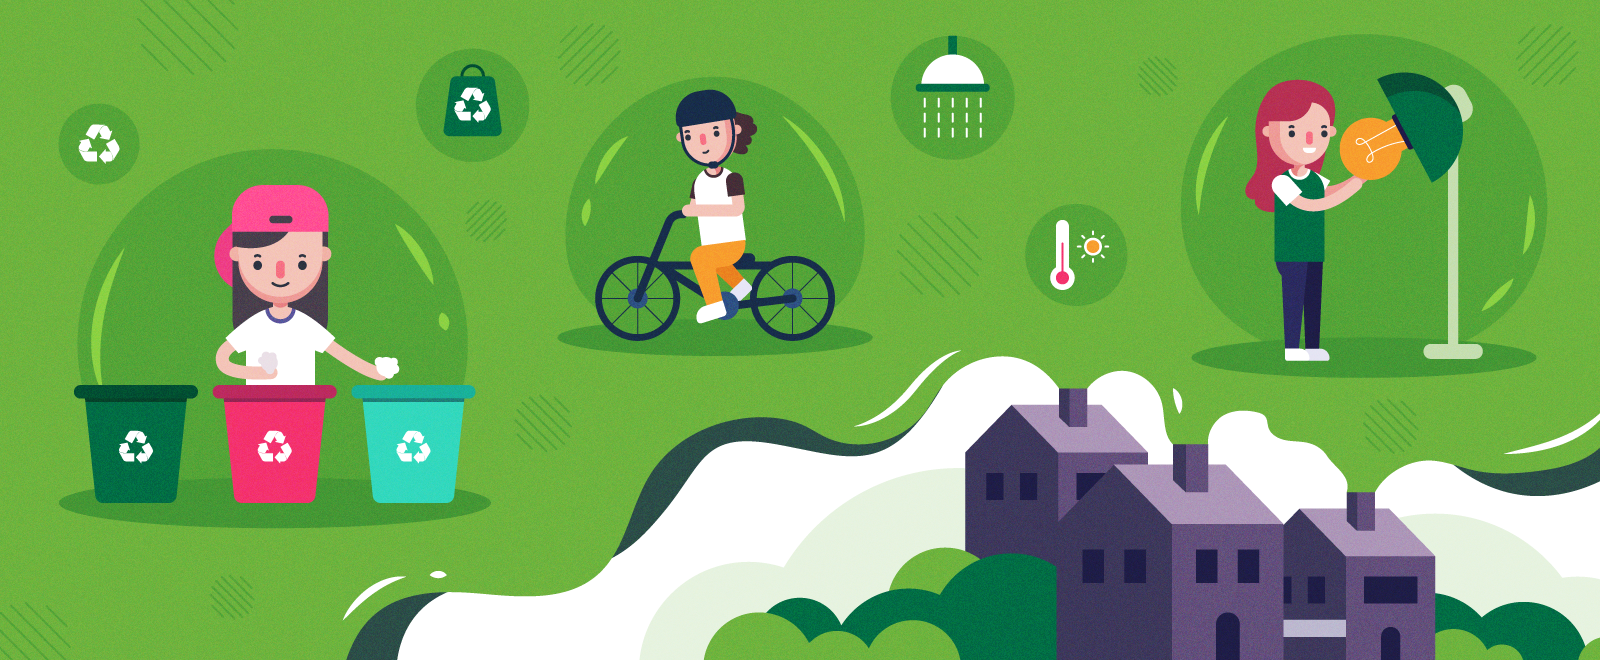
The infographic below highlights steps that you can take to reduce or offset carbon emissions related to transport, food, use of energy in the home, water use, and waste management.
Eat your way to a smaller carbon footprint
You can eat your way to a smaller carbon footprint!
How? Consider WWF (World Wife Fund for Nature) UK’s Livewell plate guidelines.
In a nutshell, the Livewell plate recommendatation is WWF-UK’s work on sustainable diets that examines at the food changes needed to keep temperature rise below 2 degrees.
Their goal is to demonstrate that a diet that can be sustainable (help UK meet its targets in reducing greenhouse gas emissions), affordable, and in line with national nutritional guidelines and food preferences in the country.
You can follow (or modify to your needs) the following Livewell eating principles:
- Eat more plants. Enjoy vegetables and wholegrains.
- Eat a variety of food. Have a colourful plate.
- Waste less food. Did you know that one third of food produced for human consumption is lost or wasted?
- Moderate your meat consumption, whether red or white. Enjoy other sources of proteins such as peas, beans and nuts.
- Consider food that is MSC (Marine Stewarship Council) -certified, free-range and fair trade.
- Eat fewer food that is high in sugar, salt, and fat.
- Choose water and avoid sugary drinks as much as possible.
We’ve also made a short animation below on plastic use and their impact on the environment. You can use it in class or share it to your friends and family!
Now that you’re aware of your carbon footprint impact on the planet, what steps are you planning to take to reduce or offset your footprint?
We also encourage you to spread the word!
You can use the infographics, animation, and charts we’ve created for this case study as long as you give us proper credit.
Here’s a long infographic combining the mini-infographics above:
We will be also be uploading the infographics in our infographic template library so you can reuse it asap!
Need help making your infographic? We’ve got you covered with our infographic maker tool or through our infographic design service team.