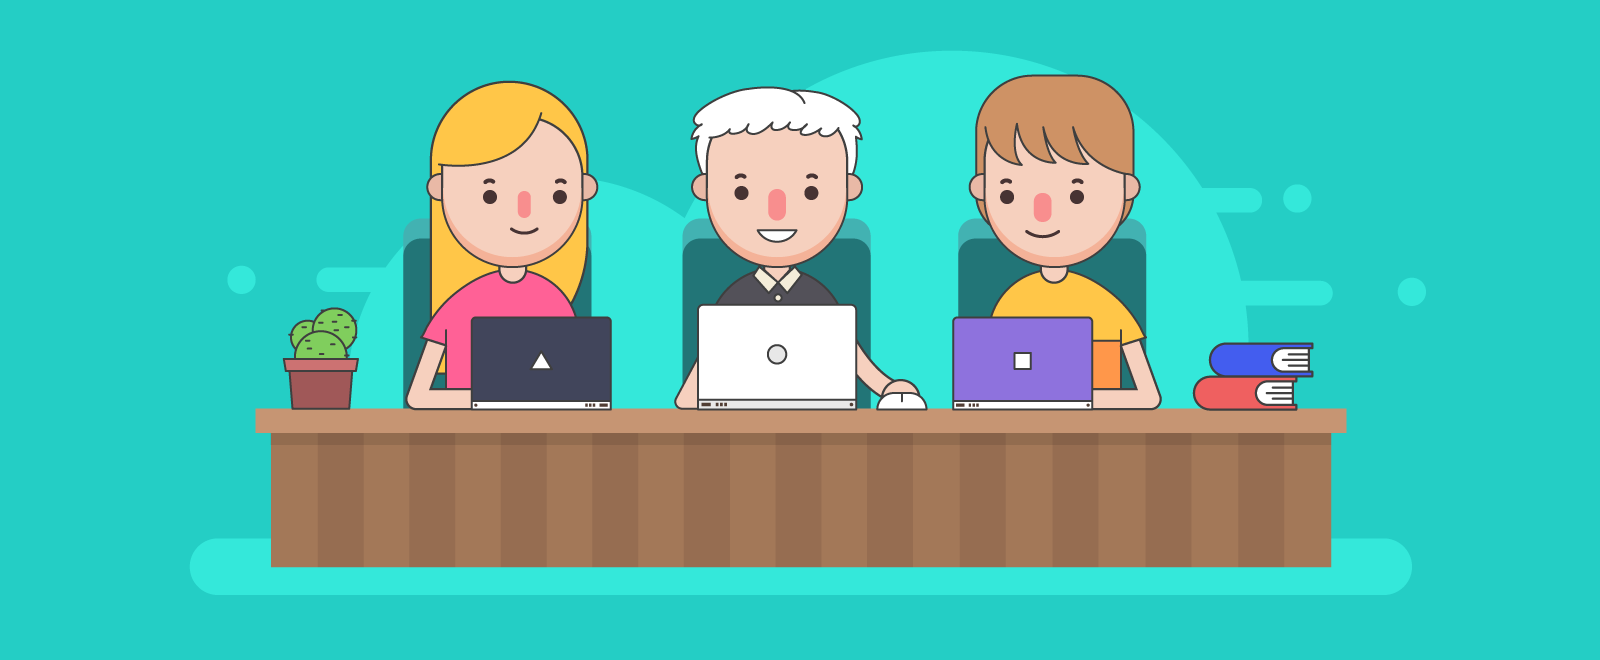
You’re probably wondering what information designers do and end up not finding clear, articulate answers. As part of our ongoing deep-dive blog series on information design, Easelly spoke with London-based information designer and visual communicator Nigel Hawtin. We asked him about his work, projects, background, and a sneak peek of his typical workday.
Information designer profile: Nigel Hawtin
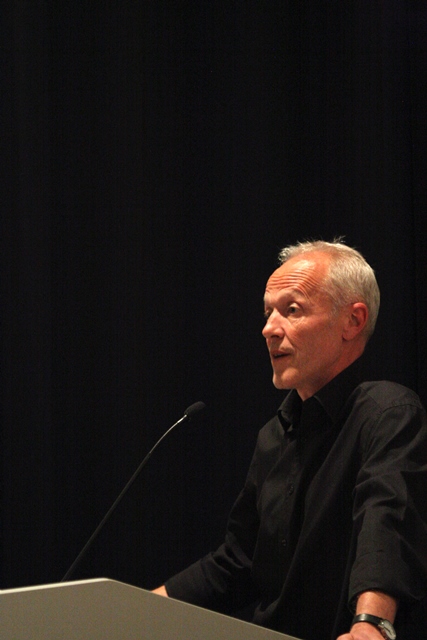
Nigel Hawtin is an information and infographic designer. He has been producing graphics, infographics, charts, and maps for around 30 years, and have been running his own information design company for the past five years.
As an independent contractor, Nigel also acts as a design consultant, speaks at conferences, and teaches infographics design workshops around the world. He was a Graphics Editor at New Scientist for 20 years and has worked for the Time magazine, The Sunday Times and The Chronicle of Higher Education.
Let’s get to know him (and his work!) more below.
How did you get into information design?
After completing a 2-year foundation course in art and graphics in Cambridge, I went on to complete a 4-year degree in medical, scientific and botanical illustration in London. This degree allowed me to concentrate on my drawing, painting and illustration skills alongside storytelling and explanatory techniques – explaining things in a visually understandable and accurate way.
I started as a freelancer, producing mainly botanical and natural history illustrations for newspapers (Sunday Times, Observer) and book publishers (life cycles of dragonflies, dinosaurs timeline, etc) before joining as diagram artist at New Scientist – producing diagrams for the magazine. I had a one day trial there…which ended up being almost 25 years finishing up with me being Graphics Director for the brand.
What’s the transition like from working with New Scientist for almost two decades to going independent with your information design consultancy?
The graphics always evolved with the styles of the times as well as the technology. In that time, we went from hand-drawn graphics to the introduction of Apple Macs and then the transition to fully digital graphics and data visualizations for the broad New Scientist audience (from interested reader to expert), taking in the emergence of the internet.
I have always freelanced (as most journalists do) and with freelance work increasing and speaking opportunities at conferences and forums also taking up my free time, I was thinking about how to fit it all in when the opportunity came along to take redundancy from New Scientist, so I took the leap not knowing how it was going to go.
The transition from full-time office work to being at home on my own for much of the time has been a big change. I miss the interaction between colleagues and friends in the office but I do get the chance to have that interaction with my clients – which is fantastic.
The scope of my work has increased and very few days are the same…a very different type of stress, and one that I prefer!
What was the industry like when you were starting out? What has changed?
The whole look of the industry has changed since I started out. There were very few people producing infographics back then. A few like me doing graphics for newspapers, magazines and books, but it was seen more of an artistic role rather than a data driven or design role. Everything was hand drawn and labour intensive, relying on the printer at the print house to add colour if it was used at all. Much has changed but fundamentally the same things are being explained in a visual way — it’s the look, feel and way of producing the visual and interaction that is different.
My 10-years-ago blog series takes a look back at the good, bad, and the ‘what was I thinking’ moments from 10 years ago. I write it from the heart and there is very little editing of the text…so what you read is what I think.
Let’s talk about your typical workday. Or workweek? Can you walk us through it?
Working for yourself, there is no typical working day or week. The one thing that I can say, is I am quite disciplined – maybe that’s because of many years as a full-time employee? I am always at my desk by 8 if I am at home. Reasons for not being at home? Away working, holiday or bird-watching (sometimes I need to get up very early and go walking).
Today, for instance, some emails needed attention first thing. I posted a couple of things on LinkedIn and Twitter then spent the morning working on a workshop presentation that I am due to deliver soon.
The afternoon was spent reading through a new commission and sketching out ideas for a Skype call with a client to see if I had understood the correct message from the brief.
An hour was spent in the early evening adjusting and finalising things on an existing project for a client in Europe. Some of the evening was spent speaking or commenting on social media!
I love the fact that every day, and every week, is different. Next week I could be traveling to Singapore for a couple of training days, that obviously involves a lot of travel and time. The week after that I could be at my desk every day reading, sketching and producing graphics for one of more clients.
Tell us about the rewards and challenges you have right now as an information designer.
The rewards are huge. I get to work with a huge range of fascinating and totally dedicated people from across all walks of life and many different countries all wanting to show something in a visual form.
The main challenge is that I get to work with a huge range of fascinating and dedicated experts who all have their ideas of how to show things visually!
In all seriousness…every new project however small or big is a challenge – but a challenge that I look forward to, and it’s the most important thing at the time.
Tell us about your most memorable project. Why was it memorable?
The day-to-day challenge is sometimes trying to get your head around a particular subject matter that I may have been engrossed in a few days prior to me picking it up again. In the intervening period, I had been doing something totally different in a different subject matter and for a different audience and client.
The project I am working on at the time is always the most important and memorable. There are so many projects that I have enjoyed for many reasons over the years.
What are the things that you wish you knew when you started information design?
Working for prestigious organisations like the IPCC, Davos and the EU agencies is a privilege, as is working for organisations that appeal to me on a personal level such as the BTO (British Trust for Ornithology).
The training I had in illustration, design, science, and communications was invaluable, but I wish I had known that statistics and mathematics would be as important to me as it is nowadays. Luckily, I did do maths to a reasonable level and that has helped me keep on top.
What are you looking forward to in the field of information design in the next decade or so? Any big developments on the horizon?
I wish I had learnt some coding in the past, other than HTML when it first came out. Nowadays, I leave the coding to those that can do it and use their fantastic skills when needed.
The field has always, and is always, developing in its look and feel, as the mediums that we consume graphics on are changing all the time. I am always eager to look at new designs, new ways of showing data (including, video, sound and AI) and the new people coming into the world of information design and data visualization.
What do you think are the top three qualities that every information designer should have?
- Communication skills and the ability to listen, question, understand and learn.
- Be open to suggestions and learn from others.
- Look back and learn from your mistakes.
Do you have book or resource recommendations for anyone who’s looking to venture to information design? How about tips for anyone who wants to consider information design as a career?
There a many books out there so I would say to read as many as you can, read blogs and follow people on twitter and social media to see what is being discussed and produced. Ask questions of people and read comments…our community is always willing to share and discuss – it’s how we improve!
I would also say to keep sketching ideas…a pencil or pen is the thing that allows your ideas to be seen, edited and used or not.
I love what I do now, more than ever, so I would say whatever happens in your career, keep learning, keep questioning, keep sketching ideas and enjoy it.
Apart from information design, tell us about your other projects, hobbies or creative pursuits. How do these hobbies or pursuits help your information design work?
I love nature and the outside world. I have always been keen on walking and birdwatching from a very early age and have kept up this throughout my life – in the summer this can be at sunrise and is a great way to clear my mind and to get away from the stresses of work…it also is the time I get some of my best ideas. I love to travel and get to see and experience new places, people and art. I am always looking for new ways to see and visualise information and to learn.
Editor’s note: The response has been lightly edited and condensed for clarity.
You can read more about Nigel and his wonderful information design work in his blog. We also want to thank him for allowing us to share his story (thank you, Nigel!)
*Read the first part of our information design series – What is Information Design and Why It Matters Now More Than Ever