
If you’re looking to increase organic search traffic and improve rankings, you’ve probably thought about ramping up on visual content.
You’re on the right track.
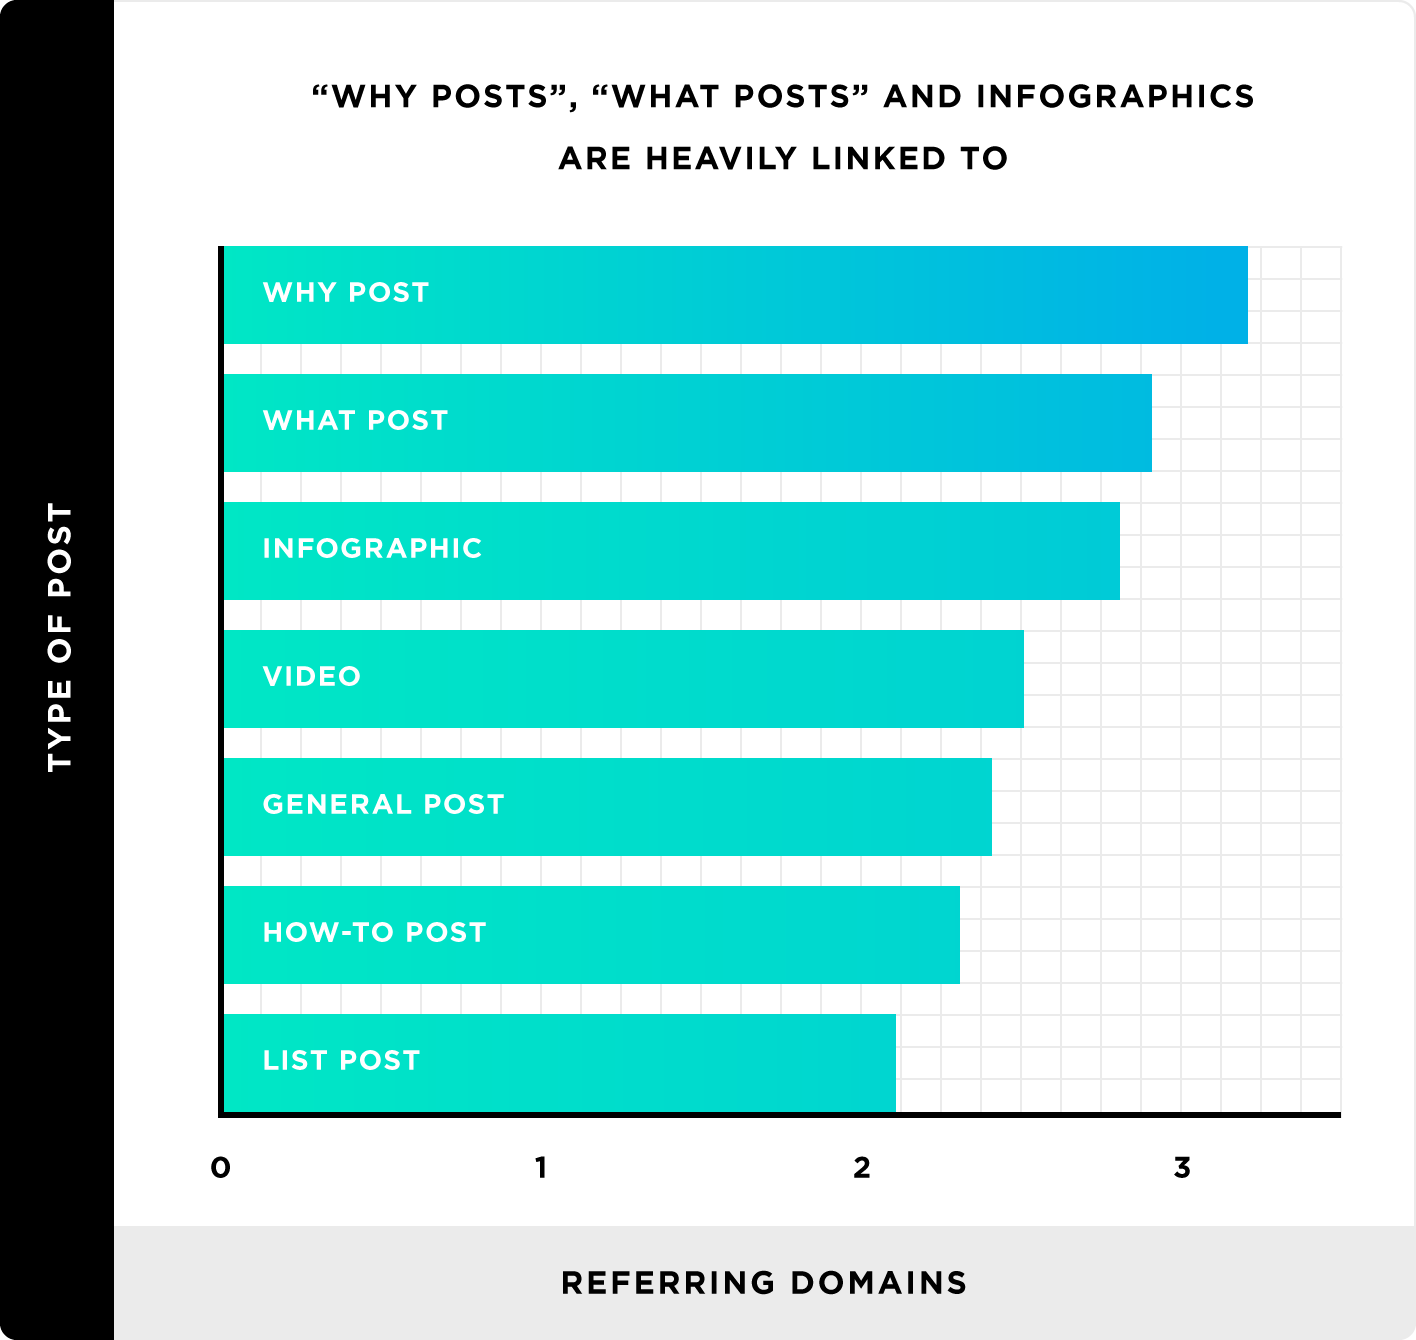
For a start, an analysis of 912 million blog posts by Backlinko and Buzzsumo revealed that visual content assets like infographics are ideal formats for acquiring backlinks through referring domains and social shares.
So how do you get started?
Read on below to learn how to create and promote infographics—from planning to execution—for consistent website traffic every month.
This guide is divided into three parts — planning for your infographic content, the infographic creation process, and promoting your infographic.
It’s a long read (with short videos in between) but we promise that it’s going to be worth it.
Why use infographics for more organic traffic to your website
You’re probably wondering why we’re focusing on infographics in this guide.
First off, it’s what we do best here at Easelly, whether it’s through our simple infographic maker tool or team of infographic designers.
It’s worth noting that most of the principles and steps discussed below will also apply to other types of visual content assets.
1. The visual nature of infographics makes them more shareable.
As to why infographics are perfect tools to help boost your website rankings, Joshua Hardwick of Ahrefs (a well-known toolset for backlinks and SEO analysis) shares two reasons:
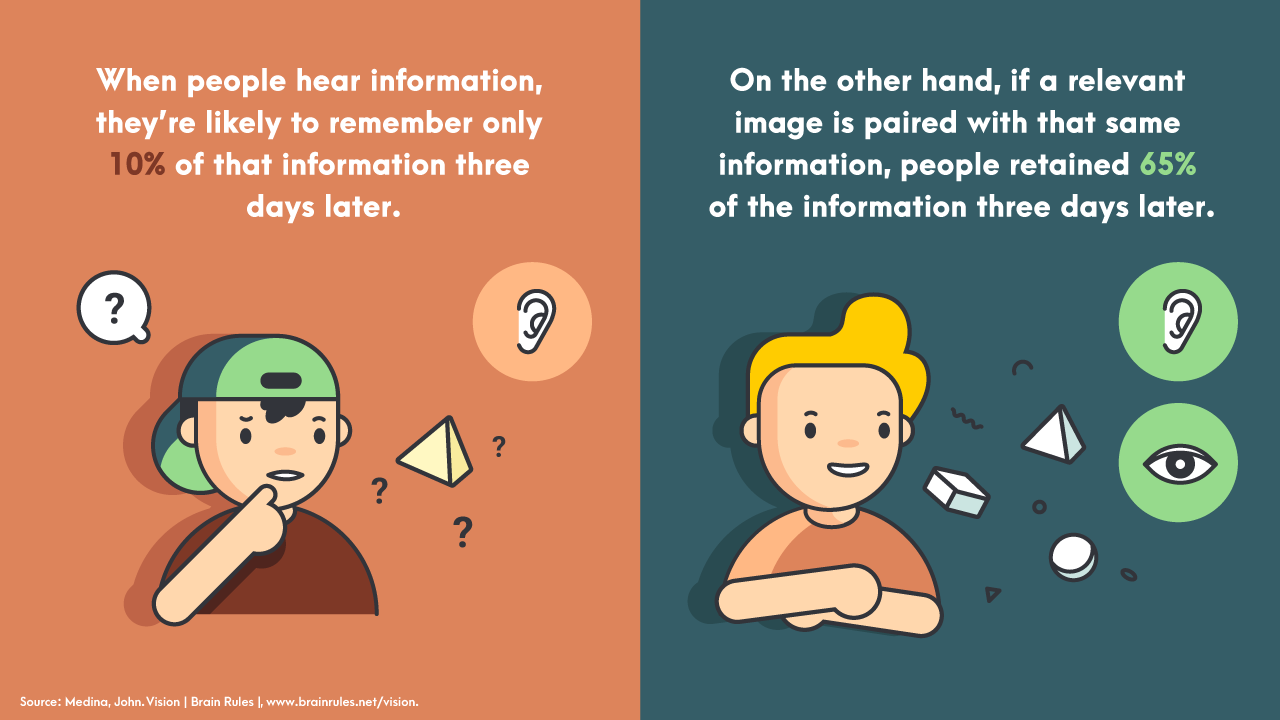
An infographic helps your readers understand and retain your message easily and quickly.
For example, when you hear information, you’re likely to remember only 10 percent of that information after 3 days. On the other hand, if a relevant image is paired with that same information, you are likely to retain 65 percent of the information after 3 days.
From illustrating a complicated process to sharing statistics, the visual nature of infographic content makes it easier for your audience to understand in contrast to written content.
When your audience finds your infographic easily understandable, they’re also likely to hit the share button.
2. You can embed infographics easily.
For site owners, it’s easy to embed an infographic in a blog post and share them with their audience.
For these reasons, well-designed infographics are powerful tools to attract links to your website and build website authority.
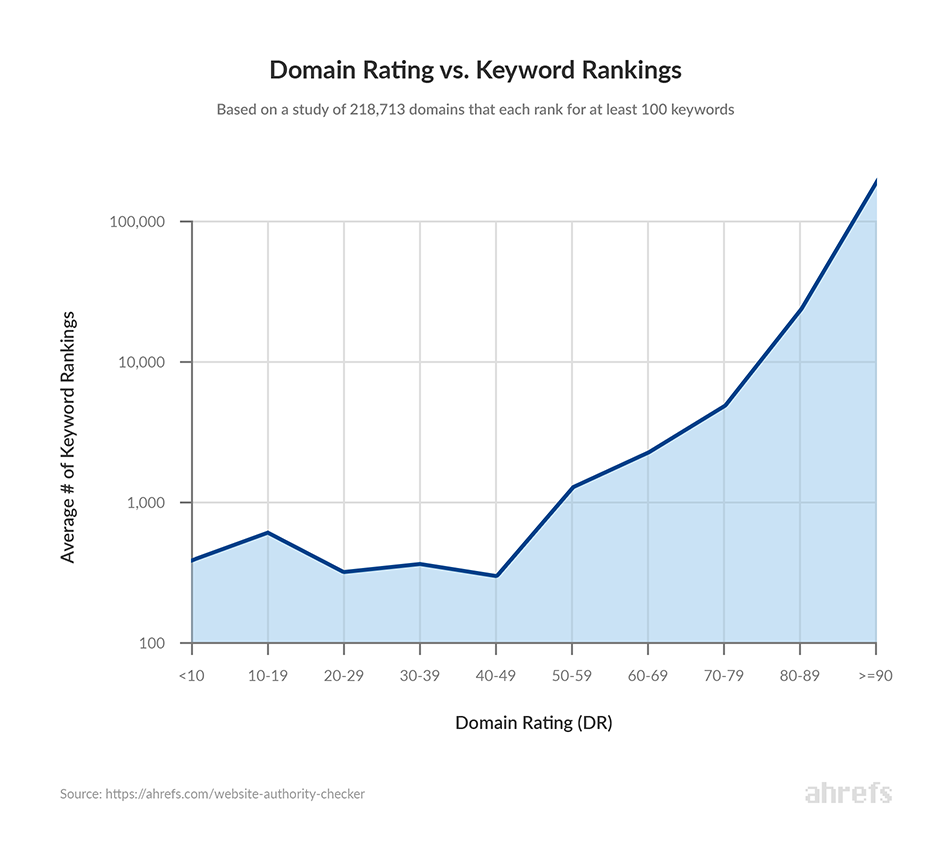
As the number of backlinks to your website grows, your Domain Rating is also likely to go up.
Domain Rating is a proprietary metric by Ahrefs highlighting the strength of a target website’s total backlink profile. Ahrefs have observed a clear correlation between Domain Rating and the number of keywords a site ranks for.
The infographic below is an example of a successful infographic that’s getting a fair amount of traffic and referring domains.

Want to develop a better work routine? Discover how some of the world’s greatest minds organized their days.
Click image to see the interactive version (via Podio).
It’s easy to get this valuable data using Ahrefs’ Site Explorer tool.
Paste the URL into Site Explorer, and you’ll see the number of referring domains that a particular infographic has managed to rack up.
If you can attract a significant number of links to an infographic on your website, it makes sense to directly link from that page to a “money page” to help improve its rankings.
What’s a money page?
These are pages in your site that drive revenue like sales pages, but people often don’t want to link to them because they’re “too commercial” and have little to no value for their audience. For e-commerce sites, that’ll be your product and category pages. For other businesses, it’ll be your landing pages.
Joshua of Ahrefs cites a great example:
Let’s say that you sell antibacterial soaps online. It might be challenging to get links directly to your product/category pages unless someone is a fan of your soaps. But what you could do is create an infographic based on a survey of how frequent people wash their hands.
Chances are, it would make for interesting content that others would want to share – and in doing so, they would link to your site and embed your infographic.
Think of your infographic as your middleman to help build website authority.
Now that you’ve learned why infographics are assets if you want to drive organic traffic to your website and deliver value at the same time, let’s dive into the nitty-gritty of infographic creation.
Part 1: Planning the content of your infographic
Your first step is to have a clear vision of your infographic purpose.
Besides your initial goal of attracting links and building authority, you have to nail down your goal in creating the infographic.
Are you planning to present trends and patterns? Would you like to compare products or services?
Watch the short video below to help you come up with a winning idea for your infographic.
How to come up with a winning idea for your infographic (video)
Once you have your infographic creation goal nailed down, your next step is to plan for the content of your infographic.
At this point, you can make a plan based on the following:
A. If you want to create an infographic with original content
B. If you want to support, update, or complement an existing piece of content with an infographic
Planning for original infographic content using Ahrefs
If you prefer to make original infographic content, use Ahrefs to research which topics are popular in your niche.
In other words, what topics are people interested in?
Let’s say you’re an agency in the health and wellness space and you’re helping a client boost traffic through infographics. You have two options.
Method 1: Identify your competitor’s top content using Ahrefs’ Top Content report in Site Explorer.
Ahrefs’ Site Exlorer tool enables you to have an in-depth look at the organic search traffic and backlink profile of any website or URL.
It can help you identify the most popular content on other sites in your niche.
Site Explorer -> type competitor domain -> Top Content
In this example, we use greatist.com, a popular site in the health and wellness space.
Here’s what it looks like for greatist.com:
Site Explorer -> type greatist.com-> Top Content
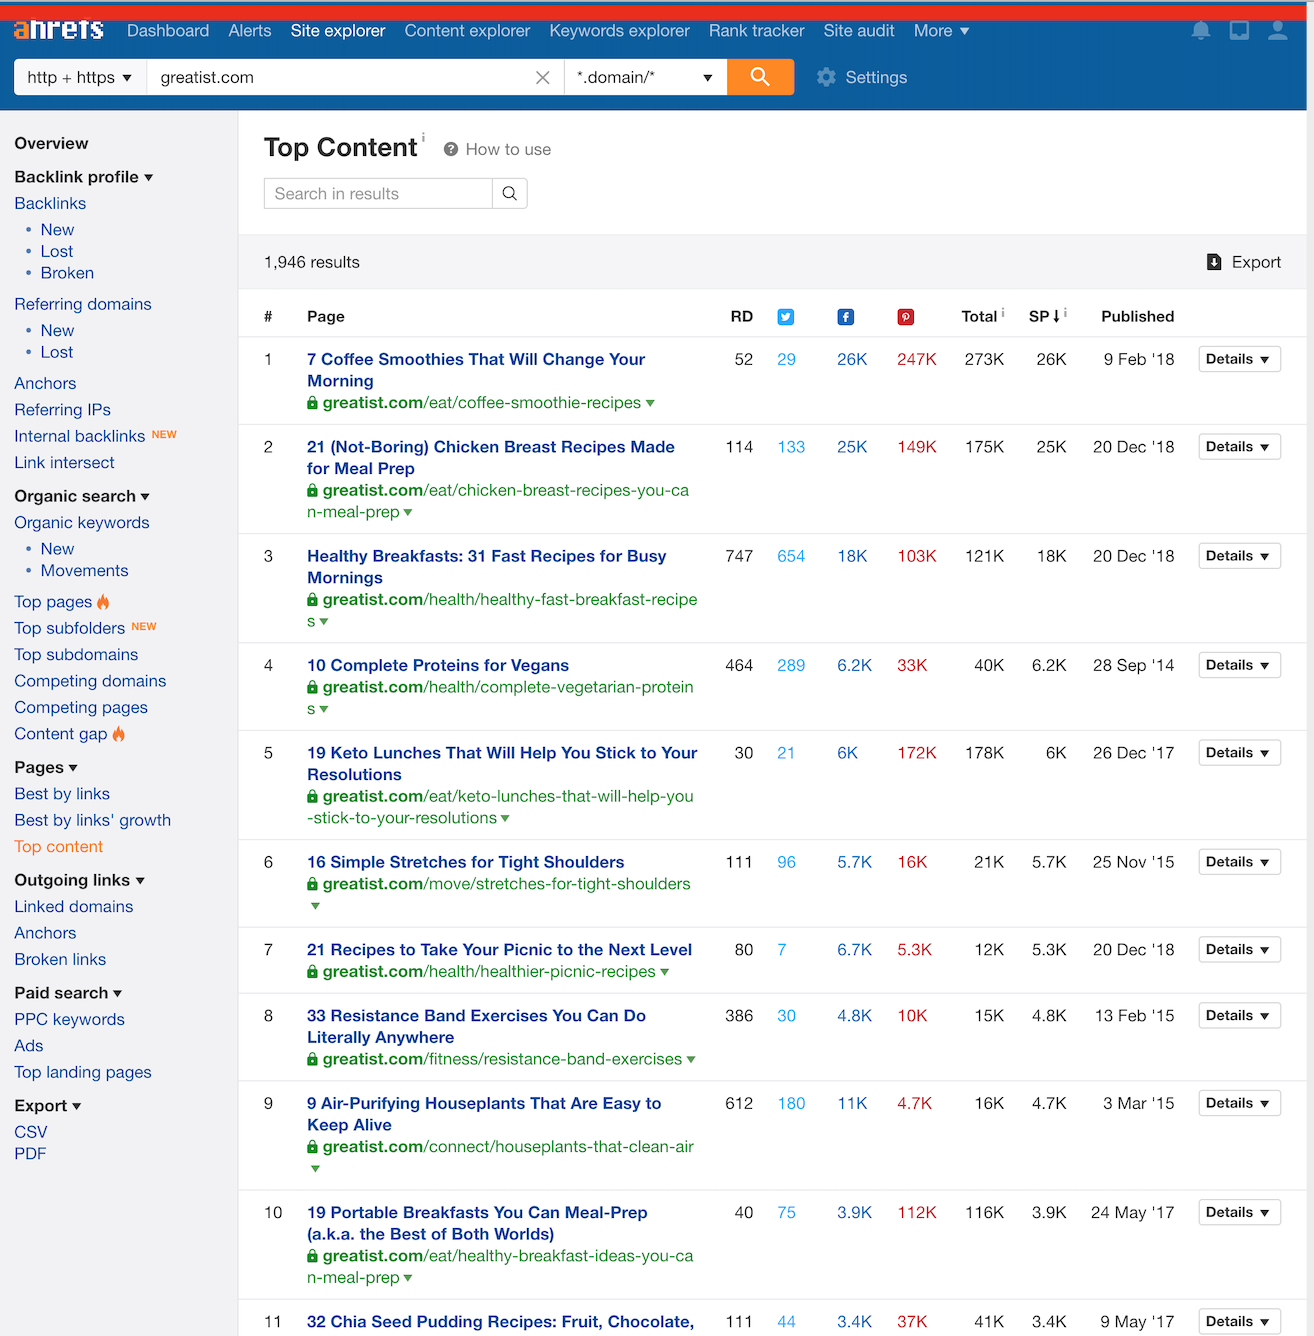
From this report, you’ll be able to get an idea of your competitor’s top content.
Your next step is to plan for infographic content around these topics. These topics are what your target readers deem worthy of links and engagement. However, you have to make sure that your infographic content provides more value than the existing piece of content — often referred to as 10x content.
For example, if you plan to make an infographic on “Air Purifying Plants” (it’s on the list of Greatist’ top content based on social shares), here are some ideas on how you can make this blog post 10x better with infographics:
- Create an infographic of the plants with details on how to take care of them.
- Design an infographic that talks about the right air purifying plant if you’re living in a small city condo or apartment.
- Make an infographic that shows exactly how these plants clear the air from toxins, etc.
Pro-tip: Don’t limit yourself to improving a list of nine plants by adding more to the list. It might look better at first glance, but in reality, your new content adds nothing of substantial value to your audience.
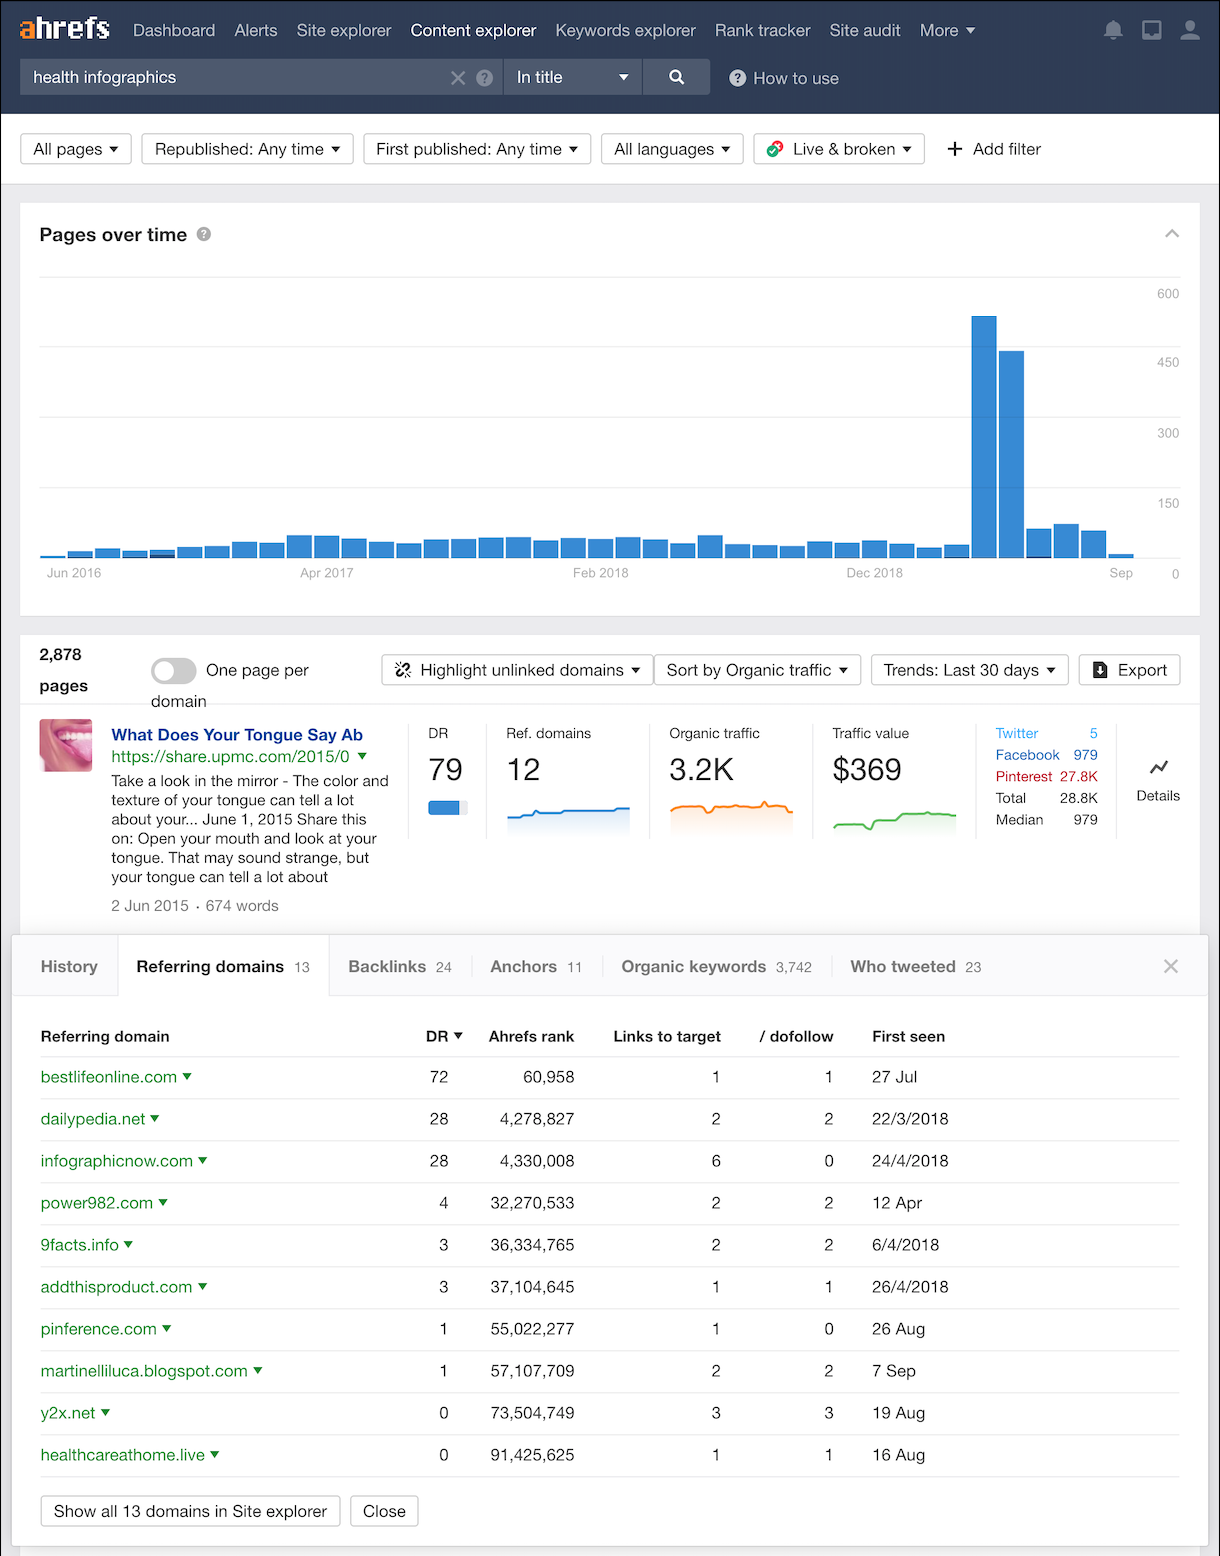
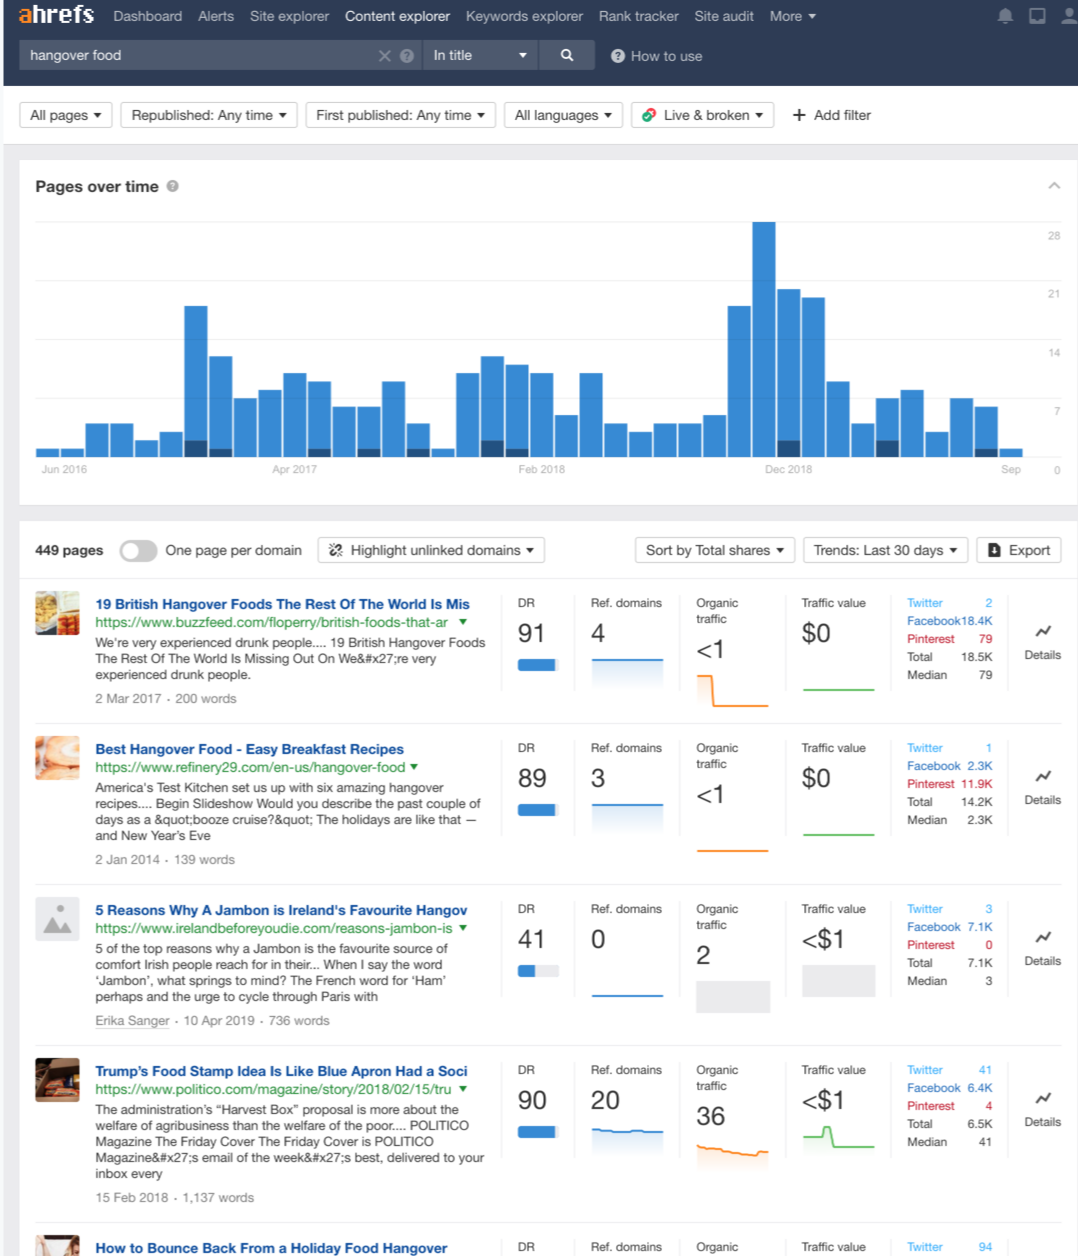
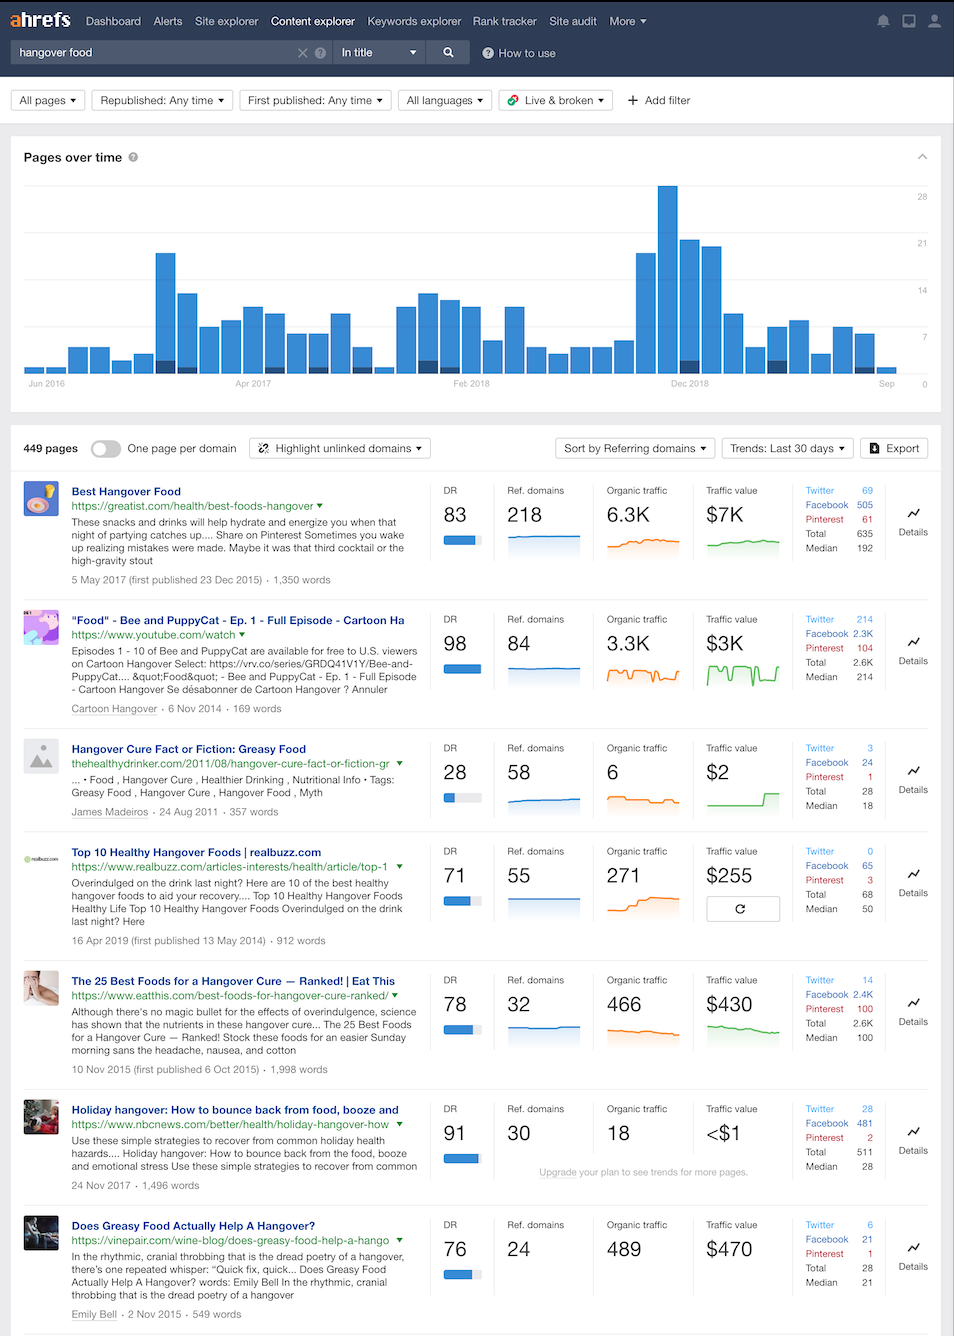
Method 2: Identify content in your niche with the most number of social shares using Ahrefs’ Content Explorer.
Ahrefs’ Content Explorer helps you discover and analyze top-performing content in your niche. You can sort results by organic traffic, social shares, referring domains, Domain Rating, and traffic value.
In the examples below, let’s use “hangover food” as the keyword. Next, were’ going to find out which related content has the highest number of total social shares and referring domains.
Content Explorer -> In Title -> Sort by Total Shares
Content Explorer -> In Title -> Sort by Referring Domains (Linked Domains)
Now that you have a list of content with the highest number of shares and linked domains, you can plan for infographic content around these topics.
With “hangover food” as the keyword, the article “Does Greasy Food Actually Help with a Hangover?” is a good candidate for 10x content because the content in the blog post has more room for improvement.
If you want to create 10x content on the topic on your site, write a more detailed article on the subject and create infographics on the following topics:
- The Science of Hangovers
- 10 Food Items to Stock in Your Pantry for Your Next Hangover Emergency
- X Science-Backed Ways to Avoid a Terrible Hangover
Updating old content with infographics using Ahrefs
Let’s say you’re planning to create infographic content for one of your clients in the health and wellness space- Parsley Health.
You can use Ahrefs to identify pages or blog posts on Parsley Health’s website that you can update through infographic creation. How?
Method 1: Use the “Top Pages” report in Ahrefs’ Site Explorer
Using this tool in Ahrefs enables you to see what keywords your clients’ competitors rank for in search and how much traffic each keyword brings them.
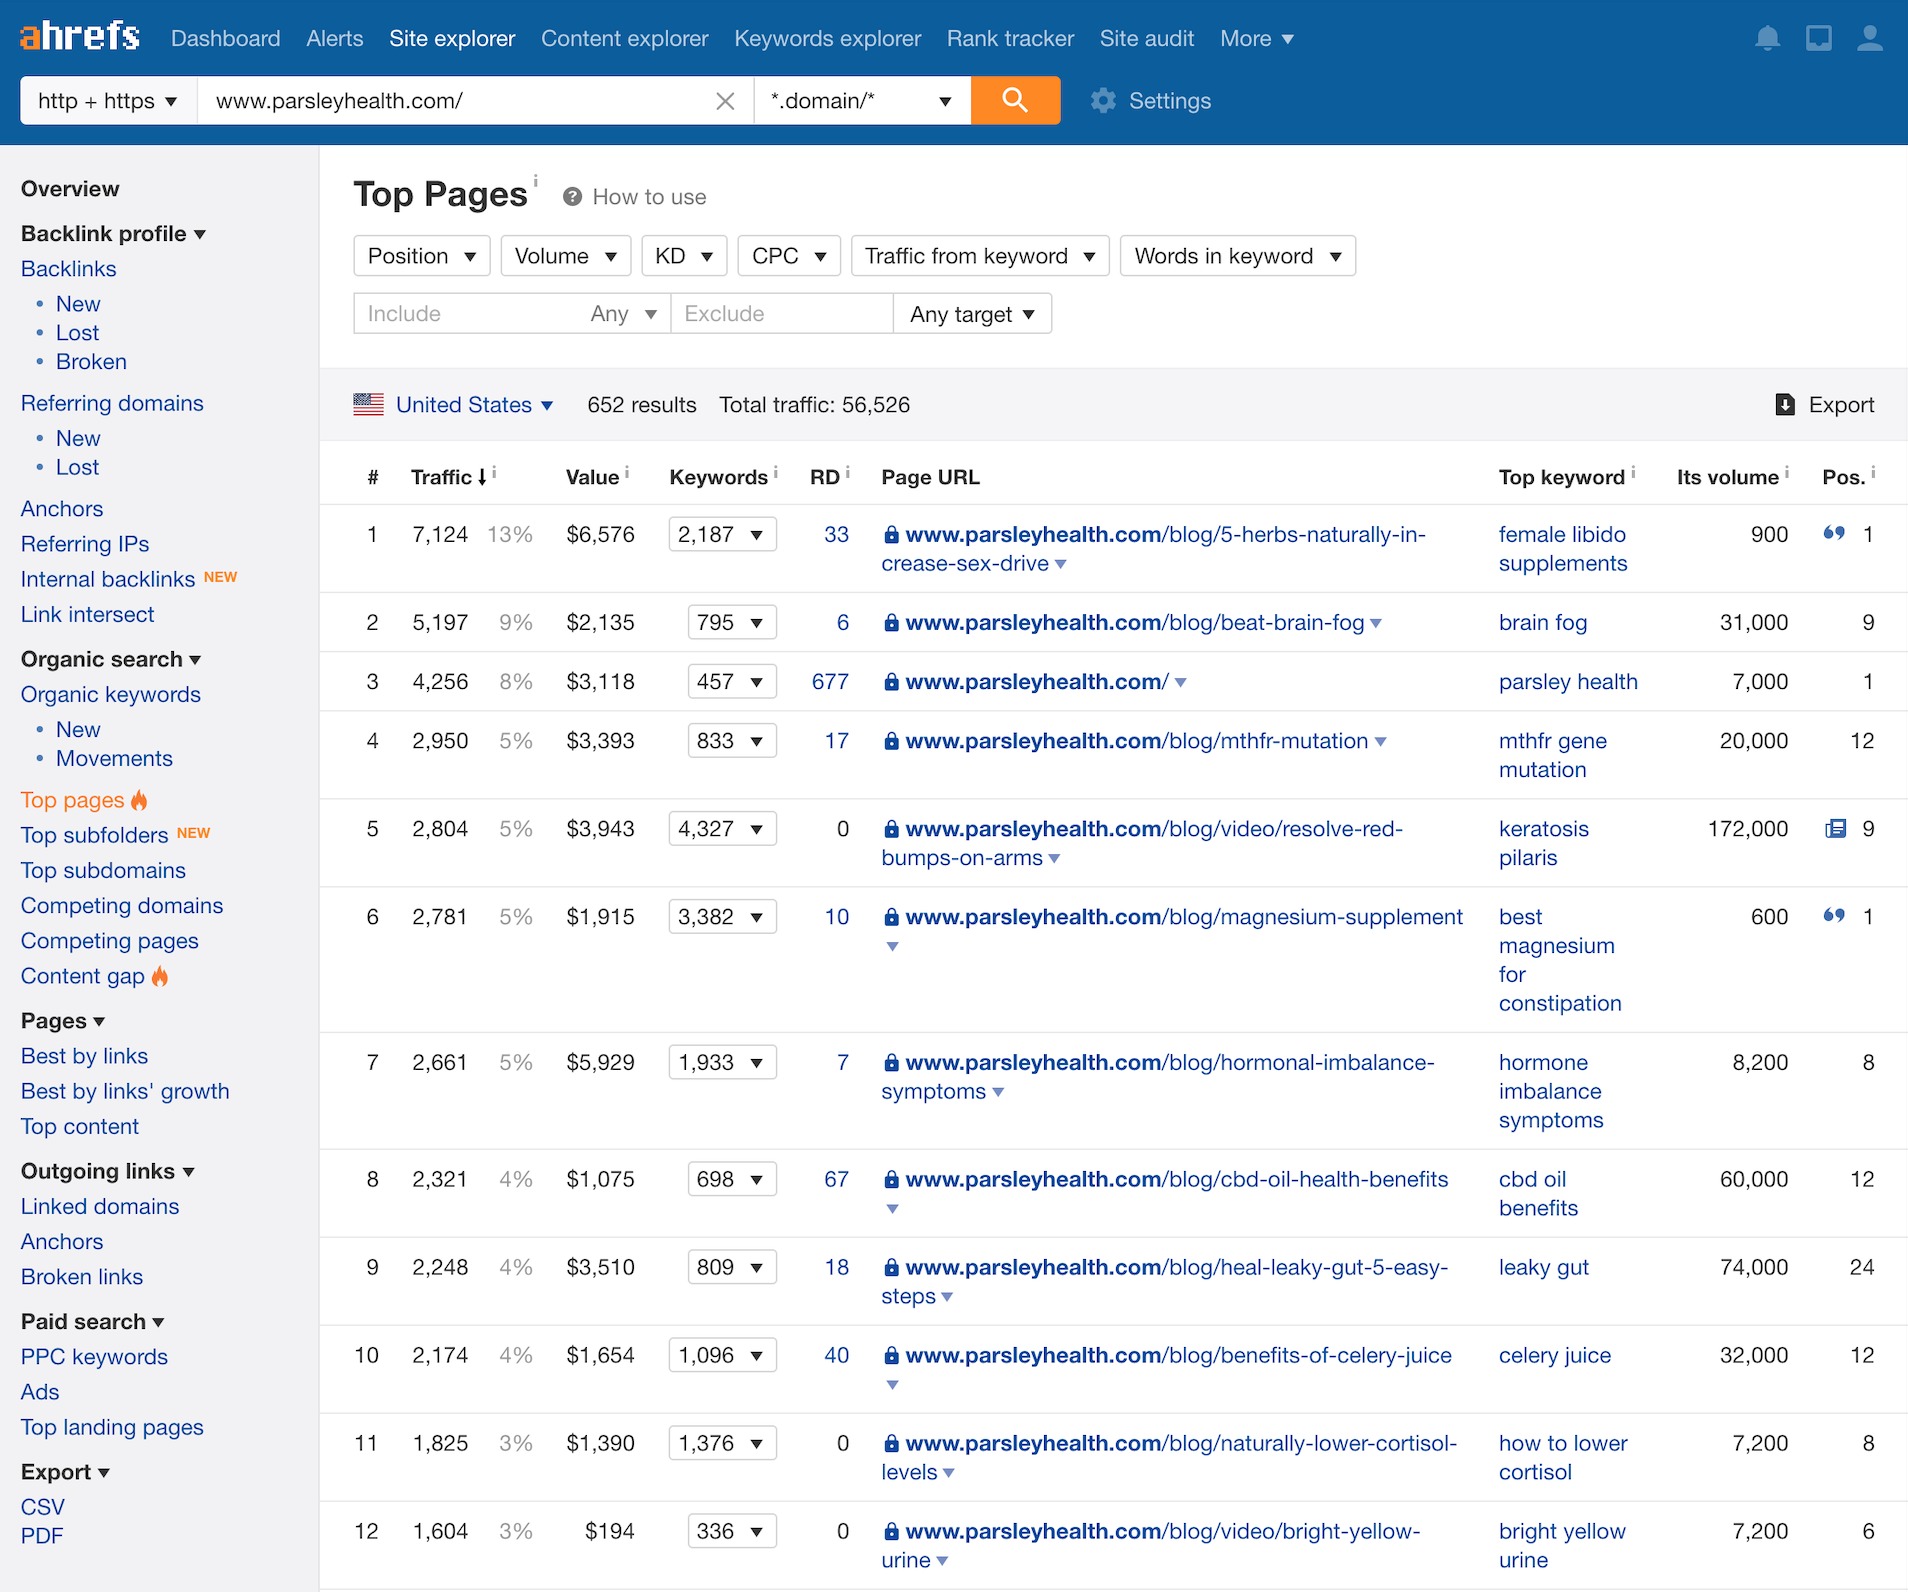
From this list, choose at least 3 pages and update them by adding a new infographic.
For example, the blog post with the URL – https://www.parsleyhealth.com/blog/cbd-oil-health-benefits – has 67 referring domains.
Your next step is to add an infographic or visualize each section in the old article.
Adding an infographic improves the usefulness and shareability of your article. Since the page is already getting a lot of traffic, some of these people will likely link back to the article by sharing or embedding your infographic to their site.
This technique increases backlinks to your top page, and potentially improves rankings even further.
Method 2: Use the “Top Content” report in Ahrefs’ Site Explorer.
The Top Content report in Ahrefs’ Site Explorer shows you which pages on a given website have the most social shares.
Here’s an example analyzing the top pages on Parsley Health via the most number of shares on Facebook:
In this example, the second page on the list – 5 Essential Blood Tests You Need Every Year is a good piece of content to transform into an infographic. It has 1,600 shares on Facebook so that means people find it useful. You can make it more shareable with an infographic.
Whew! Now that you’re done planning for your infographic content, your next step is to make sure that you have high-quality sources of data and information.
Best practices in conducting research for your infographic
A well-designed, effective infographic is also a result of the following best practices when gathering information and transforming them into insights:
- Explore other perspectives to avoid biased information.
- Find the central idea of the numbers or data you’ve gathered.
- Turn your stats and figures into a compelling visual story by coming up with a beginning that captures readers’ attention, a middle filled with rich insights and data, and finally, a satisfying conclusion.
- Envision what your infographic would look like by knowing the different types of infographics beforehand.
- Pull data and information from reputable and validated sources.
Use the infographic checklist below as a quick reminder every time you’re about to start an infographic project.
Part 2: Creating your infographic
You’ve already decided on the topic, information, and type of infographic that you want to create. You’ve made sure that credible sources back your data. Your next step is to design your infographic!
At this point, you have two options — find an infographic designer to make one for you or do it yourself.
If you prefer to outsource, hiring freelancers is often the case. The good news is you can hire a team of professional infographic designers with quick turnaround times.
If you prefer this option, an infographic design brief is a must to help ensure that you and the designers are on the same page.
It’s worth noting that briefs are also helpful even if you want to go the DIY route (discussed in detail below). Think of creative briefs as your northern star.
Making infographics from scratch
If you prefer to go the DIY route, hats off to you!
Whether you have design experience or doing infographics for the first time, here are some valuable tips to get you started.
1. Start with an outline.
Whether you prefer structure or going-with-the-flow when starting an infographic design project, an infographic outline serves as a checklist to ensure that you’ve covered every tidbit of the message or idea that you want to communicate.
2. Be mindful of your infographic color scheme.
Your choice of infographic colors is equally important. It’s not uncommon for anyone new to infographic creation to use too many colors at once. We’ve all been guilty at some point!
Here are some good practices for choosing the best colors for your infographic:
- Match your infographic’s color to the overall mood that you want to convey in your infographic.
- Understand the basics of color theory and psychology.
- Draw inspiration from the 60-30-10 color rule of interior designers.
- Use your brand colors.
- Stick to 2-3 colors.
- Consider accessibility through careful consideration of color contrast.
- Take white space into account.
3. Write clear, concise infographic copy.
Writing infographic copy is like packing light.
When you’re packing light for a week-long trip, you learn not to take every favorite piece of clothing with you. You discover how to nail a good balance between function and aesthetics.
Here are some good practices for writing infographic content:
- Write your infographic headline with intention.
- Craft an introduction that supports your infographic headline.
- Think of your subheadings as guideposts that will further prompt your audience to read the rest of your infographic.
- Use text to support your visuals (not the other way around).
- Attribute correctly. Add footnotes and sources.
- Use charts, graphs, pictograms. Label them correctly.
- Check for typos, spelling errors, and grammar mishaps.
- Replace BIG, complex words with simple writing – clear, concise, and relevant.
- Don’t be afraid to edit, rewrite, or rephrase your infographic copy. If possible, ask a colleague or professional editor to go over your content.
- When crafting infographic copy, ask yourself – does the audience need to know this? If the answer is no, kill your darlings.
4. Always write a call-to-action.
Add your call to action statement at the bottom of your infographic.
A well-designed infographic is not effective if you don’t have a call-to-action statement asking people to share it on their social media profiles or to contact you for more questions.
5. Consider using infographic templates.
There are claims that templates can stifle creativity. But does it really?
At Easelly, we believe that limitations such as pre-made templates can help boost creativity. Creating something new despite the lack of time and resources is a creative act in itself. Think of infographic templates as springboards for infographic ideas.
Ready to get started? Take a look at the following tutorials in finding and customizing infographic templates in Easelly:
How to find infographic templates in Easelly (video)
How to customize infographic templates in Easelly (video)
Part 3: Publishing and Promoting Your Infographic
The final step is to publish your infographic and generate relevant social buzz about it!
Infographics are versatile. You can readily share them on your site, social media, and other websites. You can either divide them by sections or publish the entire infographic itself.
Before you promote your infographic, bookmark the following cheat sheet on right infographic size and dimension.
When promoting your infographic in social media , here are some best practices you can follow:
- When sharing your infographic on Twitter, include the hashtag or anything trending in your niche to help with discoverability.
- Use JPEG or PNG versions of your infographic when publishing it on your blog or website directly. This works best if the infographic is not super long. You can chop up a lengthier infographic into social media-friendly sizes.
- Utilize LinkedIn by using their individual publisher. Add your infographic, some of the original post, and a link to your website!
- Create an animated infographic to post on Facebook or Instagram to announce your new post and infographic. Instagram stories are becoming popular for expanding on content ideas and getting people engaged. You can also try infographic videos.
- Share chunks of your infographic. These snippets could be tips or quotes from the original infographic that will entice people to check out the original infographic from Facebook, Instagram, or Twitter.
- Consider submitting your infographic for approval to infographic directories
- Take image SEO into account when publishing your infographics on your blog or website. The short video below highlights image optimization tips that you can do right away.
A 7-step checklist to optimizing images for search engines
Outreach Using Ahrefs
What’s outreach?
It’s a link building tactic where you reach out to people in your niche and introduce them to your content.
These people may include the following:
- Websites that mention your target keyword in their articles or infographic
- Websites that link to similar articles on the topic
Websites that mention your target keyword in their articles or infographic
Let’s say you have an infographic about hangovers.
Your goal is to find websites that have featured similar infographics using Ahrefs’ Content Explorer and then reach out to see if they’d be interested in featuring your infographic—which will probably be in a new post or separate infographic.
In the example below, we use “hangover” and “infographic”.
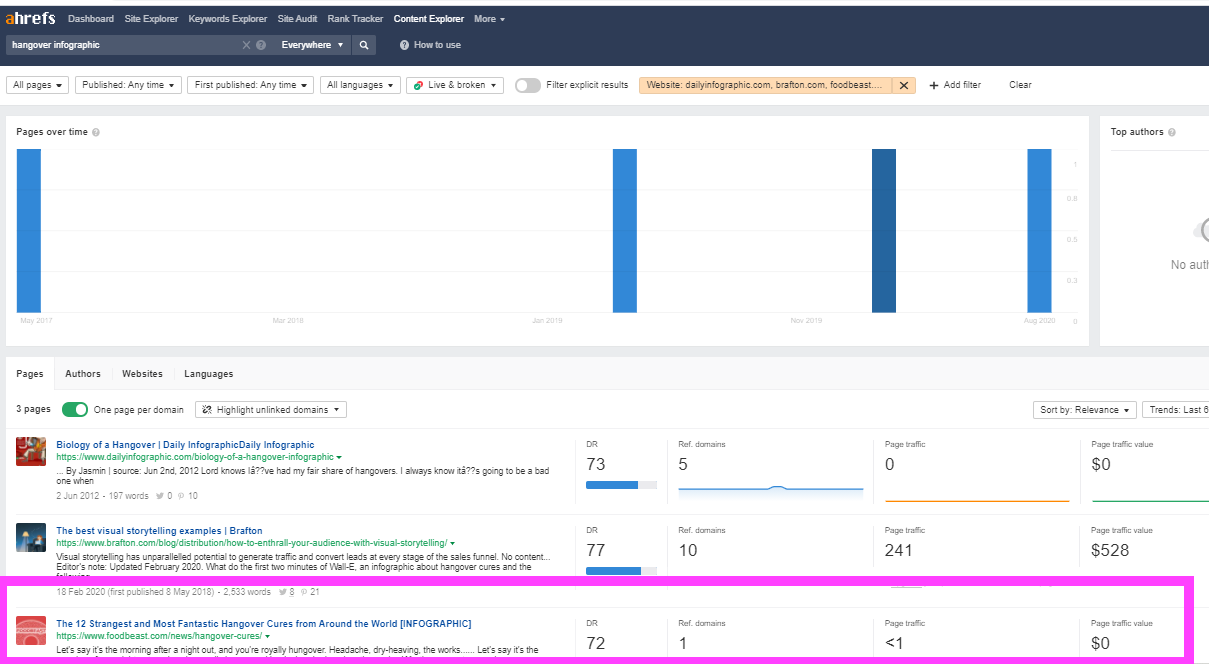
Pro-tip by Ahrefs: Instead of typing “keyword” + “infographic,” in Content Explorer, use [infographic] to get more specific results. Most of the pages with “[infographic]” in the title will be featuring third-party infographics.
From the results, this website has featured an infographic about hangover cures from a third-party- https://www.foodbeast.com/news/hangover-cures/
What does this tell us?
There’s the possibility that the website admin or editor may be interested in covering future content (including infographics) about that topic.
So we could reach out to them and ask if they’d be interested in featuring our infographic—which may be on a related subject like “Does Greasy Food Actually Help with a Hangover?”
Be intentional with your email outreach. Your goal is to build a relationship and share value through your visual assets.
Websites that link to similar articles on the topic
If you’ve already found a similar infographic or article to your infographic, use Ahrefs’ site explorer to see who links to it.
For example, take the previously mentioned infographic about hangover cures posted on Foodbeast.
If you scroll to the bottom of the article, you see a source link to the original version of the infographic.
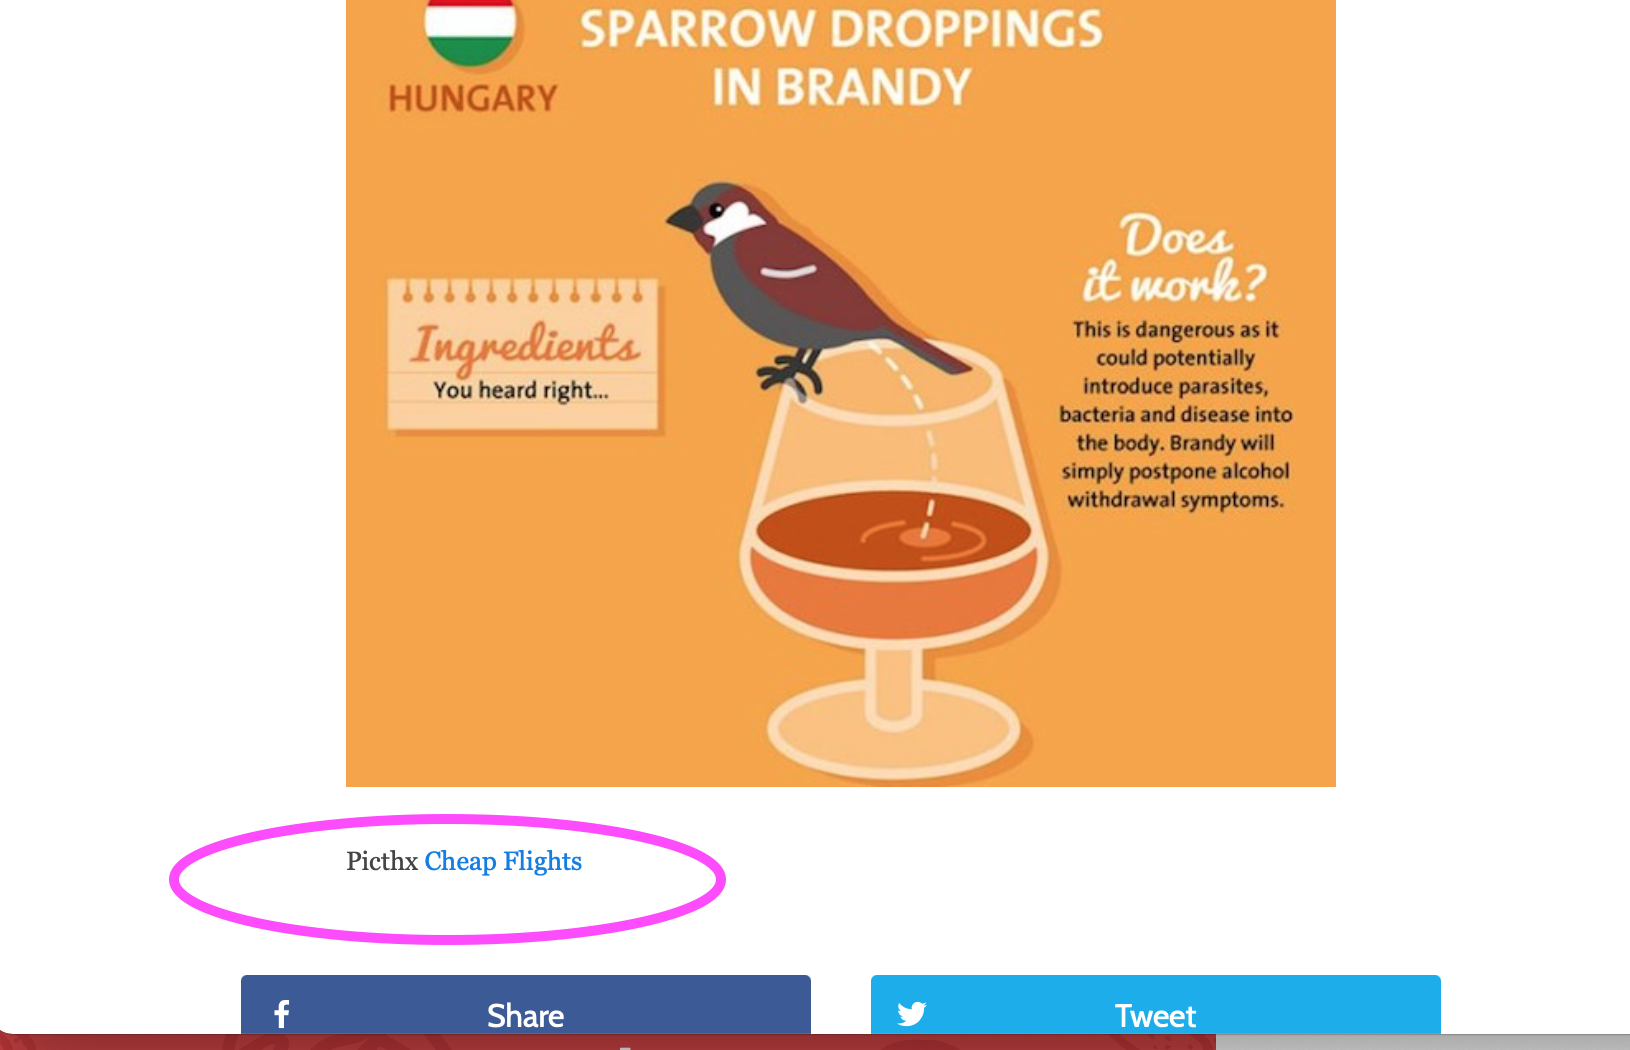
If you plug that URL into Ahrefs’ Site Explorer, you will find a bunch of other websites that have featured/linked to that infographic.
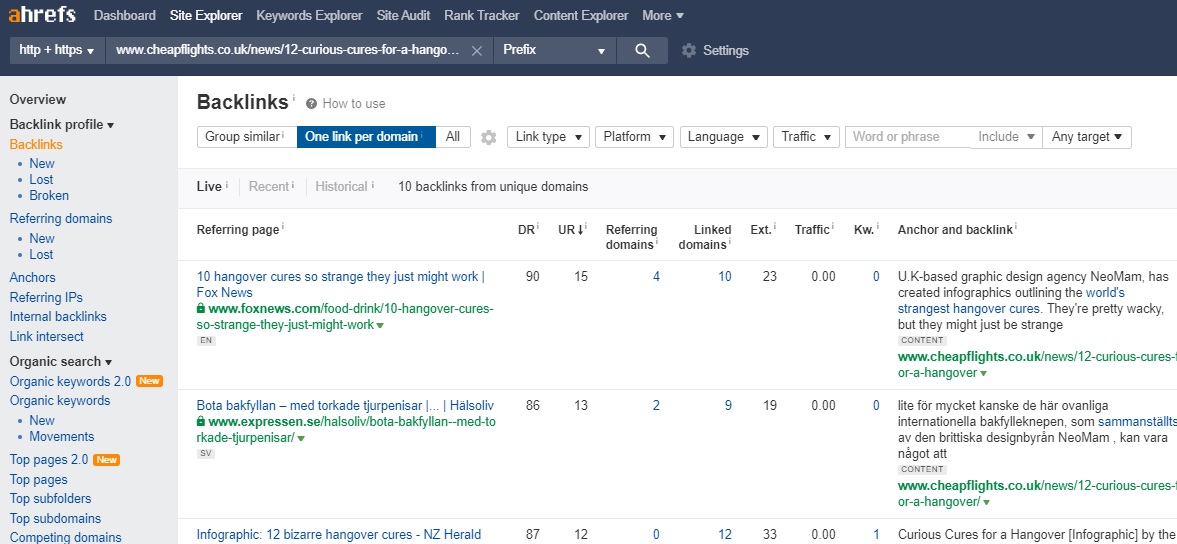
These are sites where you might want to consider pitching your related infographic—as long as it makes sense to do so.
Joshua wrote a step-by-step guide about it in 9 Link Building Strategies that You Can Use.
Finally, here’s an example of an email outreach asking an editor or content manager to link to your infographic:
Hi, Vernon.
My name’s Kai, and I do content+community for Easelly. We just created an infographic about hangover cures and how to eat (or drink!) your way to a hangover fast.
This infographic has been downloaded more than 2k times and has been retweeted more than 3x times, so I wanted to make sure you had a chance to check it out. Here’s the link to the infographic.
Let us know if you think that it’s a good fit for your audience in your health and wellness blog.
Best,
Kai
Your turn to improve website rankings with infographics
Creating infographics and transforming them into visual assets to boost website rankings may look like a lot of work. Don’t rush things and take it one small win at a time. Focus on creating quality work.
If you need infographic creation help, our infographic designers would be happy to help.
Alternatively, you can start with pre-made infographic templates using our simple infographic maker tool.
*Special thanks to Joshua Hardwick of Ahrefs for the guidance, insights, and patience in creating this guide.
*Editor’s Note: This post was updated on February 8, 2021 for accuracy and comprehensiveness. It was originally published on December 11, 2019.