Visual aids are more than just eye candy.
Whether it’s for a school report or a business conference, visual aids are a great entryway to get people to pay attention to the data or information you’re presenting.
Case in point infographics are helping save lives during the COVID-19 pandemic. Health care organizations, government offices, and media outlets use visuals to deliver vital information to the public.
Effectiveness of visual aids in teaching and learning
Why use visual aids?
The short answer: Your brain loves looking at pictures.
A combination of visuals and text has been shown to promote learner engagement and information retention in numerous research findings.
One notable review of scientific literature by the Educational Technology Research and Development revealed that using illustrations with text instructions helps people perform a task 323 percent better than those who follow the text instructions without visuals.
Keep scrolling (and reading!) for editable infographic templates that you can use as visual aids for your next presentation.
The first part will include visual aids for school, while the second section will highlight visual aids that you can use for your business presentations.
Infographics as visual aids in the classroom
The use of visual aids in the classroom can boost learning to up to 400 percent. Plus, a study on the impact of visual aids on the learning process of students revealed that visual aids are effective in the classroom for the following reasons:
- Motivates students to learn
- Enhances vocabulary
- Simplifies content
- Saves time with lesson preparation
- Keeps students engaged
- Stimulates learning as sensory objects like visual aids can provide direct experience
Here are the most effective ways to use infographics as visual aids for your next classroom presentation.
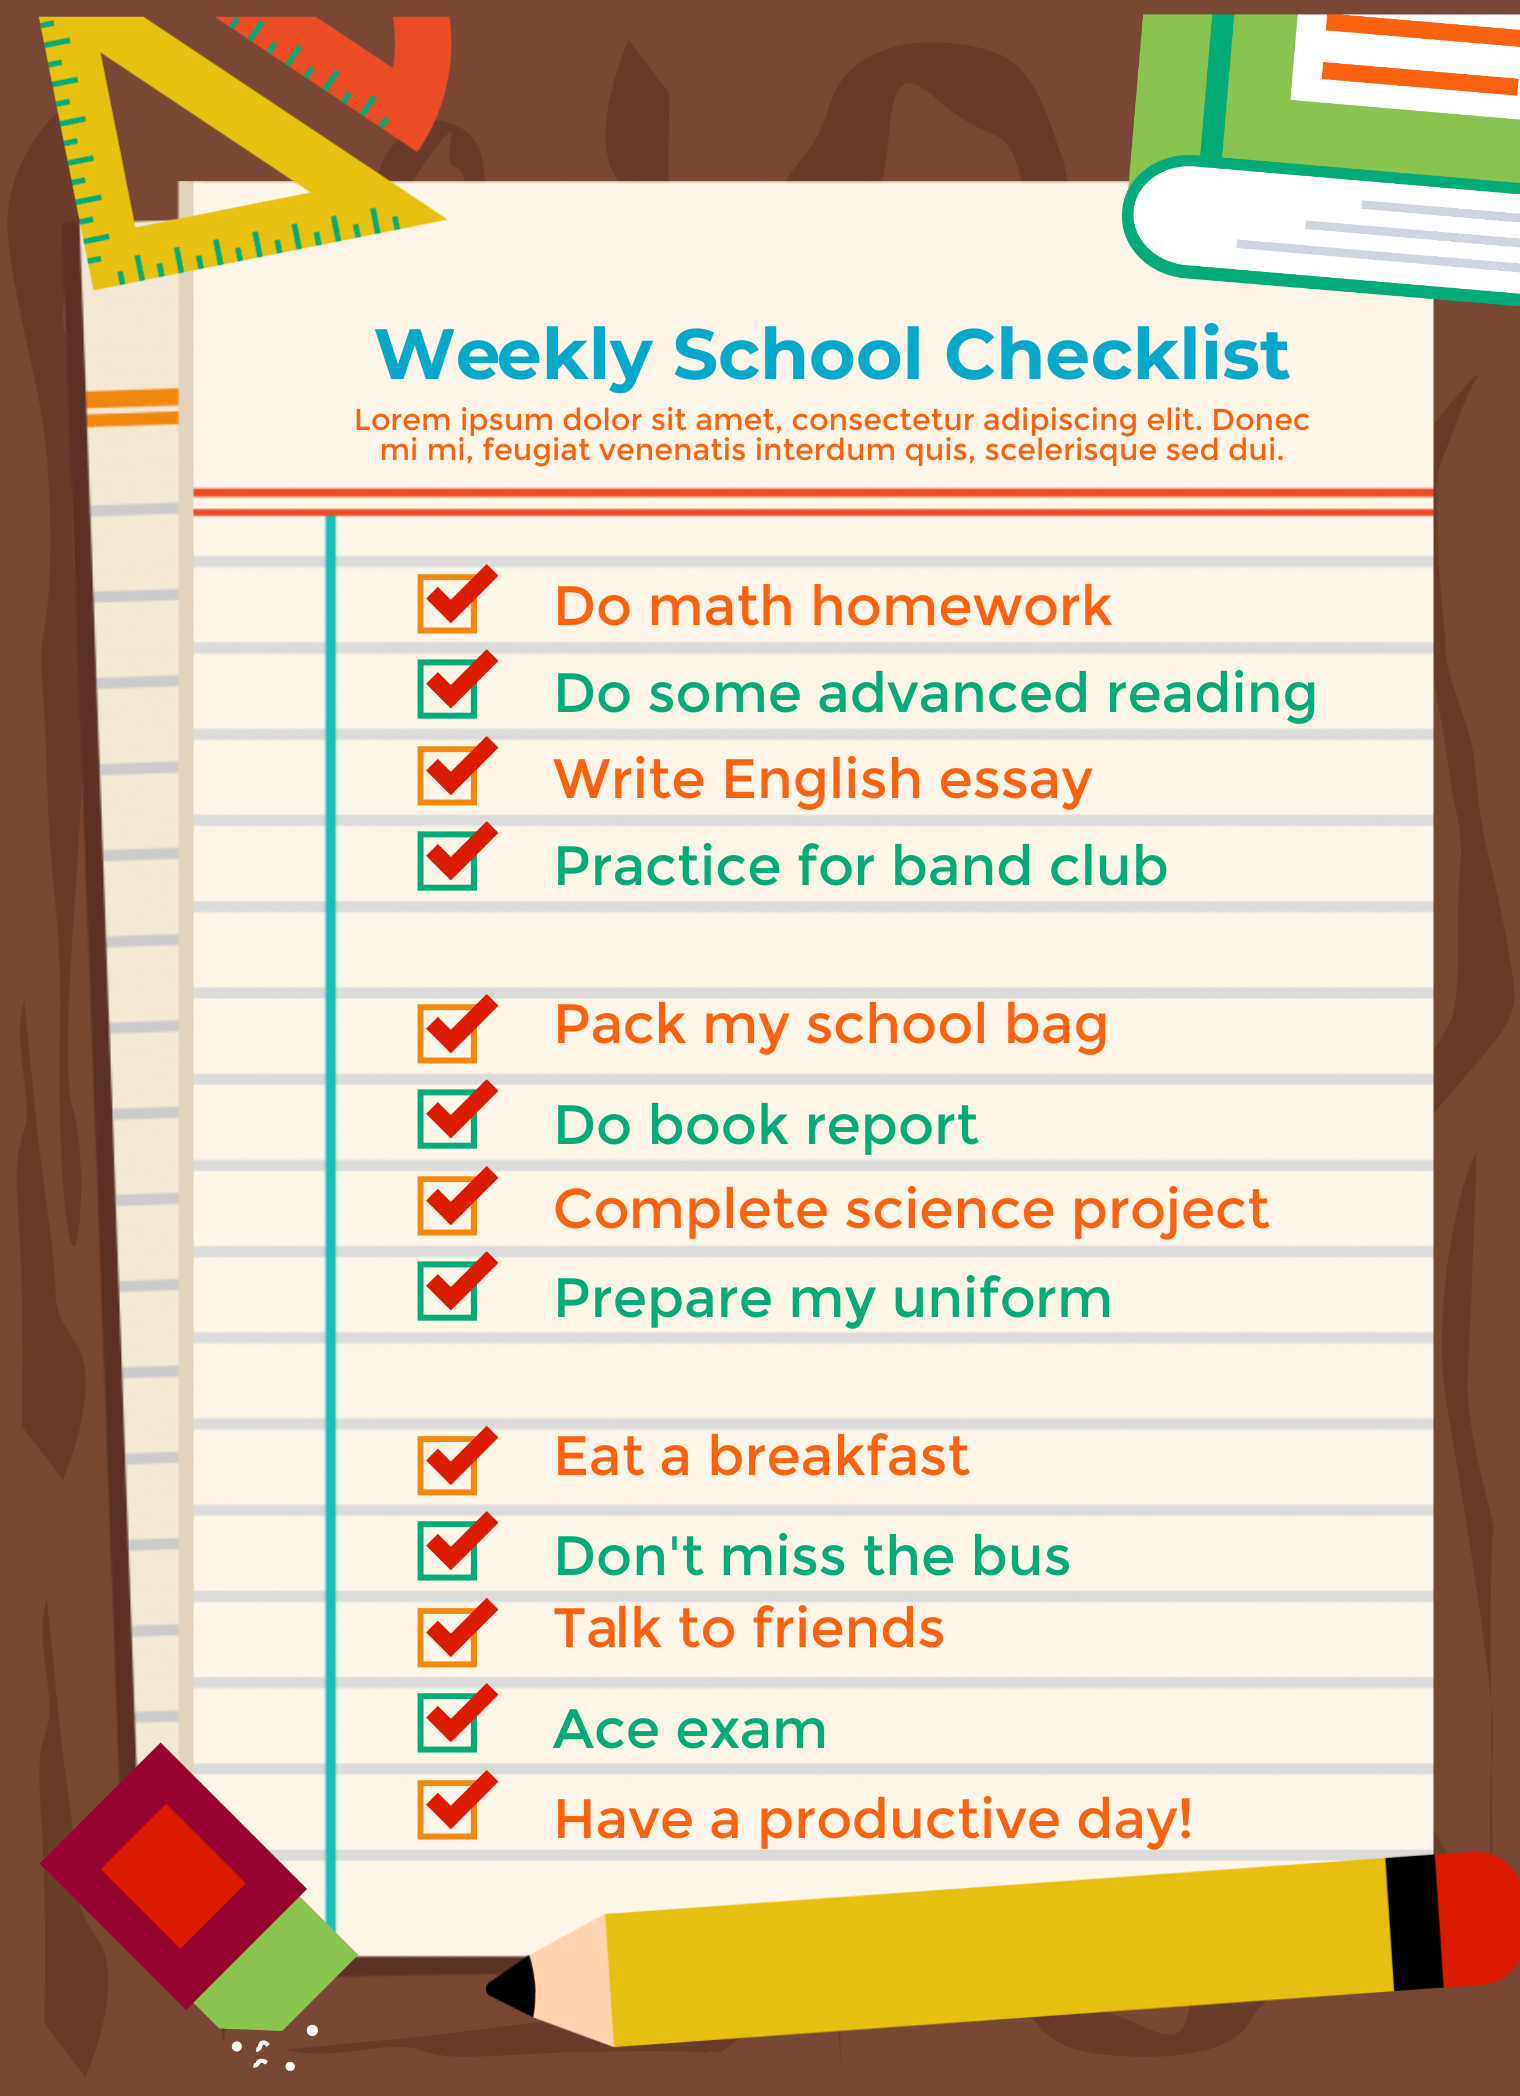
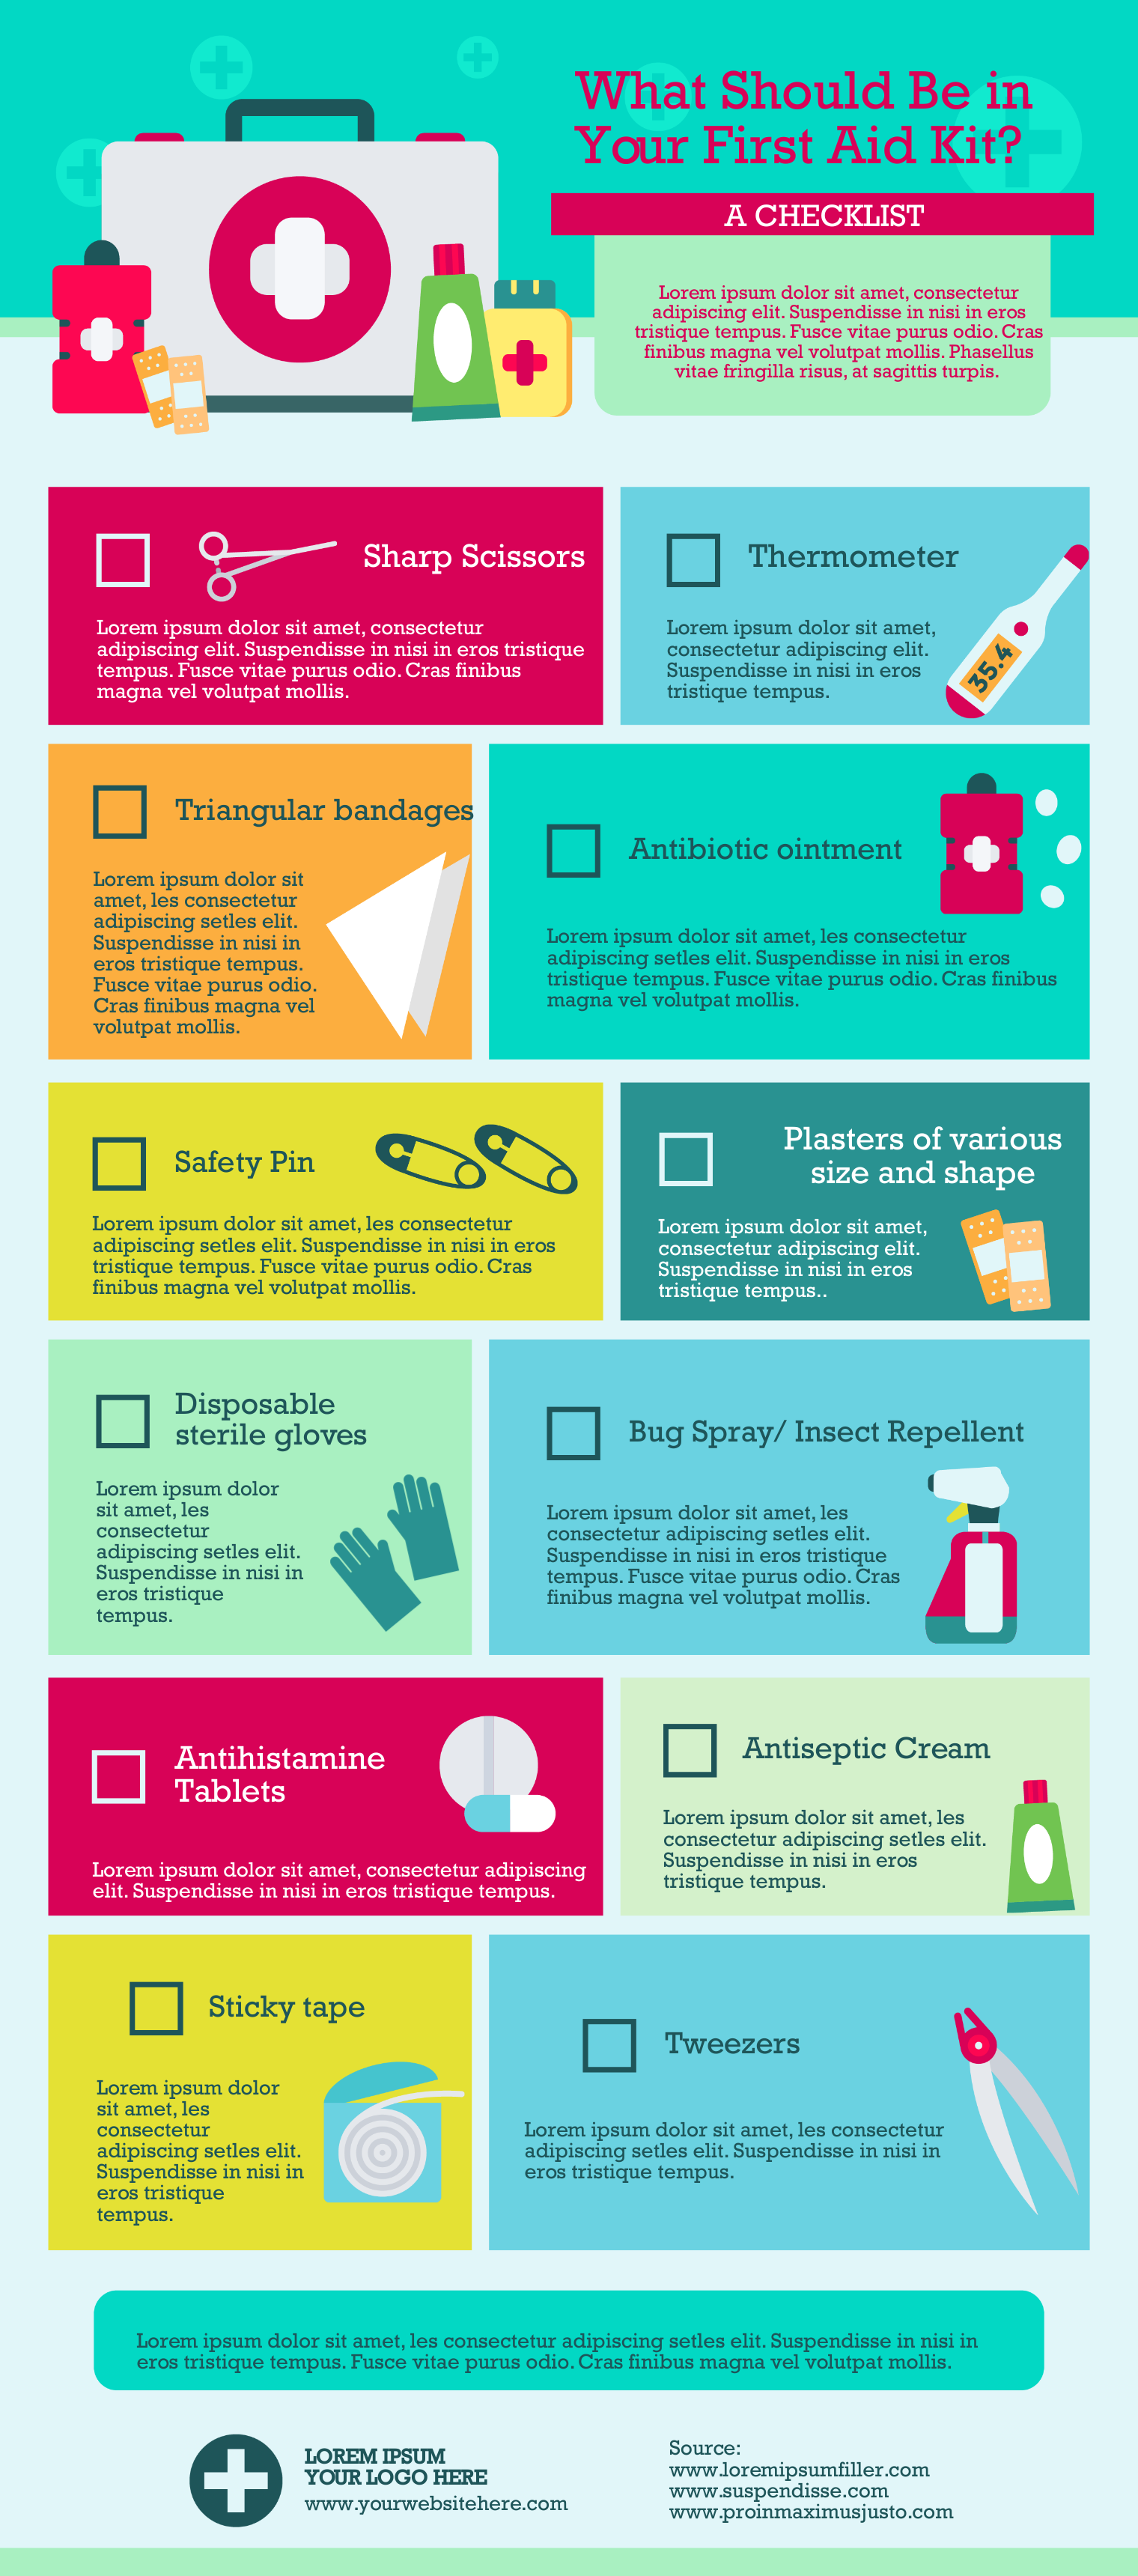
Encourage productive independence amongst students with a checklist infographic
Checklists are a powerful way for students to develop productive independence as they complete vital school activities.
They also help teachers and students alike in recalling processes and reminders inside the classroom (also works for remote learning!).
Use the school checklist infographic templates below the next time you’re sharing a list of things that students should always do before, during, and after class.
Recommended guide — How to Use Infographics for eLearning
Use infographics as handouts to supplement a class presentation
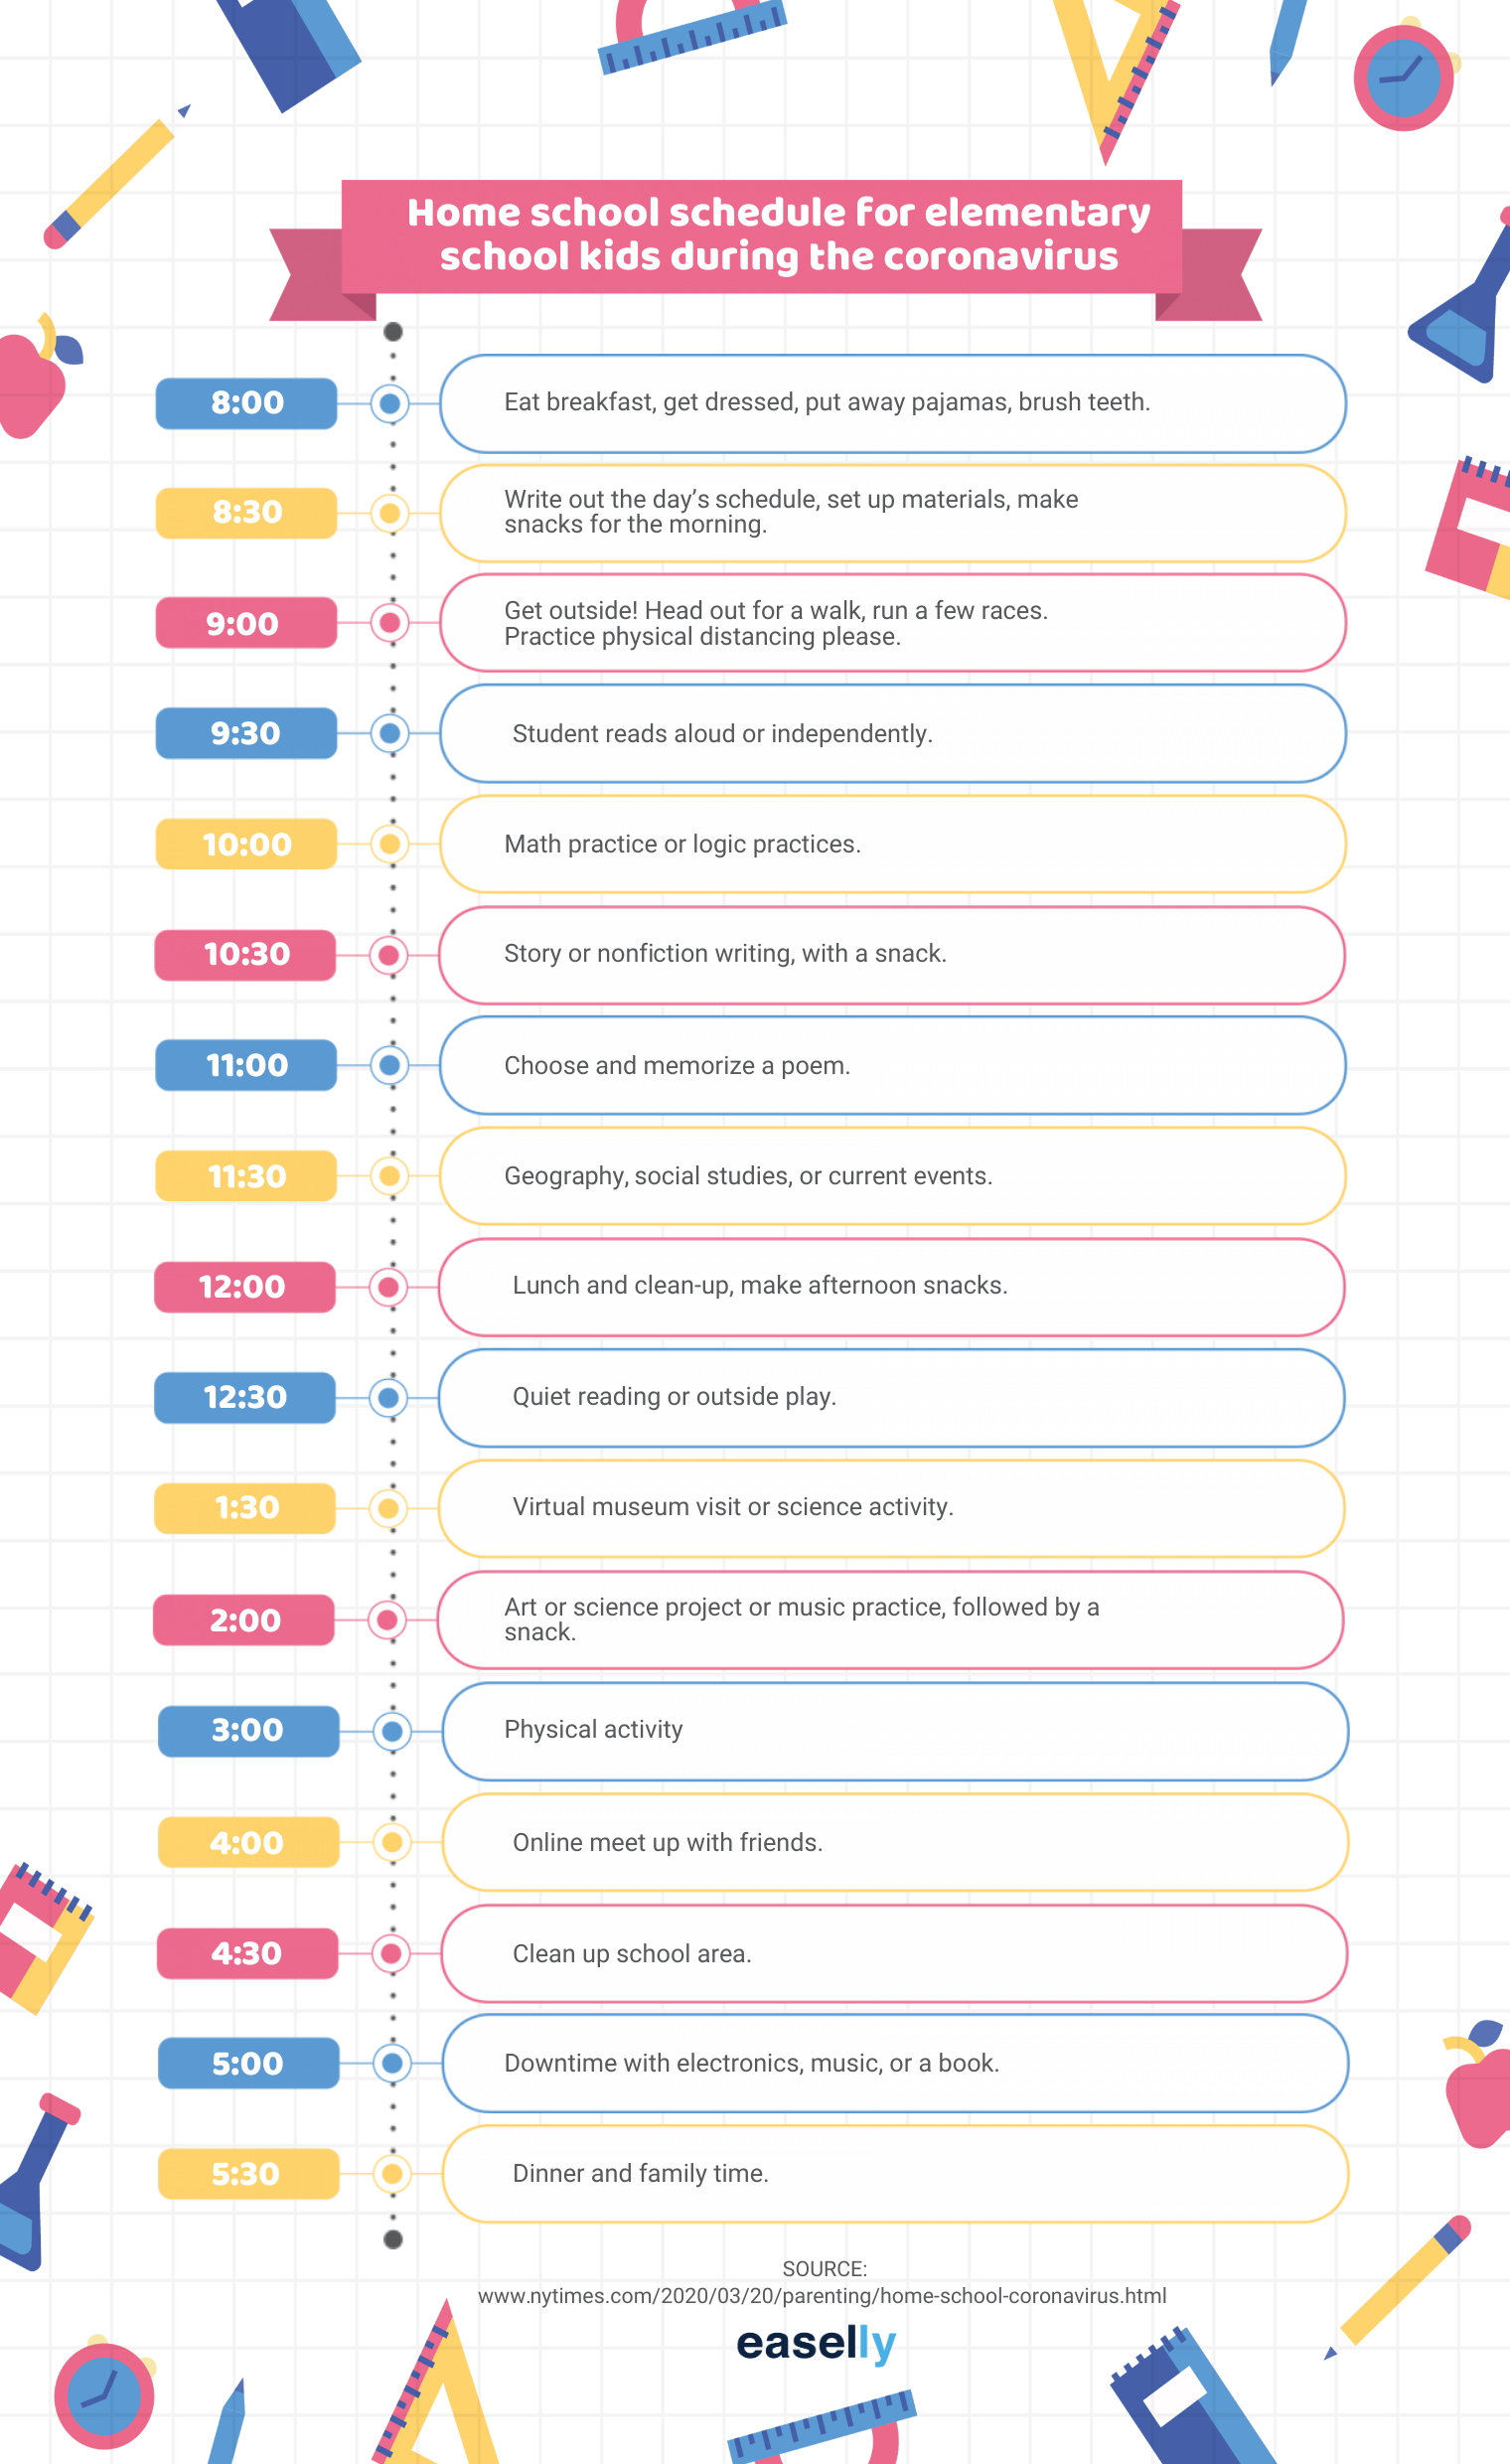
Make parent-teacher meetings more engaging with visual aids and infographics!
The infographic below is a good starting point in reminding parents how they can motivate their kids to learn even at home.
Ask students to present their homework in class using infographics
Making infographics as homework or a class activity helps students improve their research chops and find trustworthy sources of information.
Afterward, encourage students to use visuals like infographics when presenting statistics, facts, and figures.
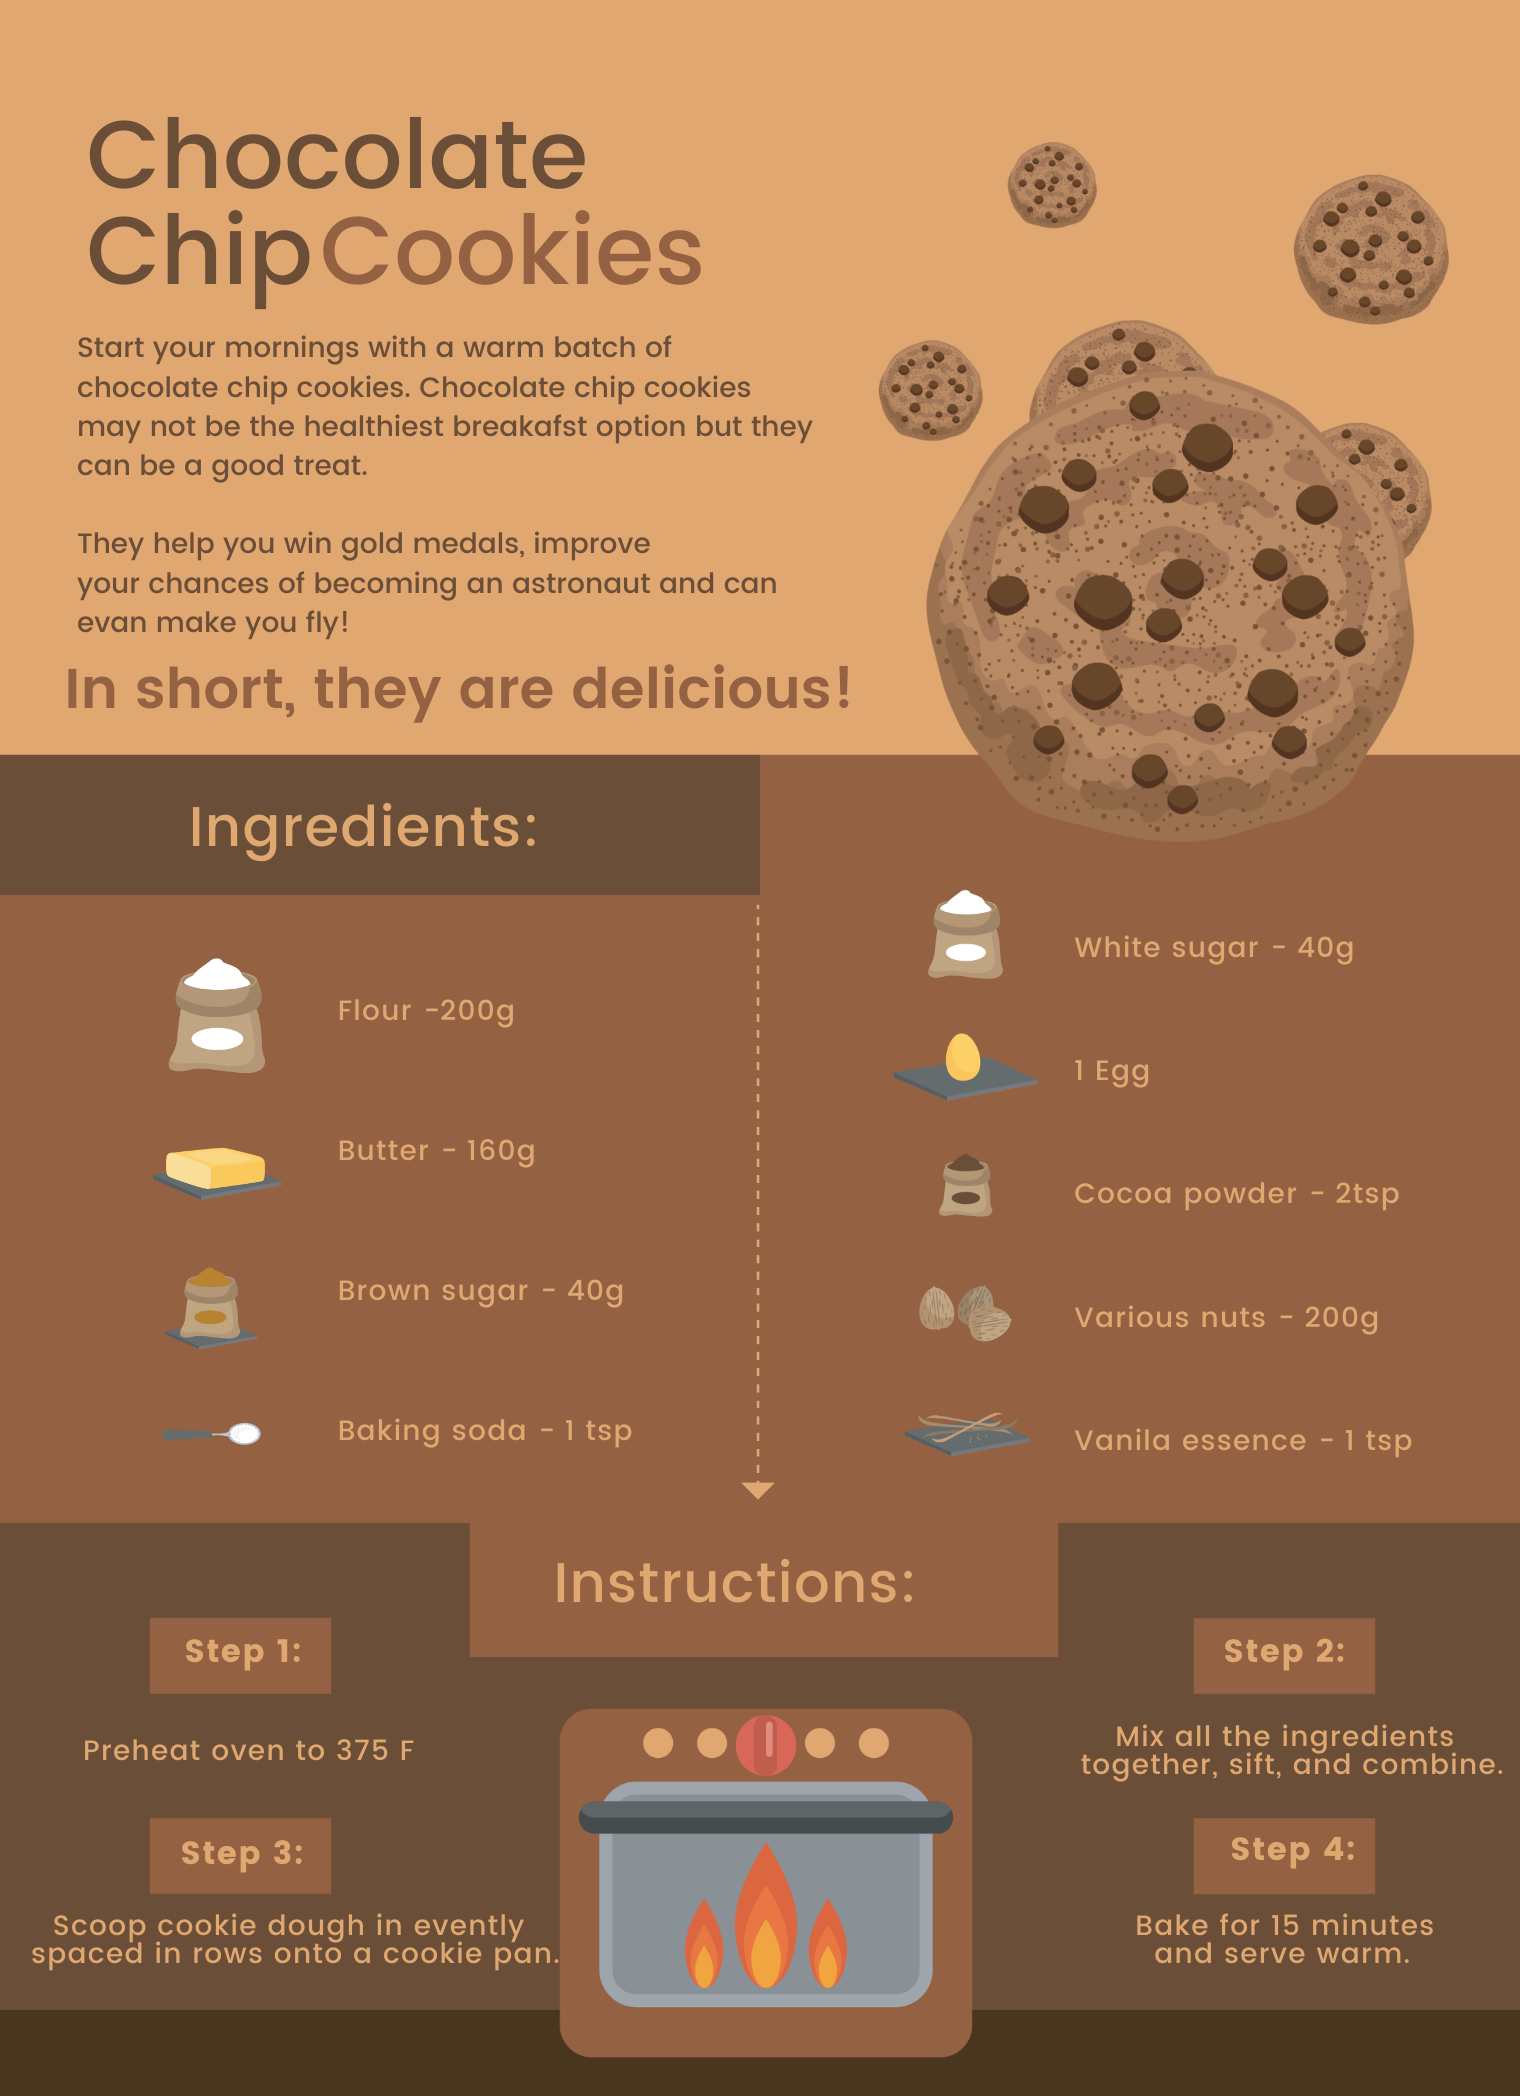
Teach math and language at the same time with a recipe presentation
Following a recipe and asking students to present it in class can help improve multiple skills.
First, the students get to learn new vocabulary while reading a recipe. Second, they learn mathematics through the different types of measurements that the recipe calls for. Finally, it also enables students to work in groups and put their collaboration skills in practice!
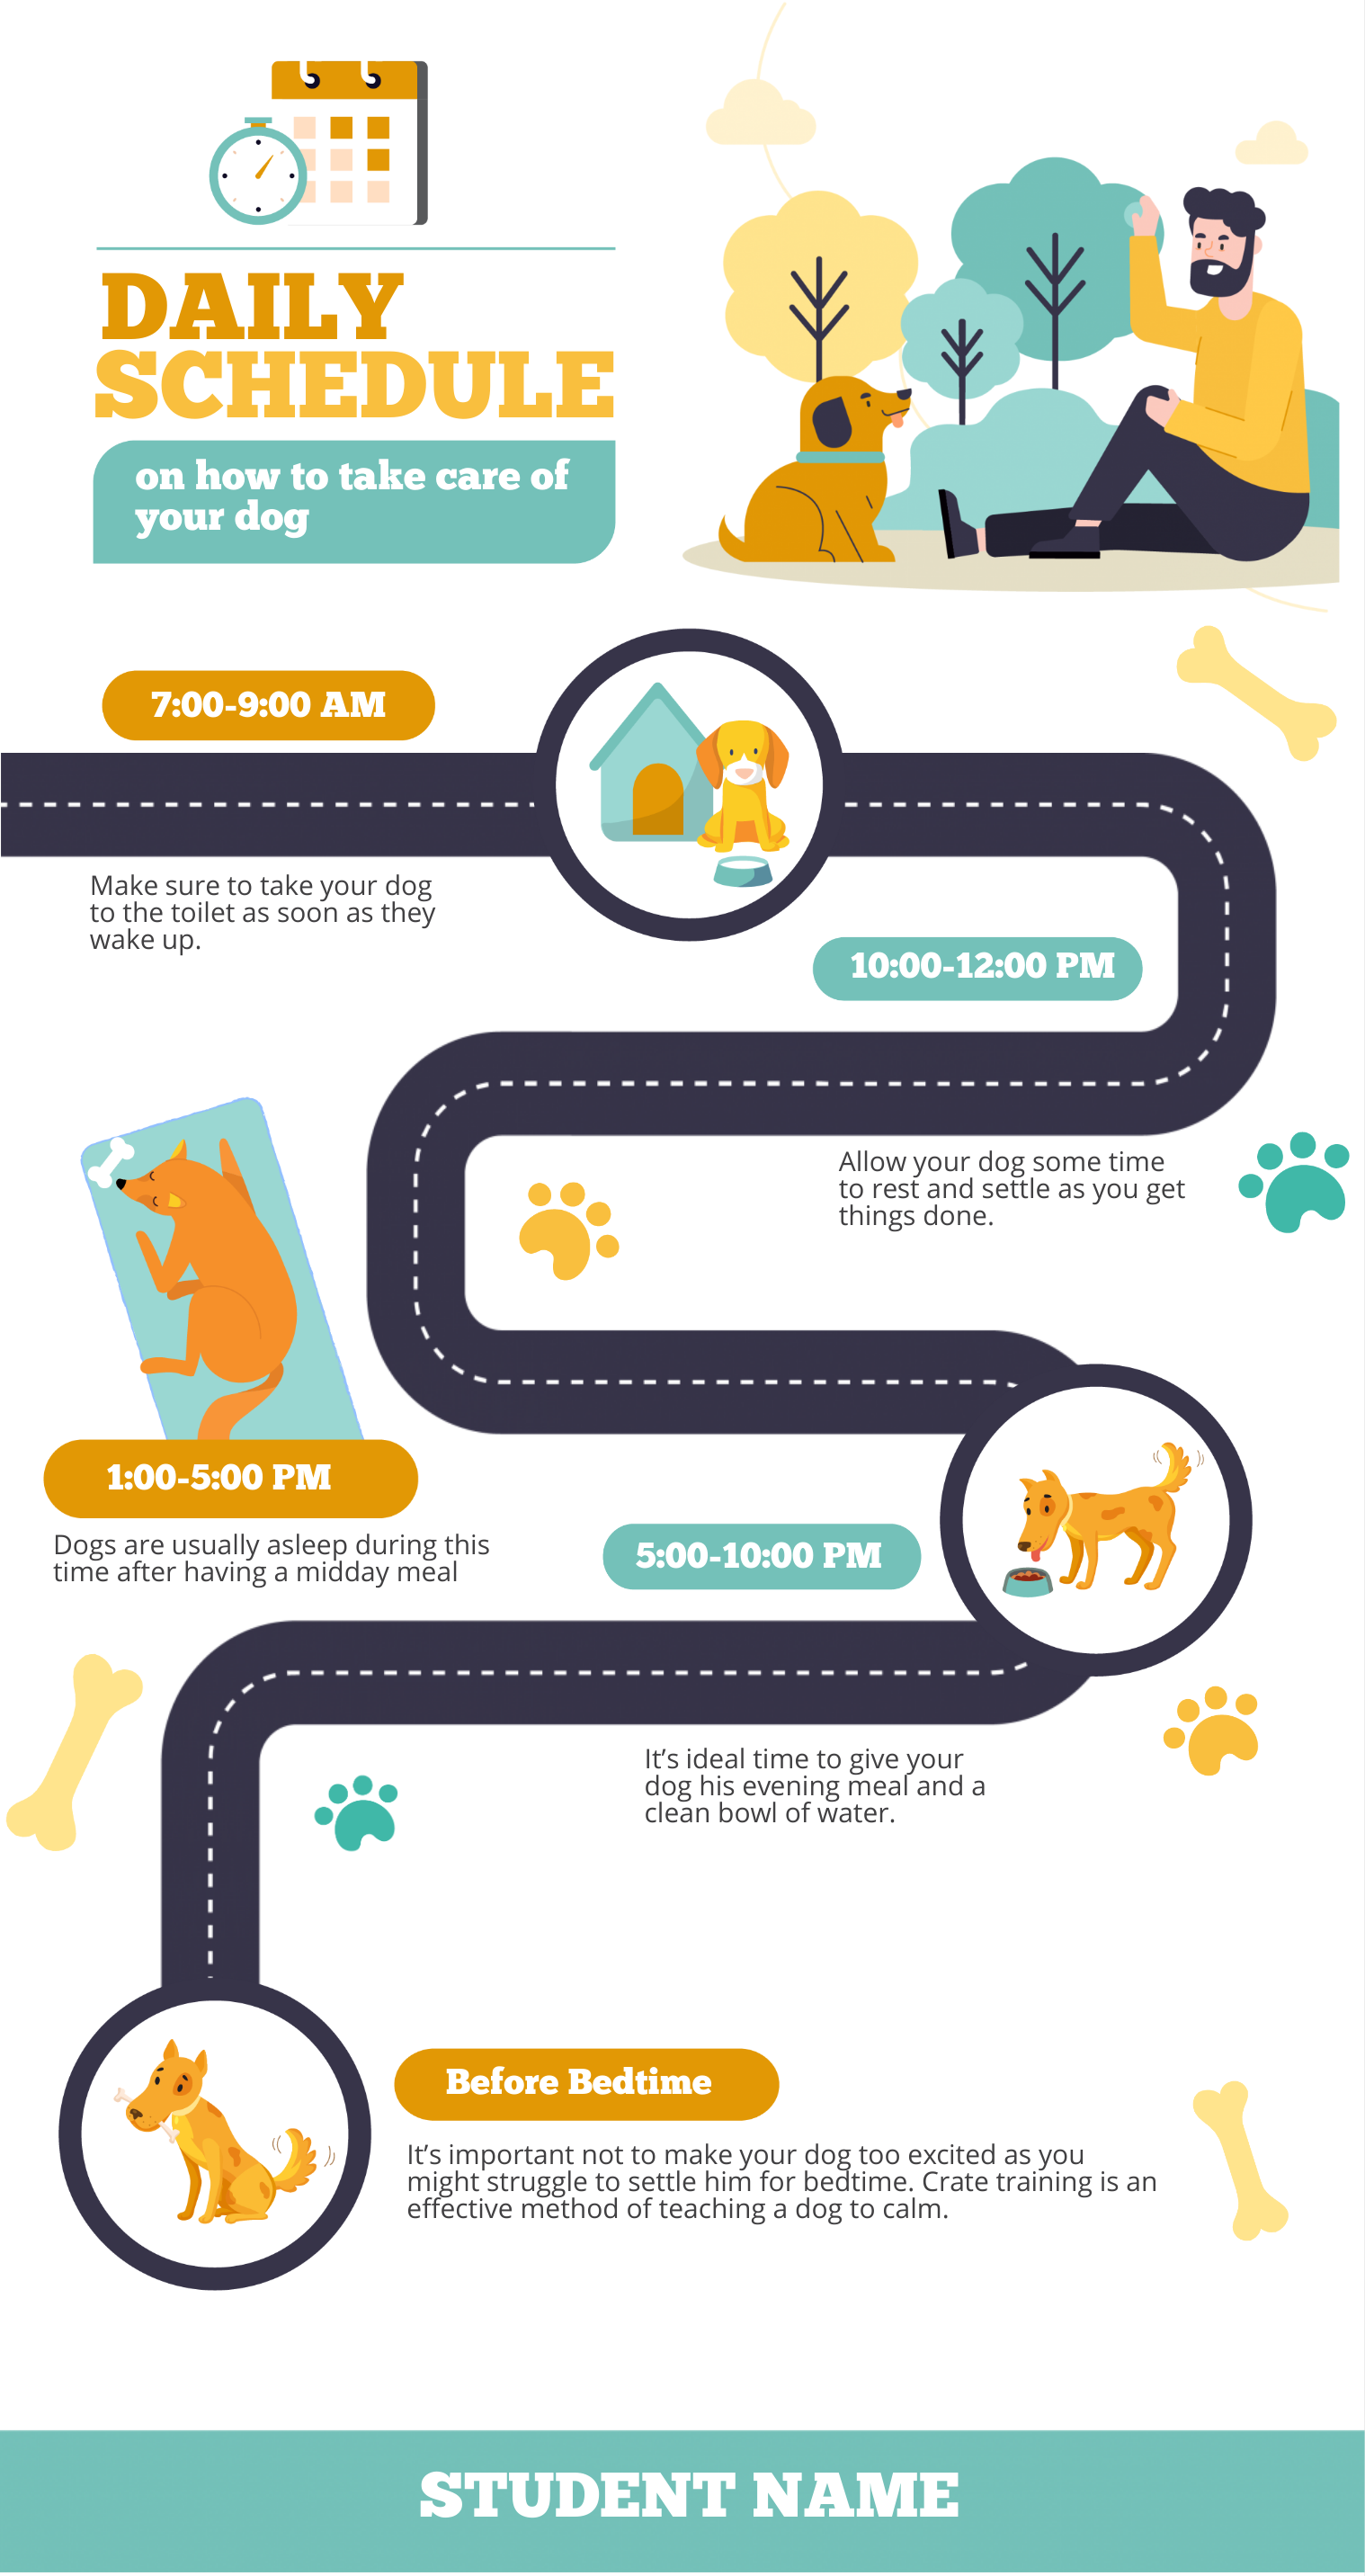
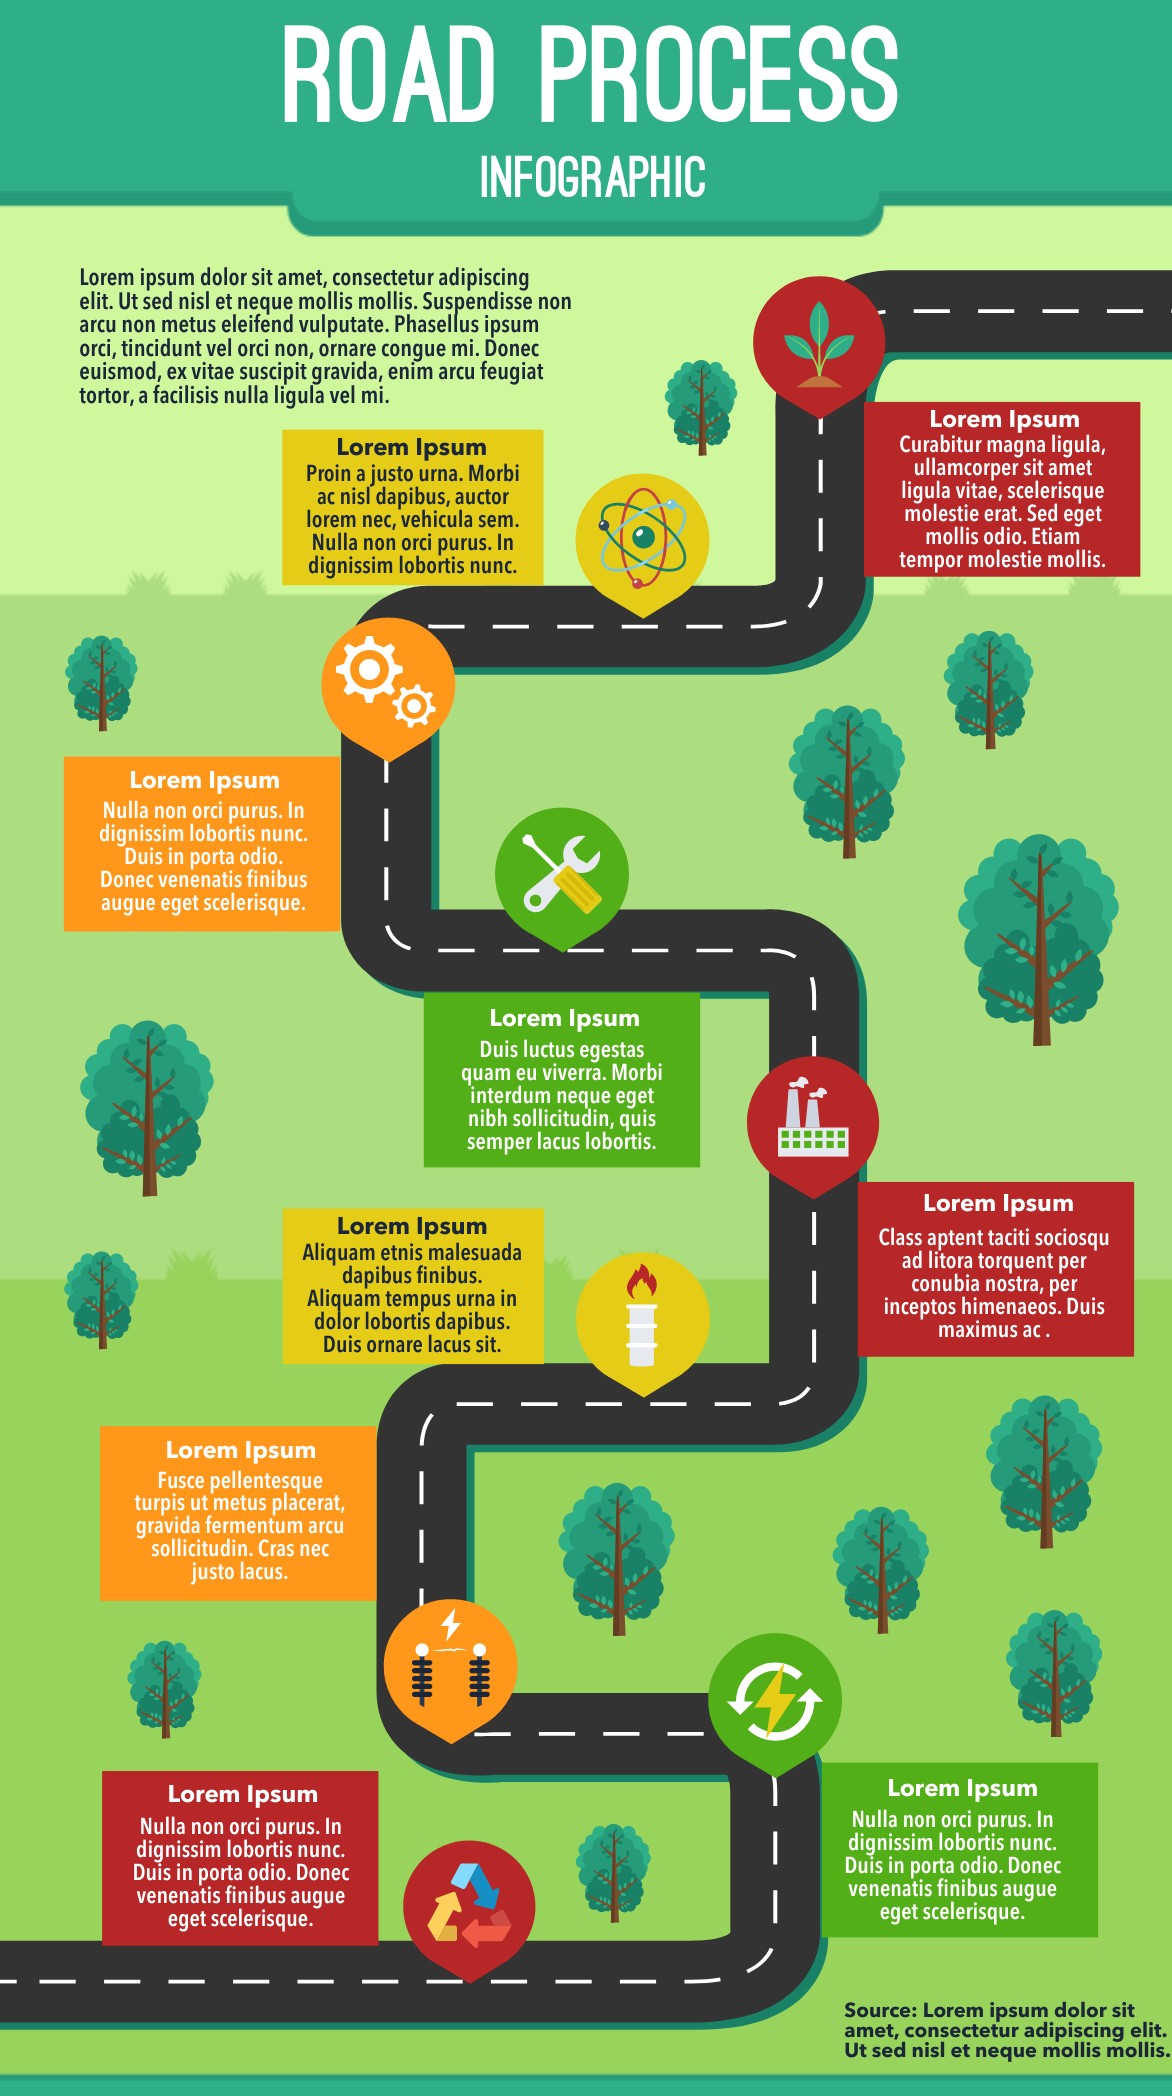
Have students use infographics to share a timeline
Timeline infographics during classroom presentations is ideal in showing how one thing leads to another, explaining how something has changed over time, and teaching the concept of time. This infographic format also enables students to understand complex processes.
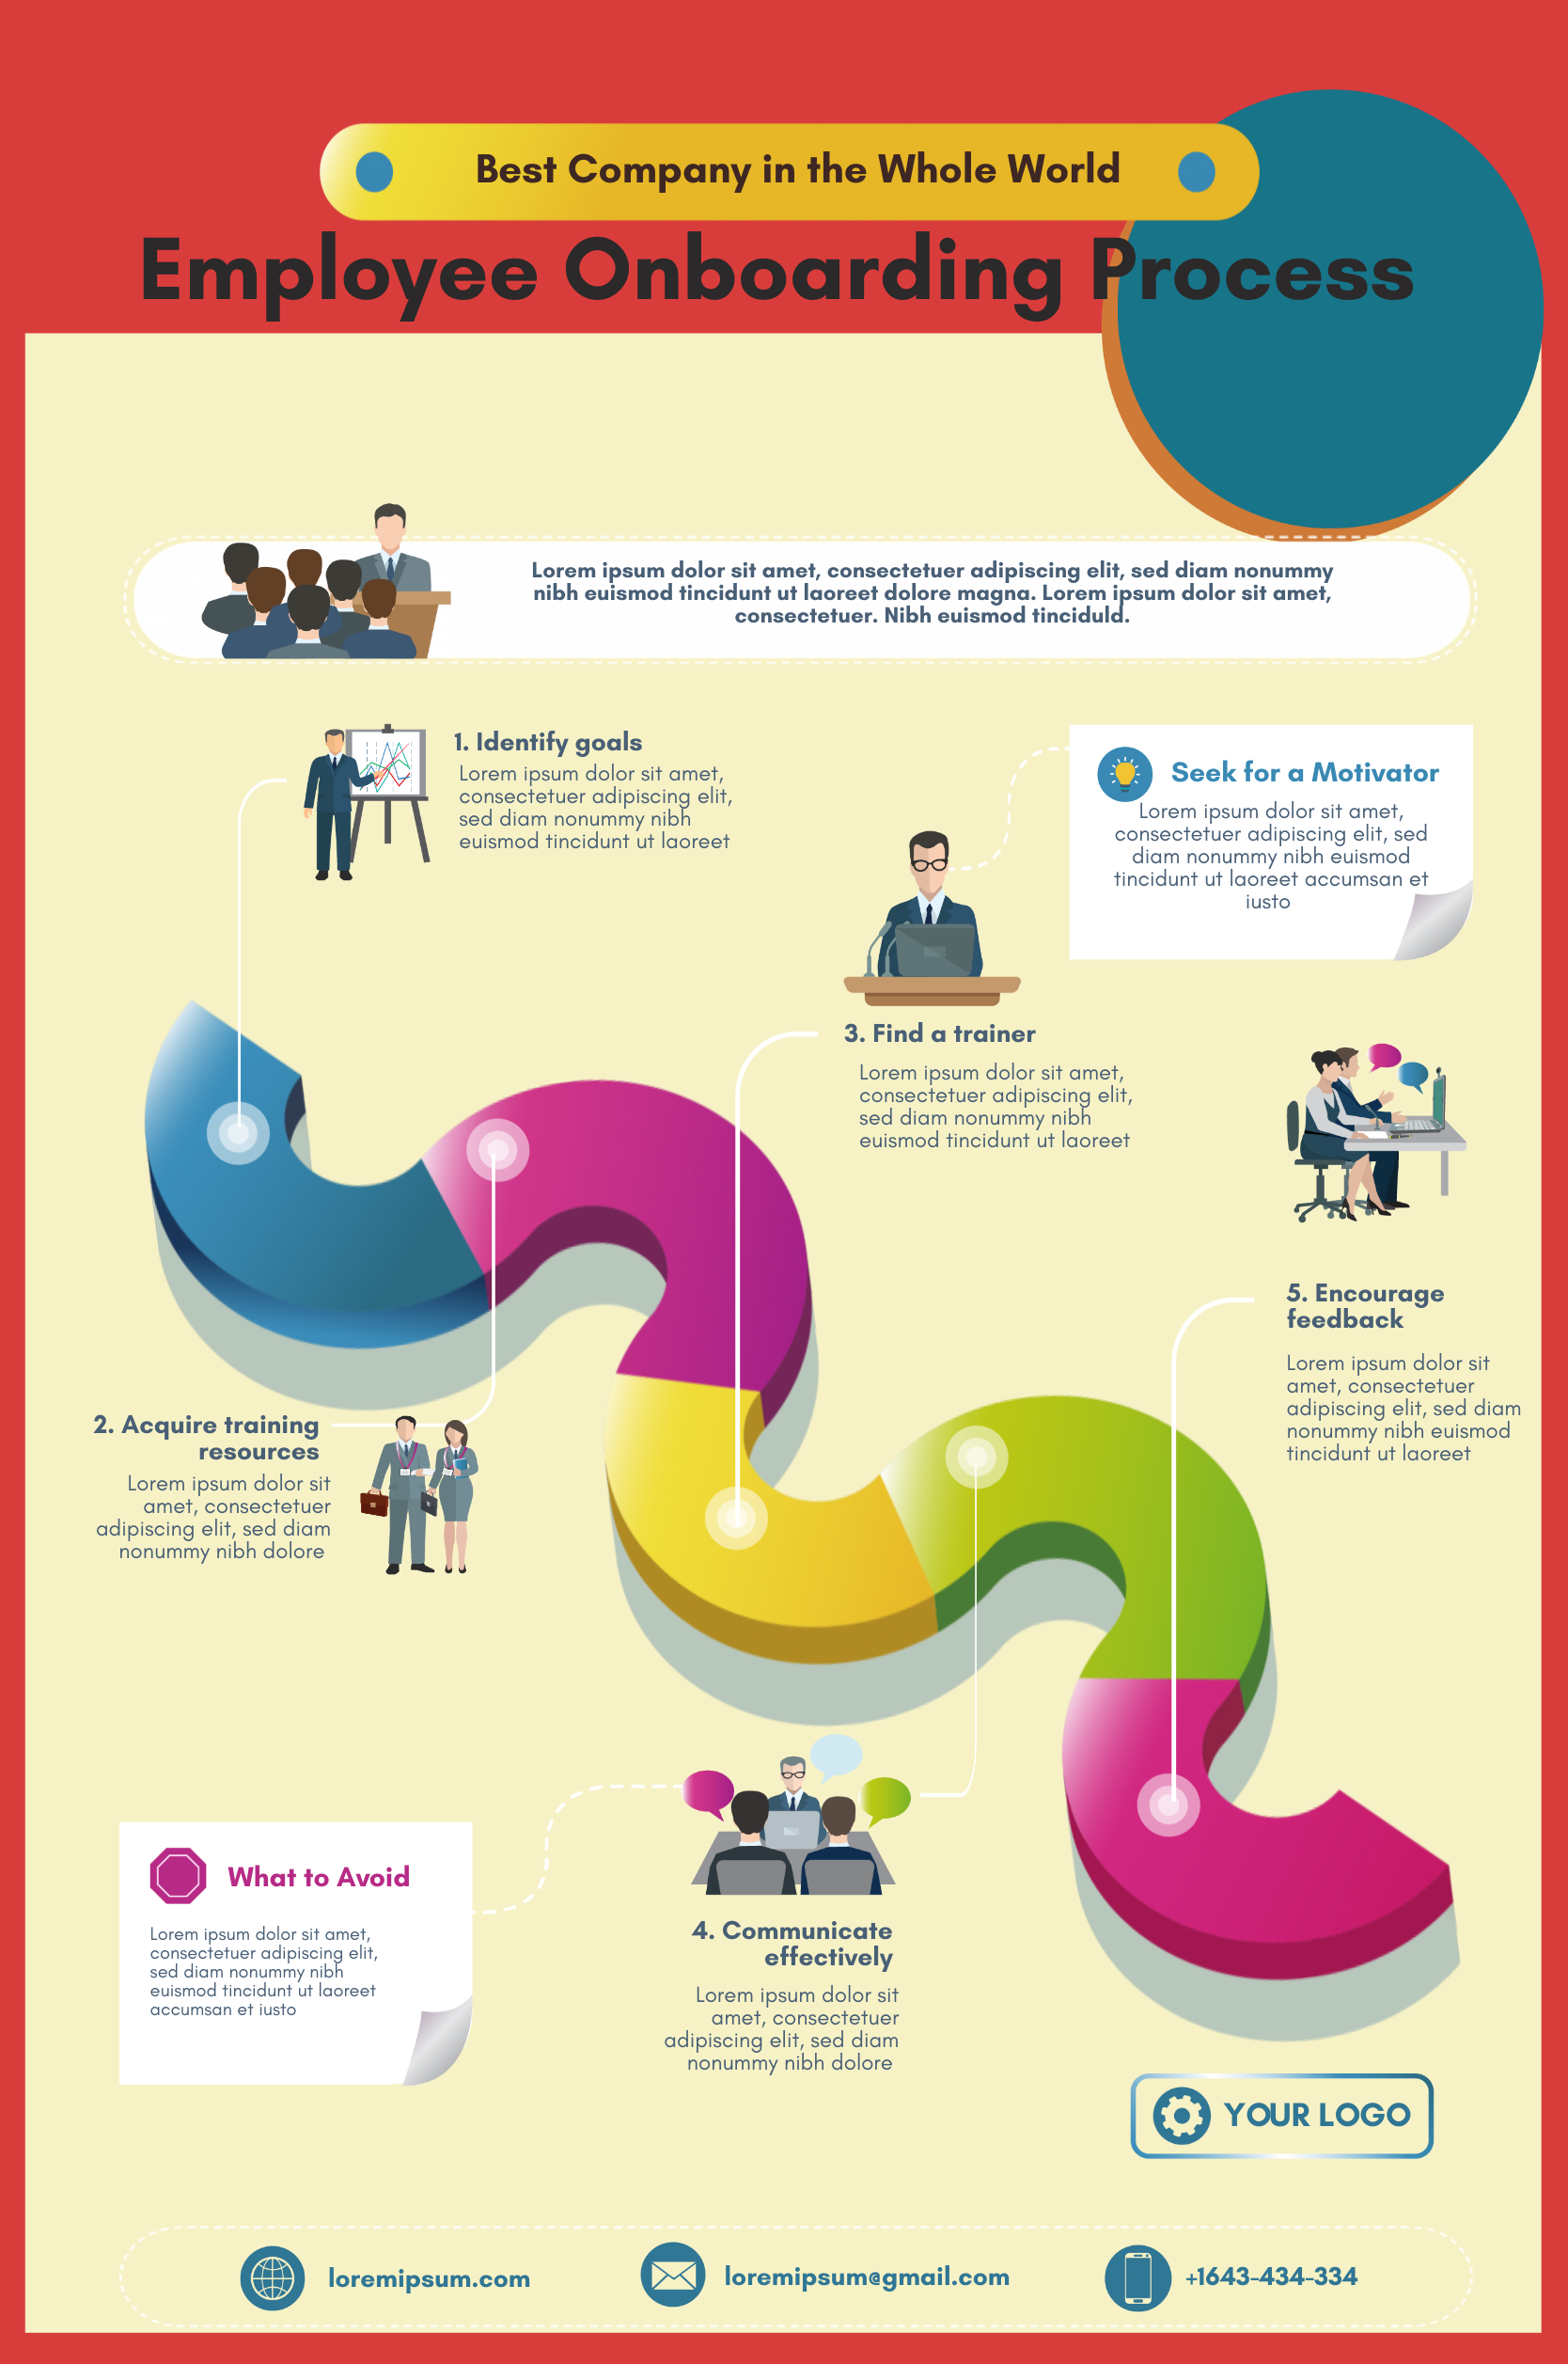
Reduce complexity in your lessons with process infographics
Do you want to break down a complex process into digestible pieces of information in one of your lectures?
Use visual aids like the pyramid infographic template below.
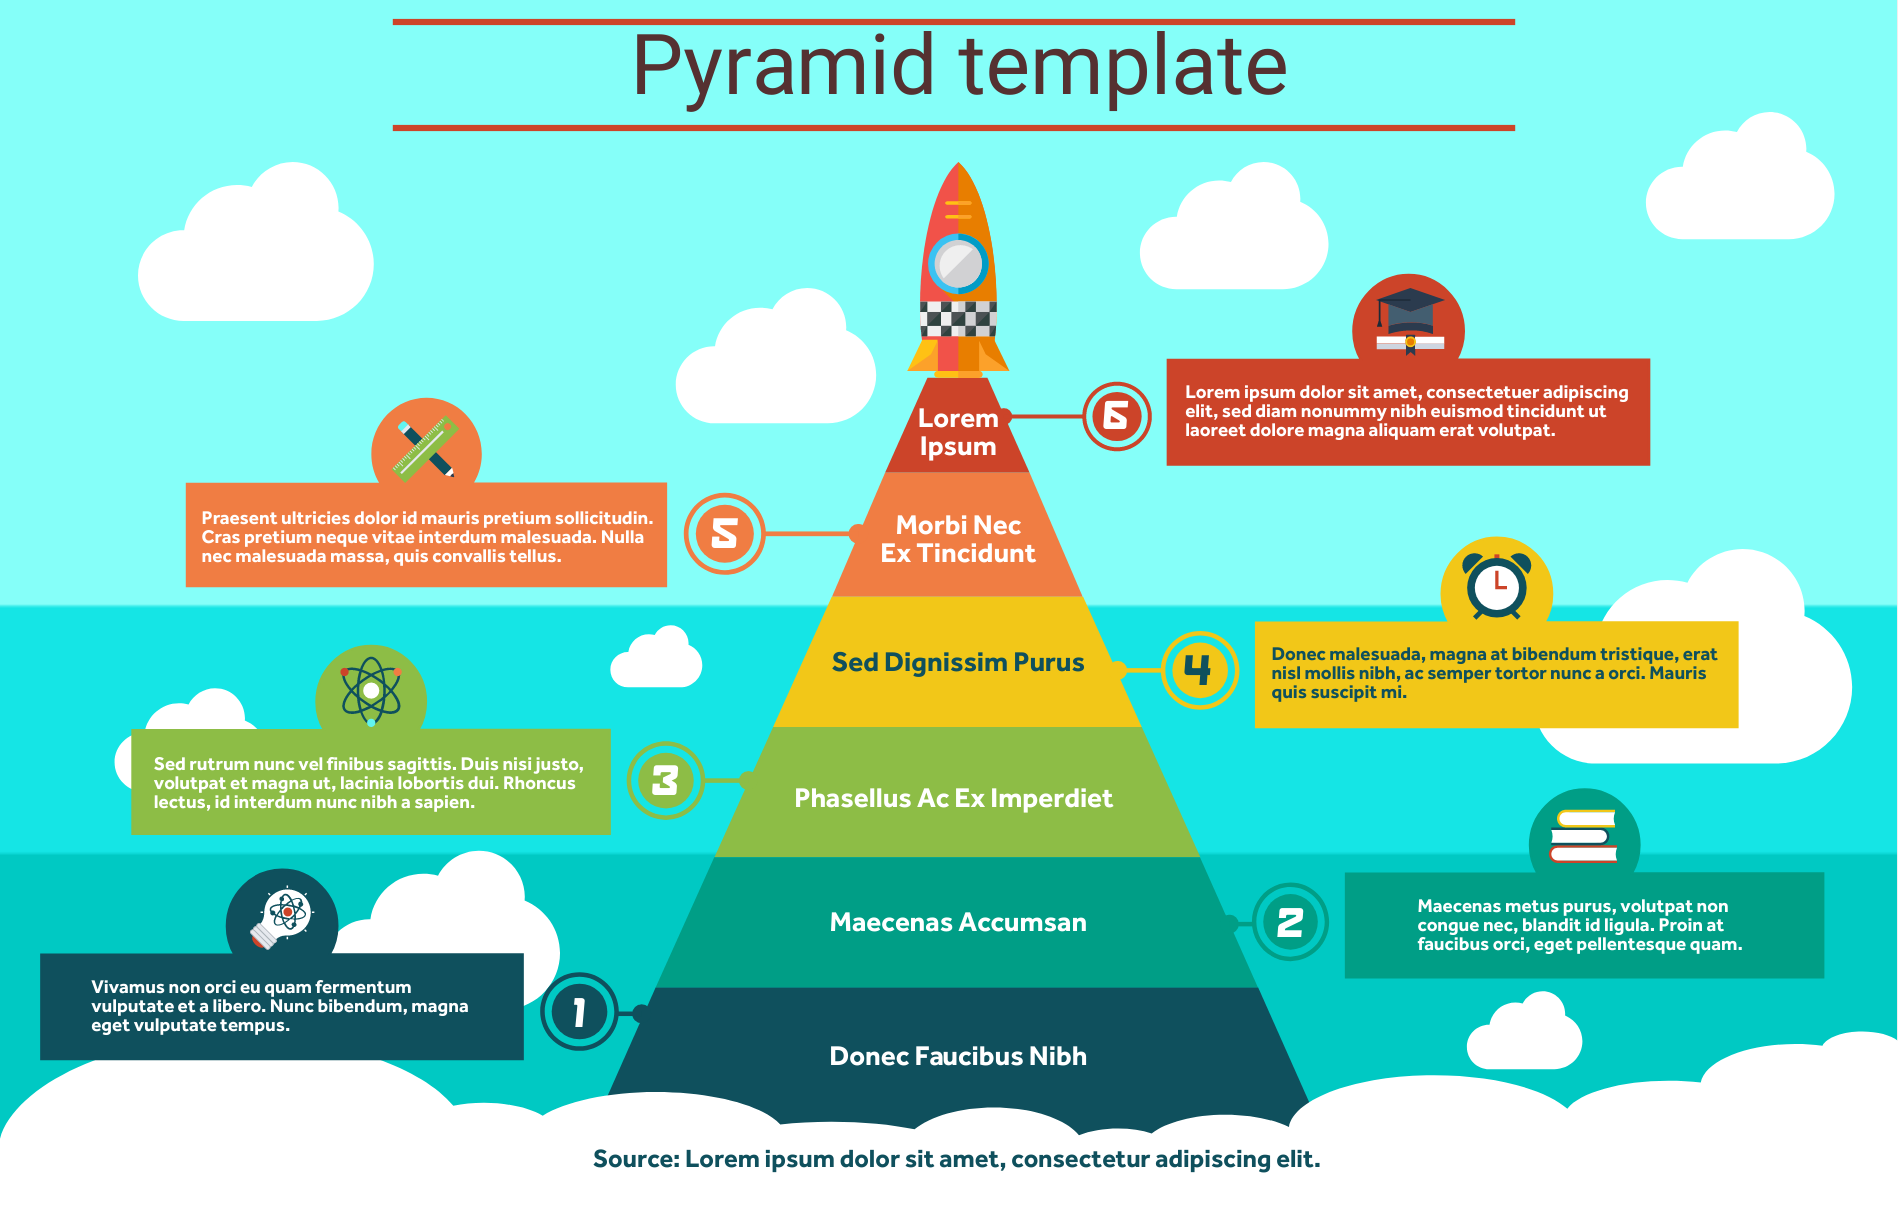
Assign a color for each phase or step in the process. Picking the right color scheme on your infographic will help make your visual aid easier to follow.
You can also use icons and illustrations to visualize each step in the process.
On the other hand, you can use arrows or lines to direct readers to the next step. These visual cues will guide your readers’ eyes and avoid information overload.
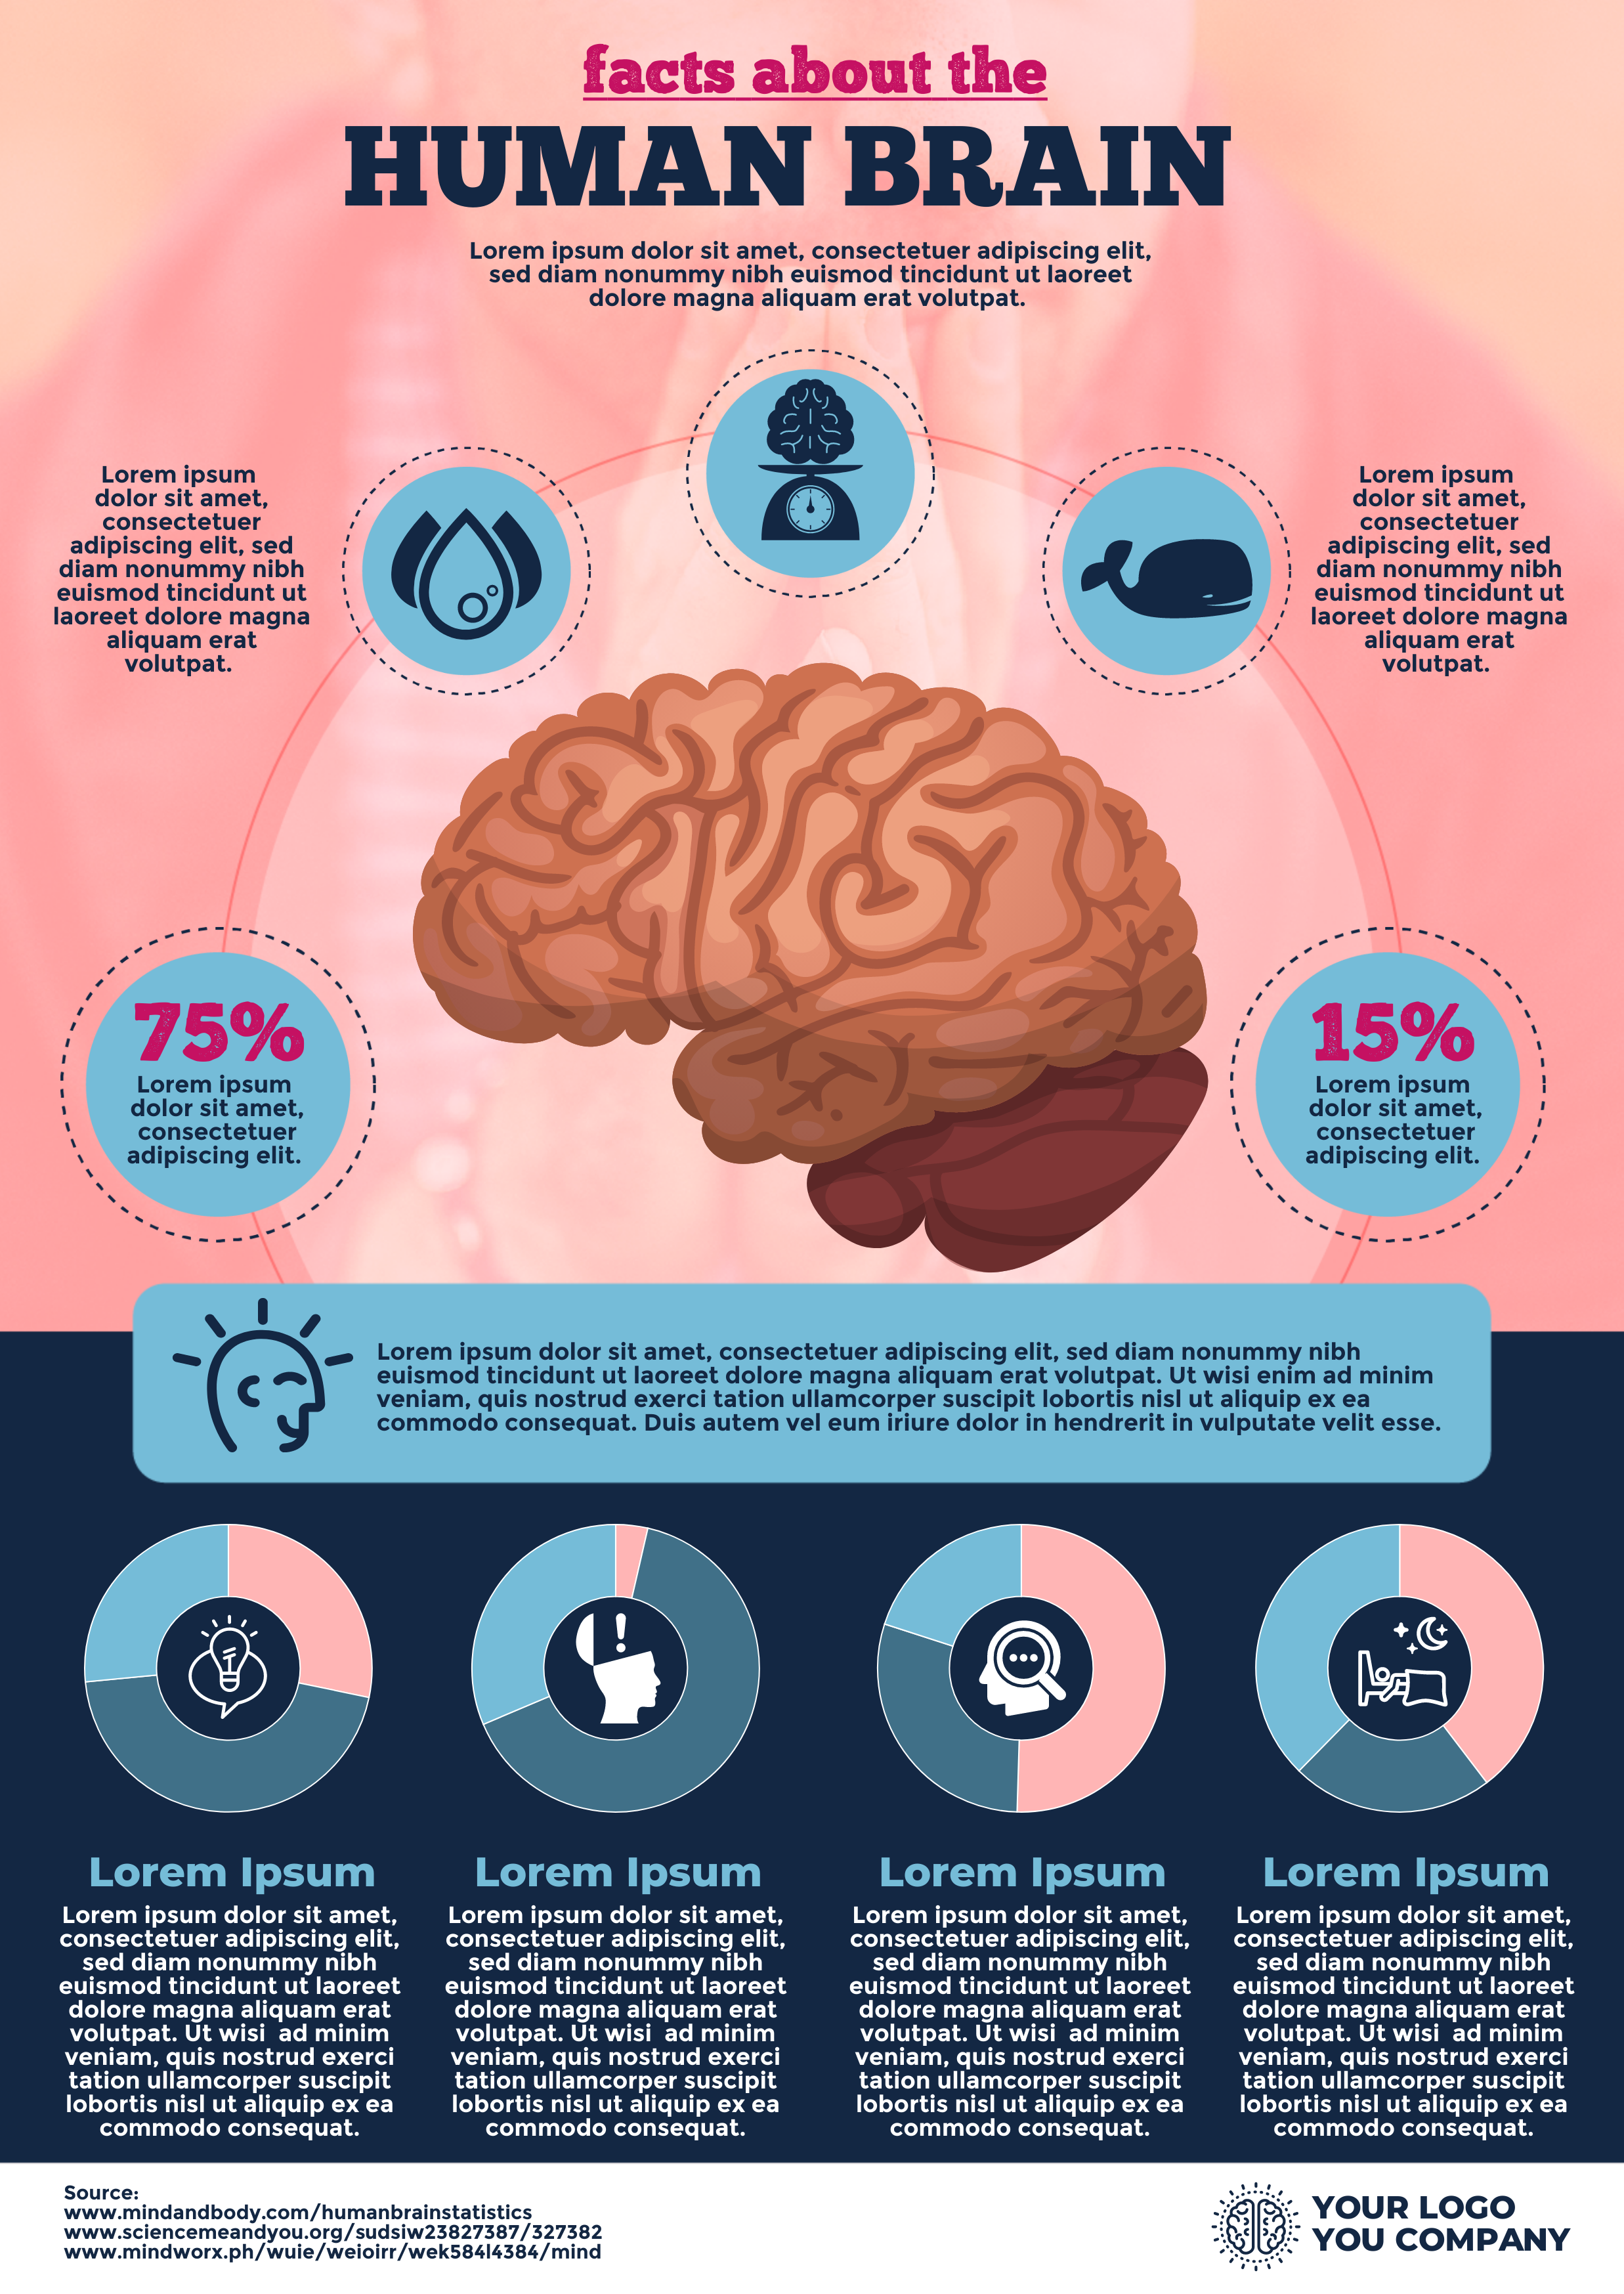
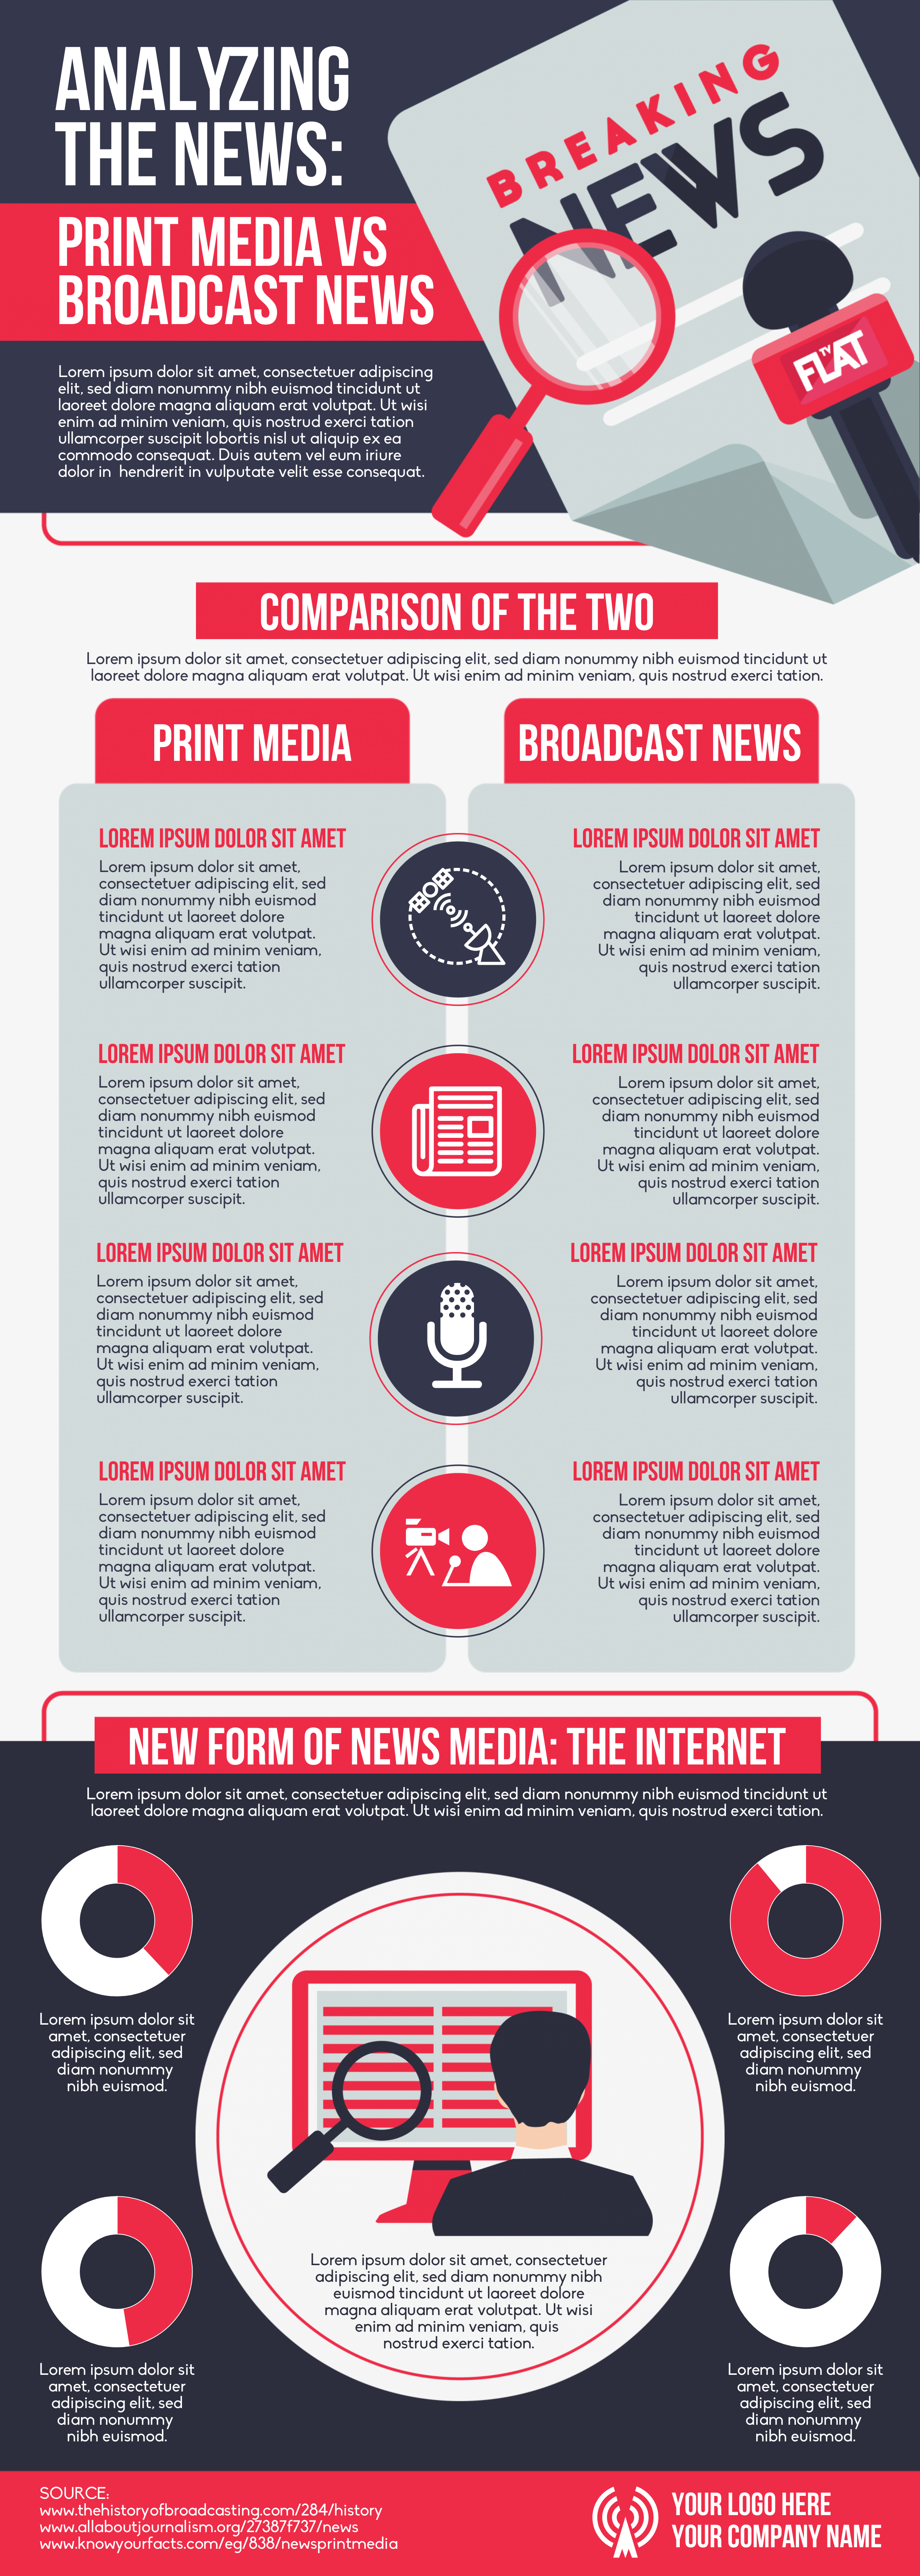
Sharpen your students’ analytical skills with an infographic
Most students fall short on analysis —the process of gathering a set of facts and interpreting what they mean, and coming up with a persuasive conclusion based on their interpretation.
Besides asking students to write an essay on a topic, using visuals like an infographic can sharpen their analytical skills.
For example, your class can analyze a piece about different media types and news outlets. Encourage them to use an infographic when sharing their analysis of a trend or topic.
Bonus video tutorial: Presentation tips for students
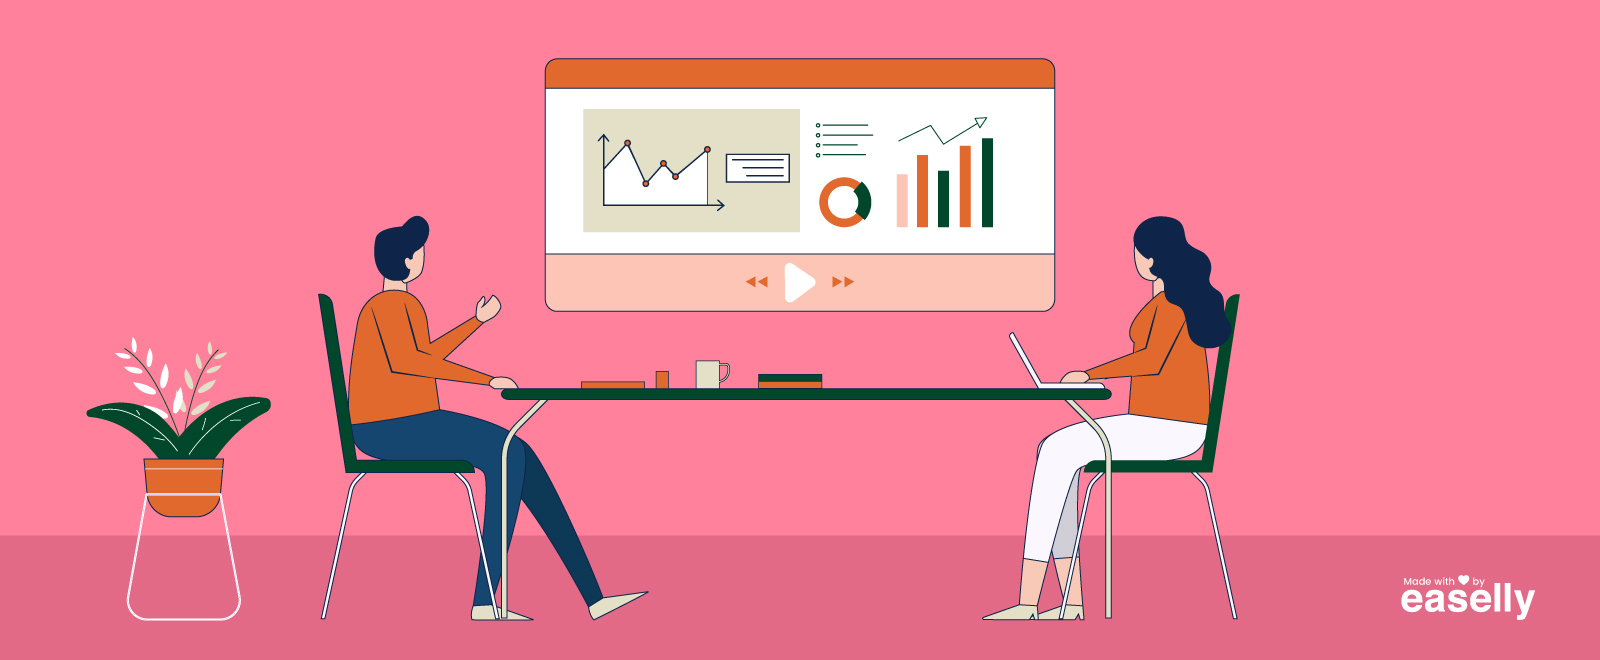
Infographics as visual aids for business presentation
Just like airport signages that visually inform and guide thousands of passengers each day, visual aids are used in business to hook your audience and retain their attention throughout your presentation.
Whether it’s for a product demo or a report about your company’s plans for sustainability, here are some examples of infographics (and infographic templates you can use!) that you can use for visual aids during business presentations.
Motivate your audience to learn faster by simplifying long-winded explanations with a flowchart infographic
Instead of presenting explanations and processes in plain text, flowchart infographics are your best bet to look more professional and organized. Plus, they’re easier to remember for your audience!
The templates below are a good starting point if you’re planning to create flowcharts for your next presentation.

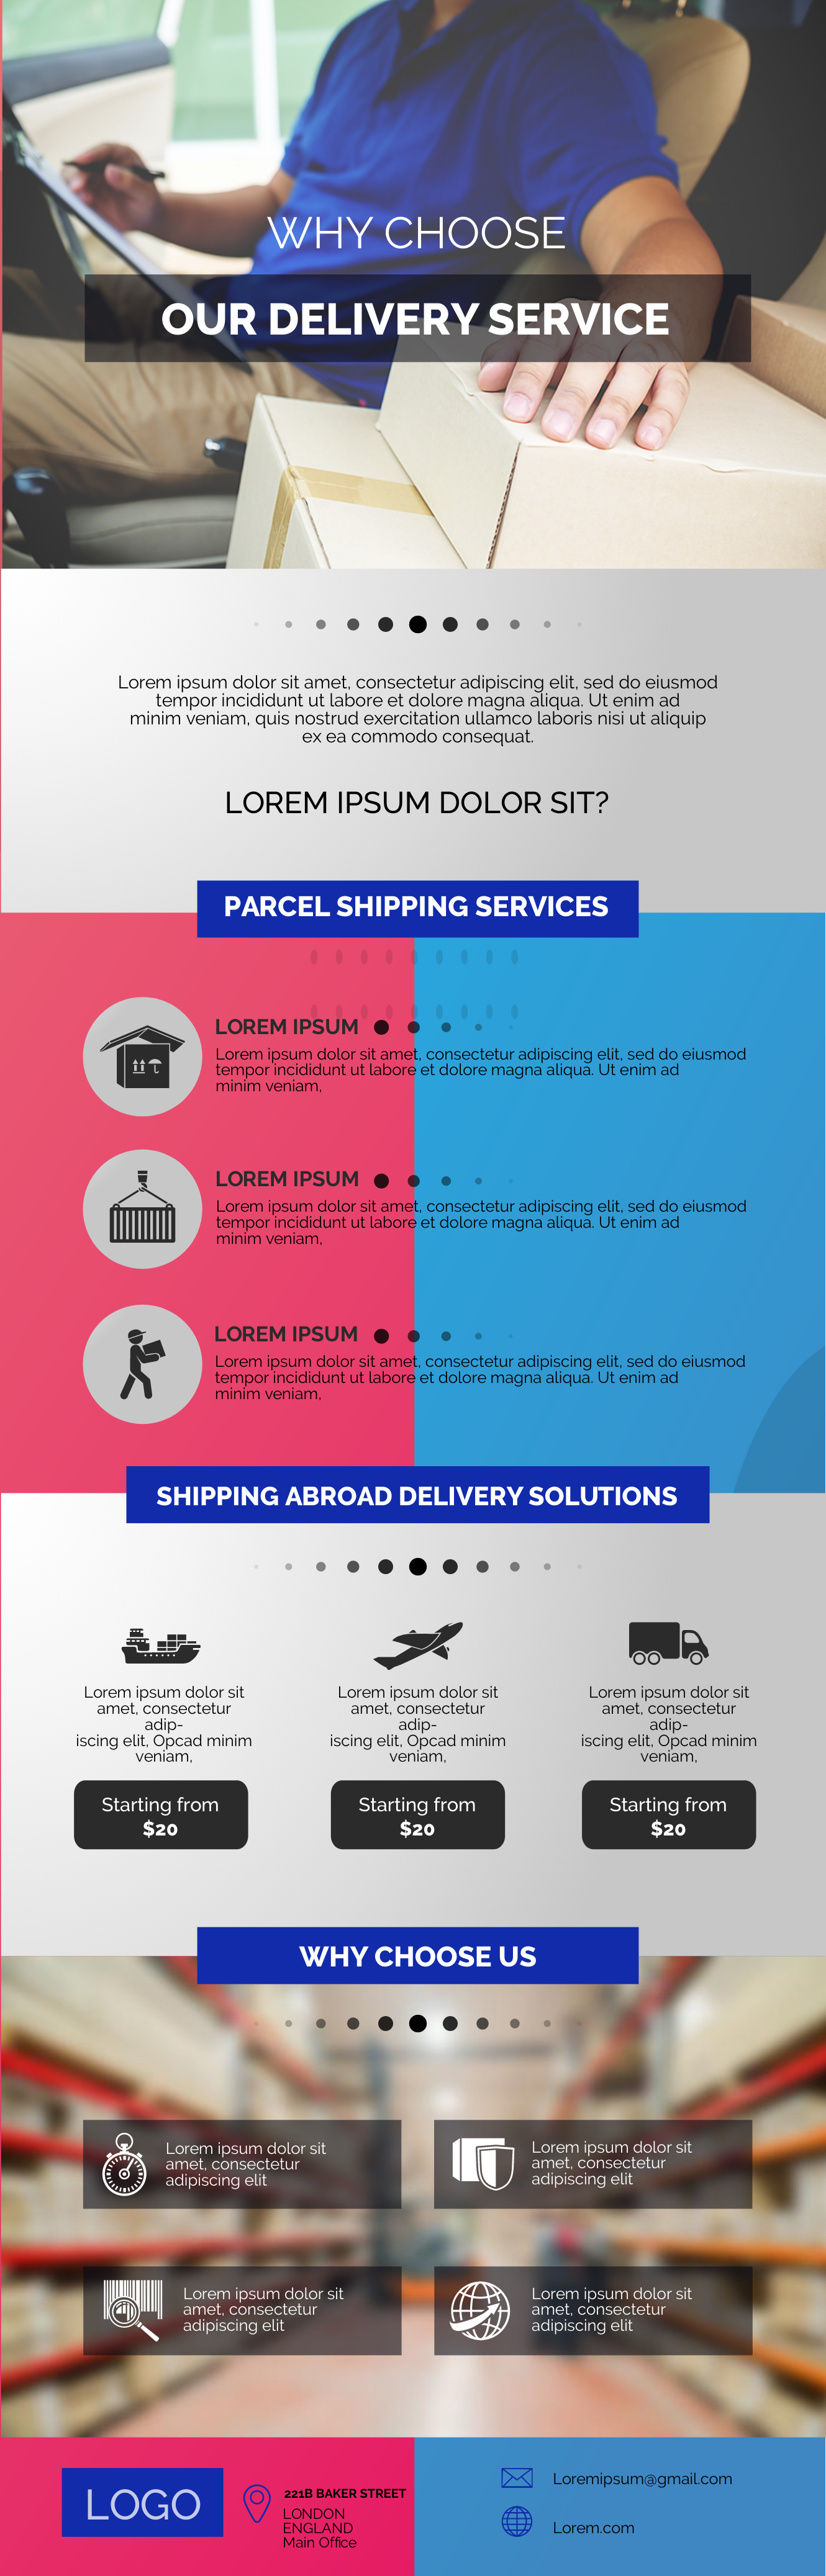
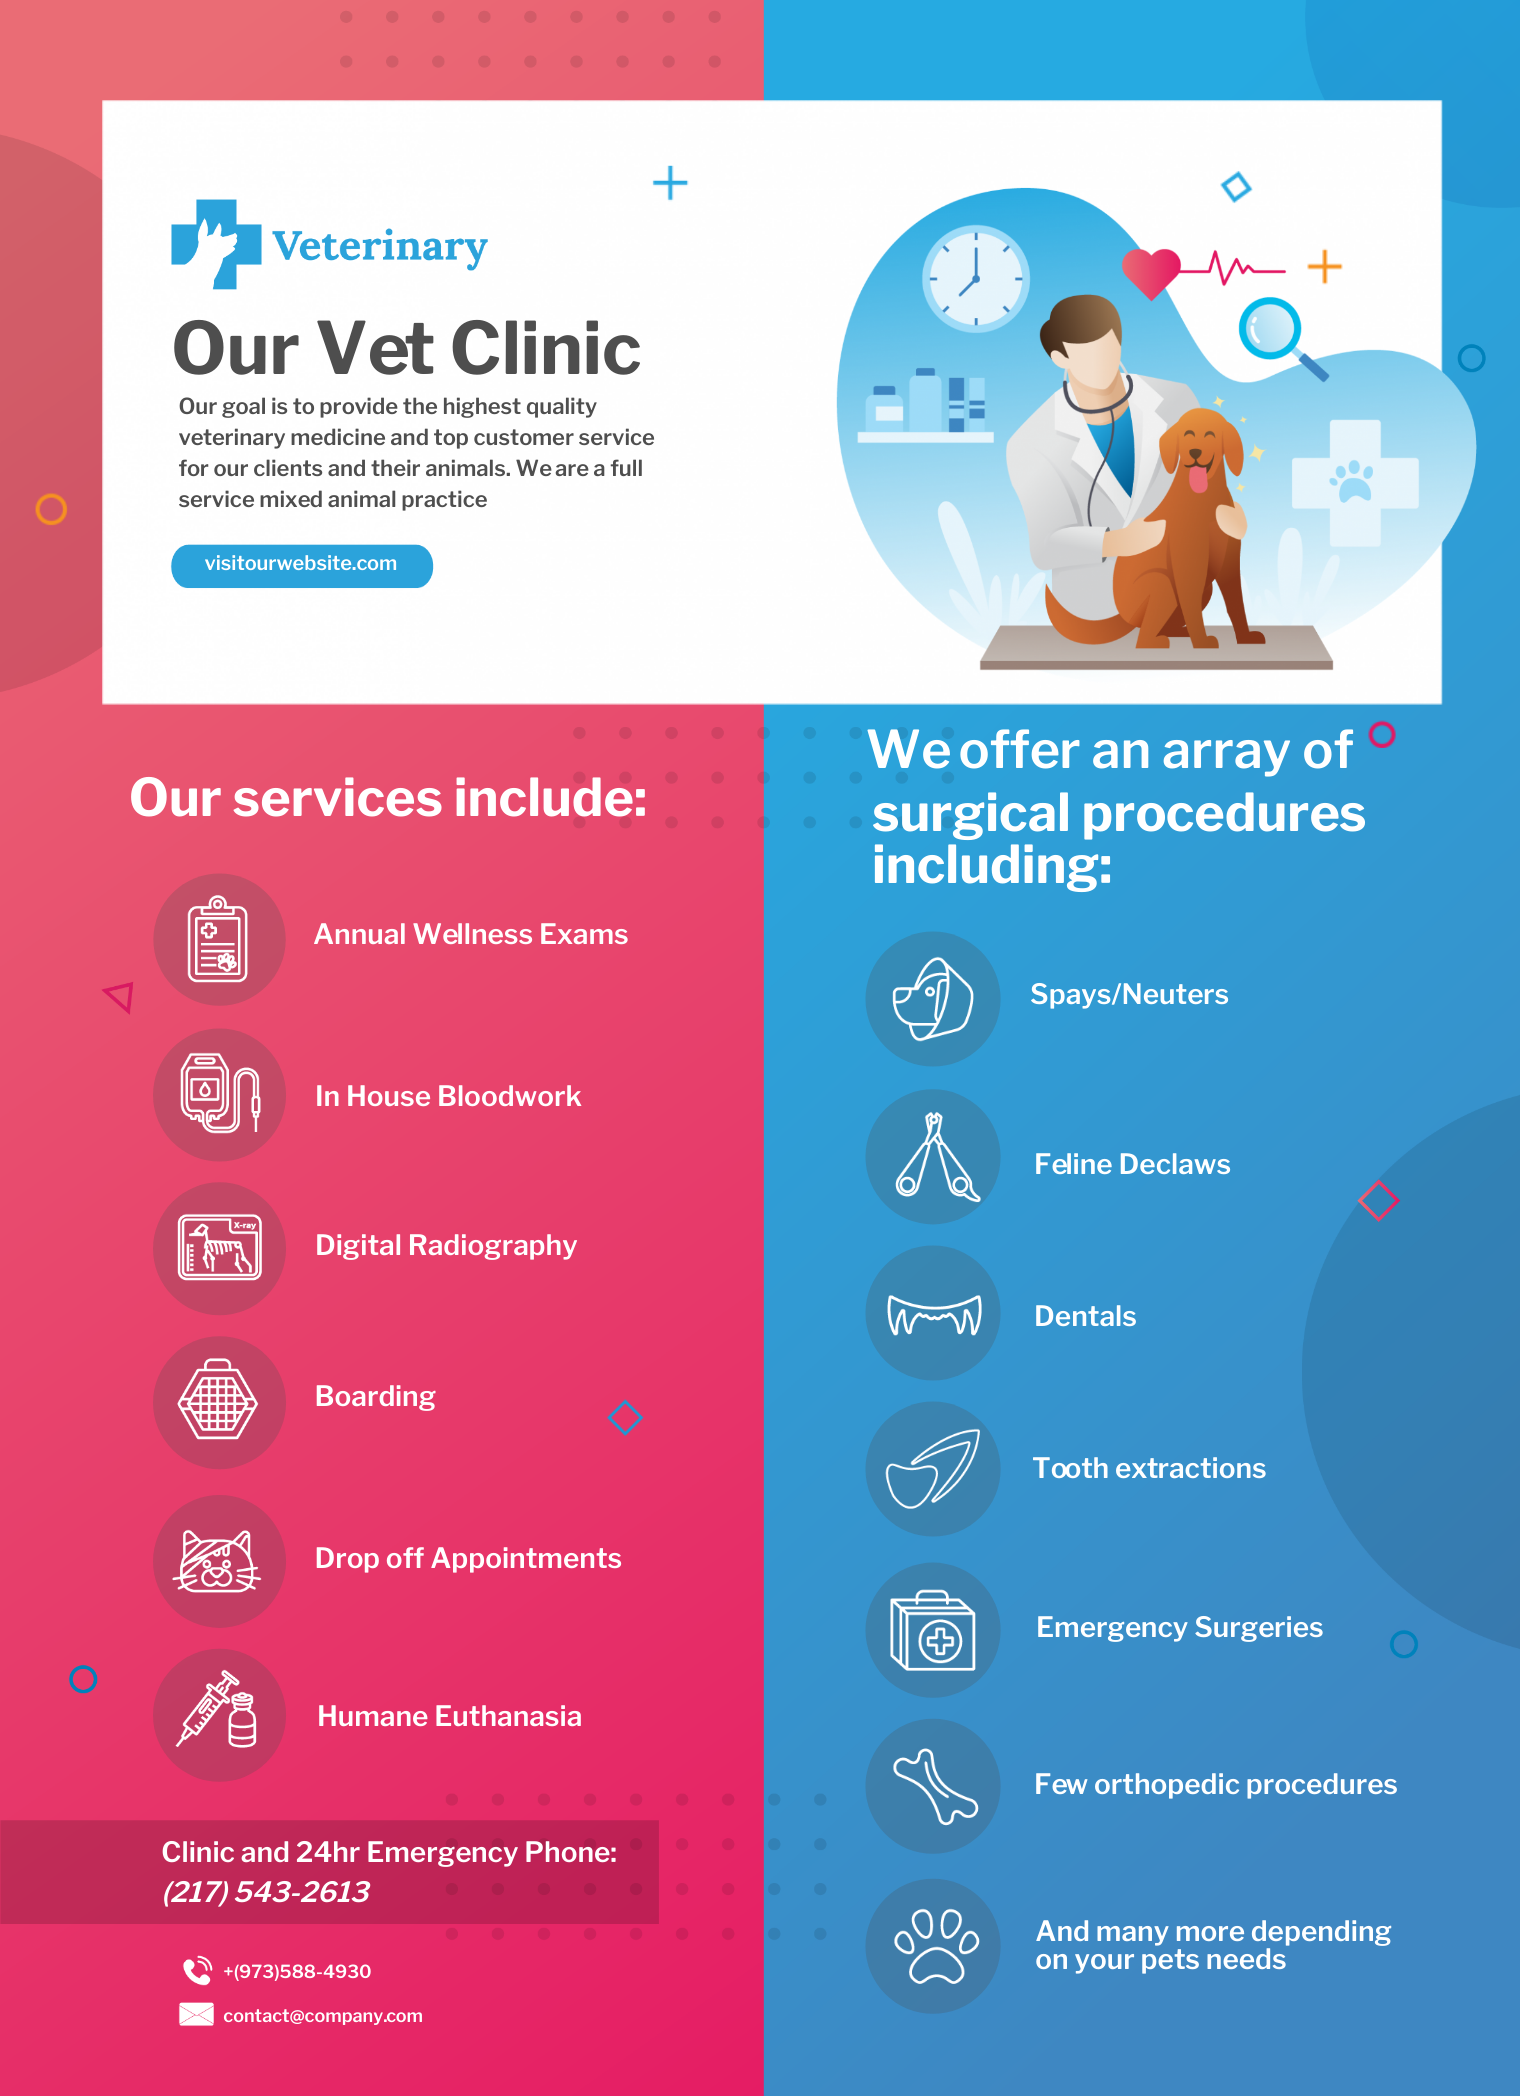
Highlight your company’s different products and services through visuals
While written or oral communication remains a powerful medium in communicating your products and services’ value, adding visuals to the mix enables customers to retain your information longer.
Informative visuals like the templates below are also easier to share, whether online (embed it on your website) or offline (print it out as a handout).
Use instructional infographics during employee trainings
Infographics to train and educate employees can be tweaked to be funnier or attention-grabbing to make the information even more memorable.
When presenting instructions or information for employees through infographics, you can also make it more viewable or accessible when they have questions.
Here are a couple of templates to get you started.
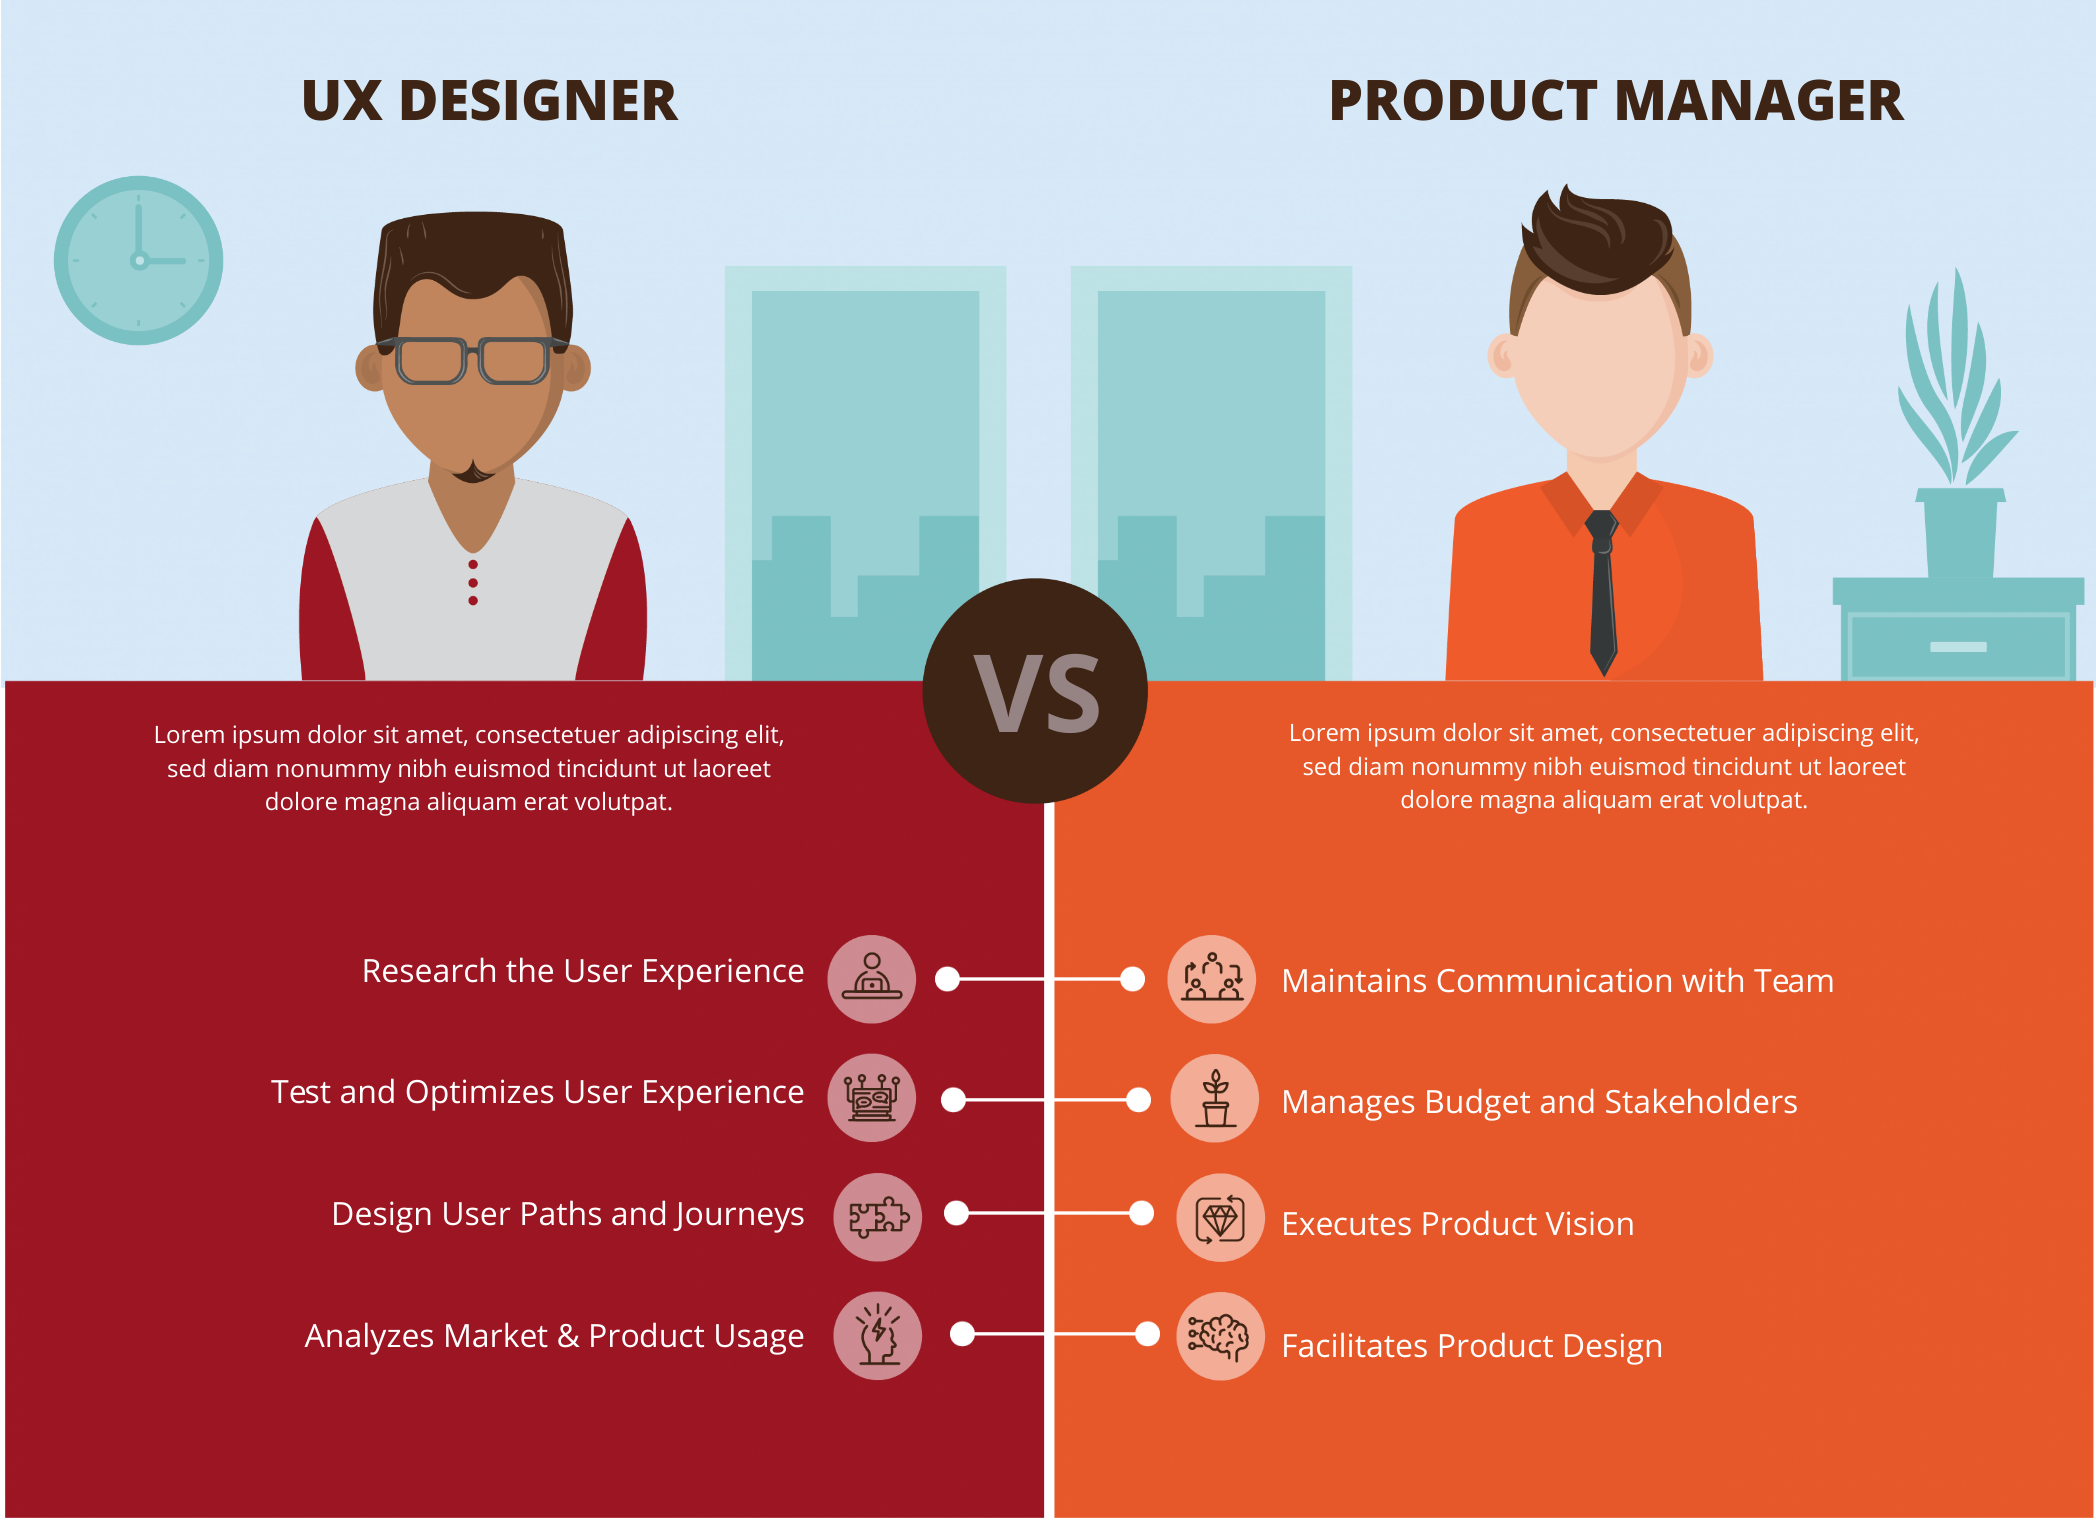
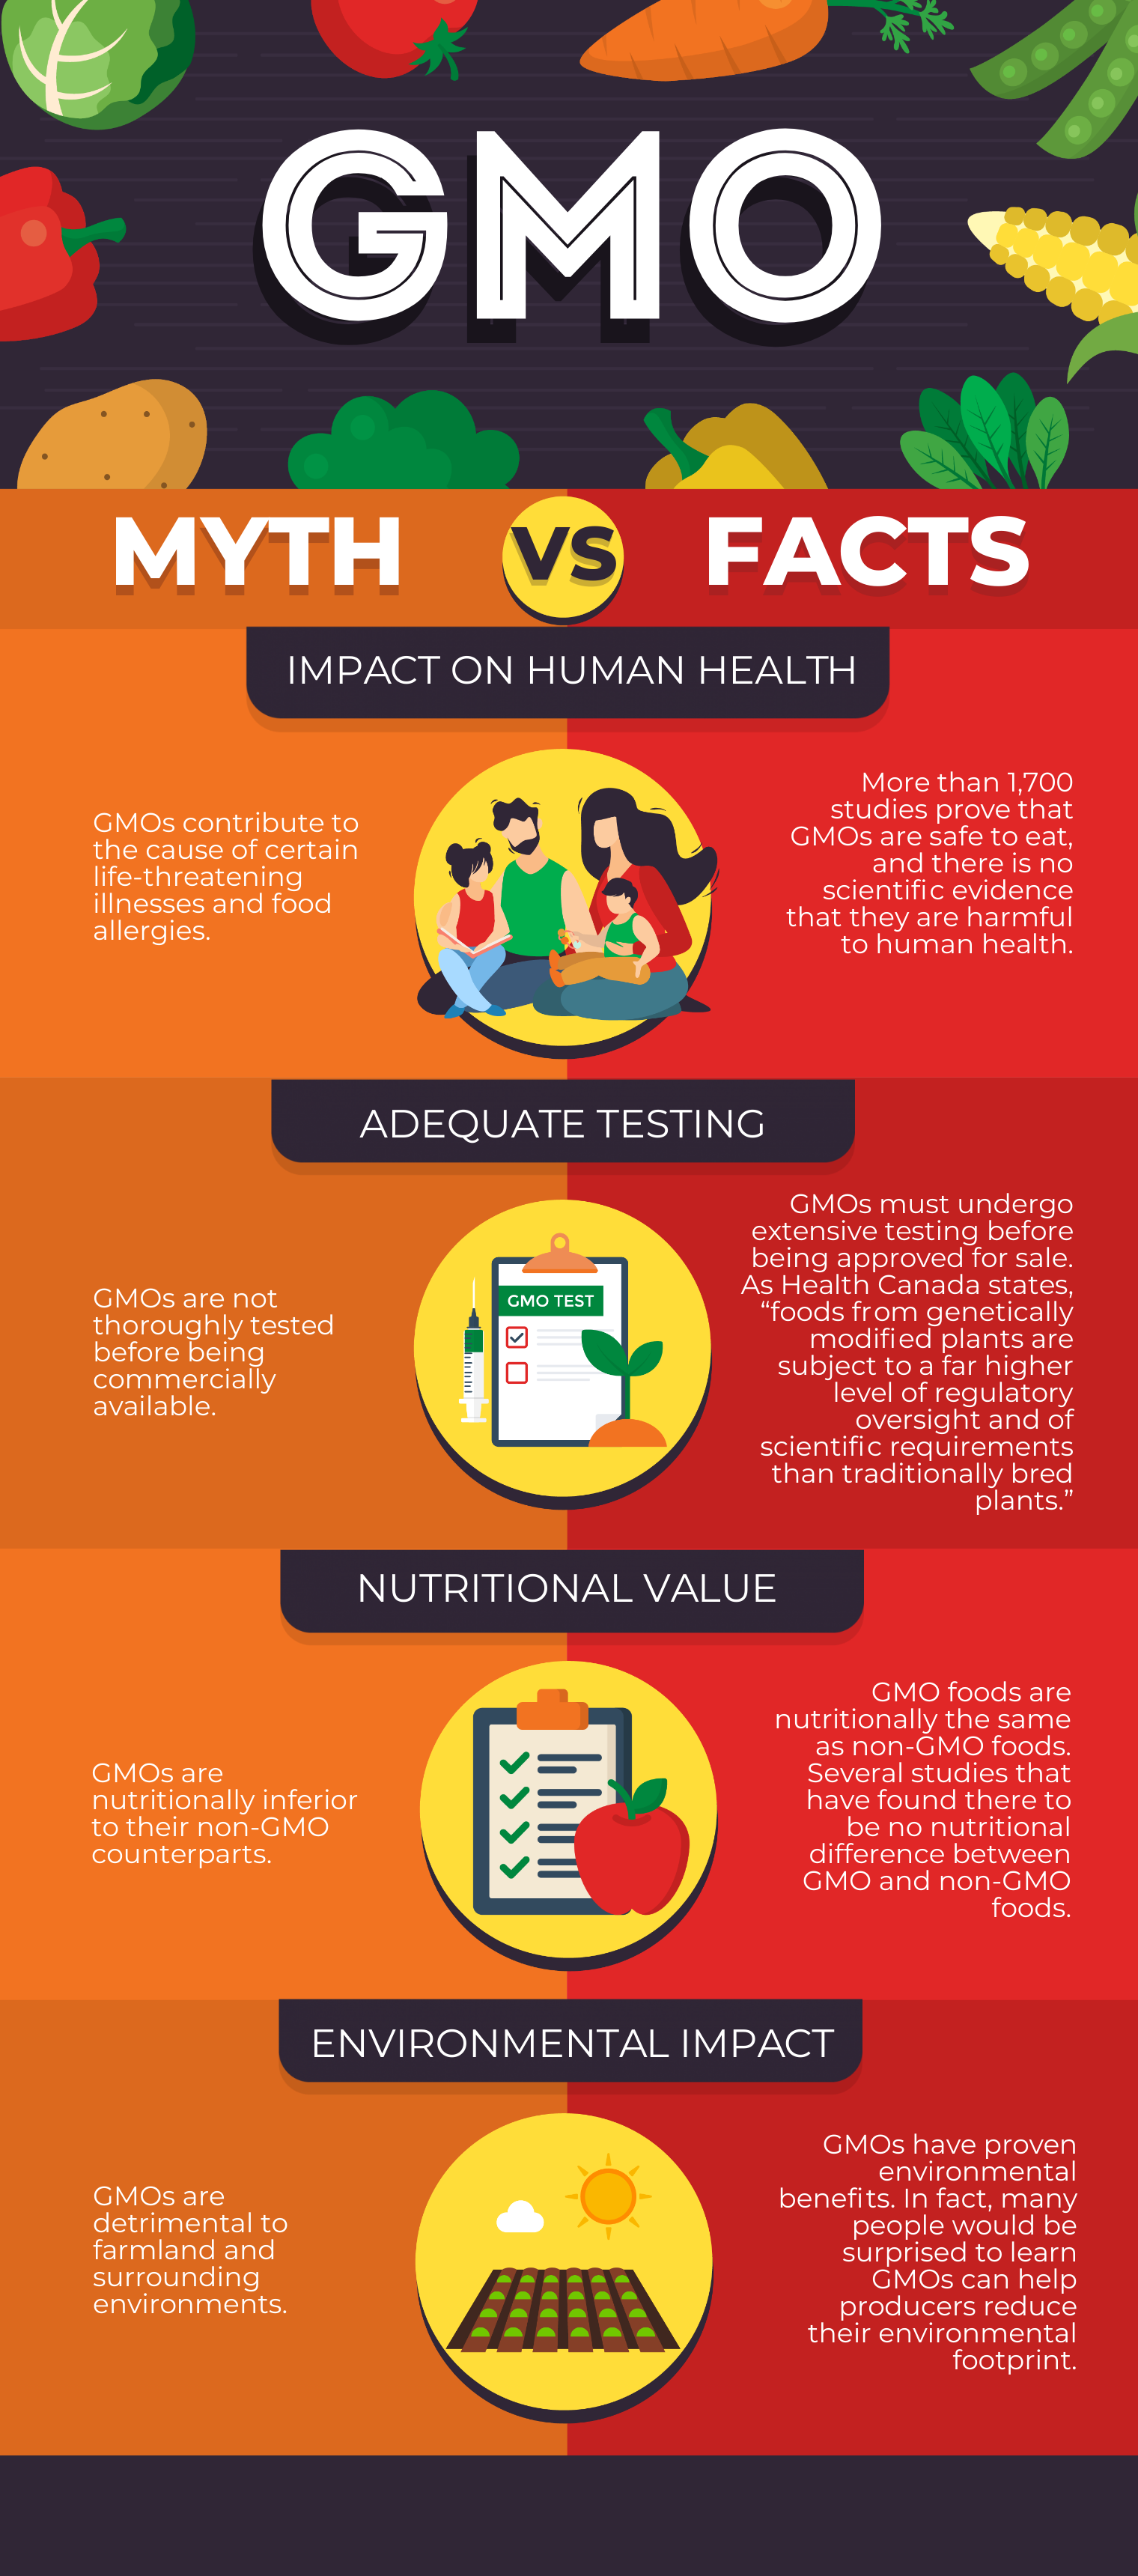
Help your audience make an informed choice by making it easier to compare ideas and options with a comparison infographic
When comparisons are all text, you’re trusting that the person looking the information is reading everything and retaining the essential parts (this might not be the case if your audience is distracted).
Meanwhile, you can clarify why one strategy, product, service, or company is better than another when you’re using comparison infographics.
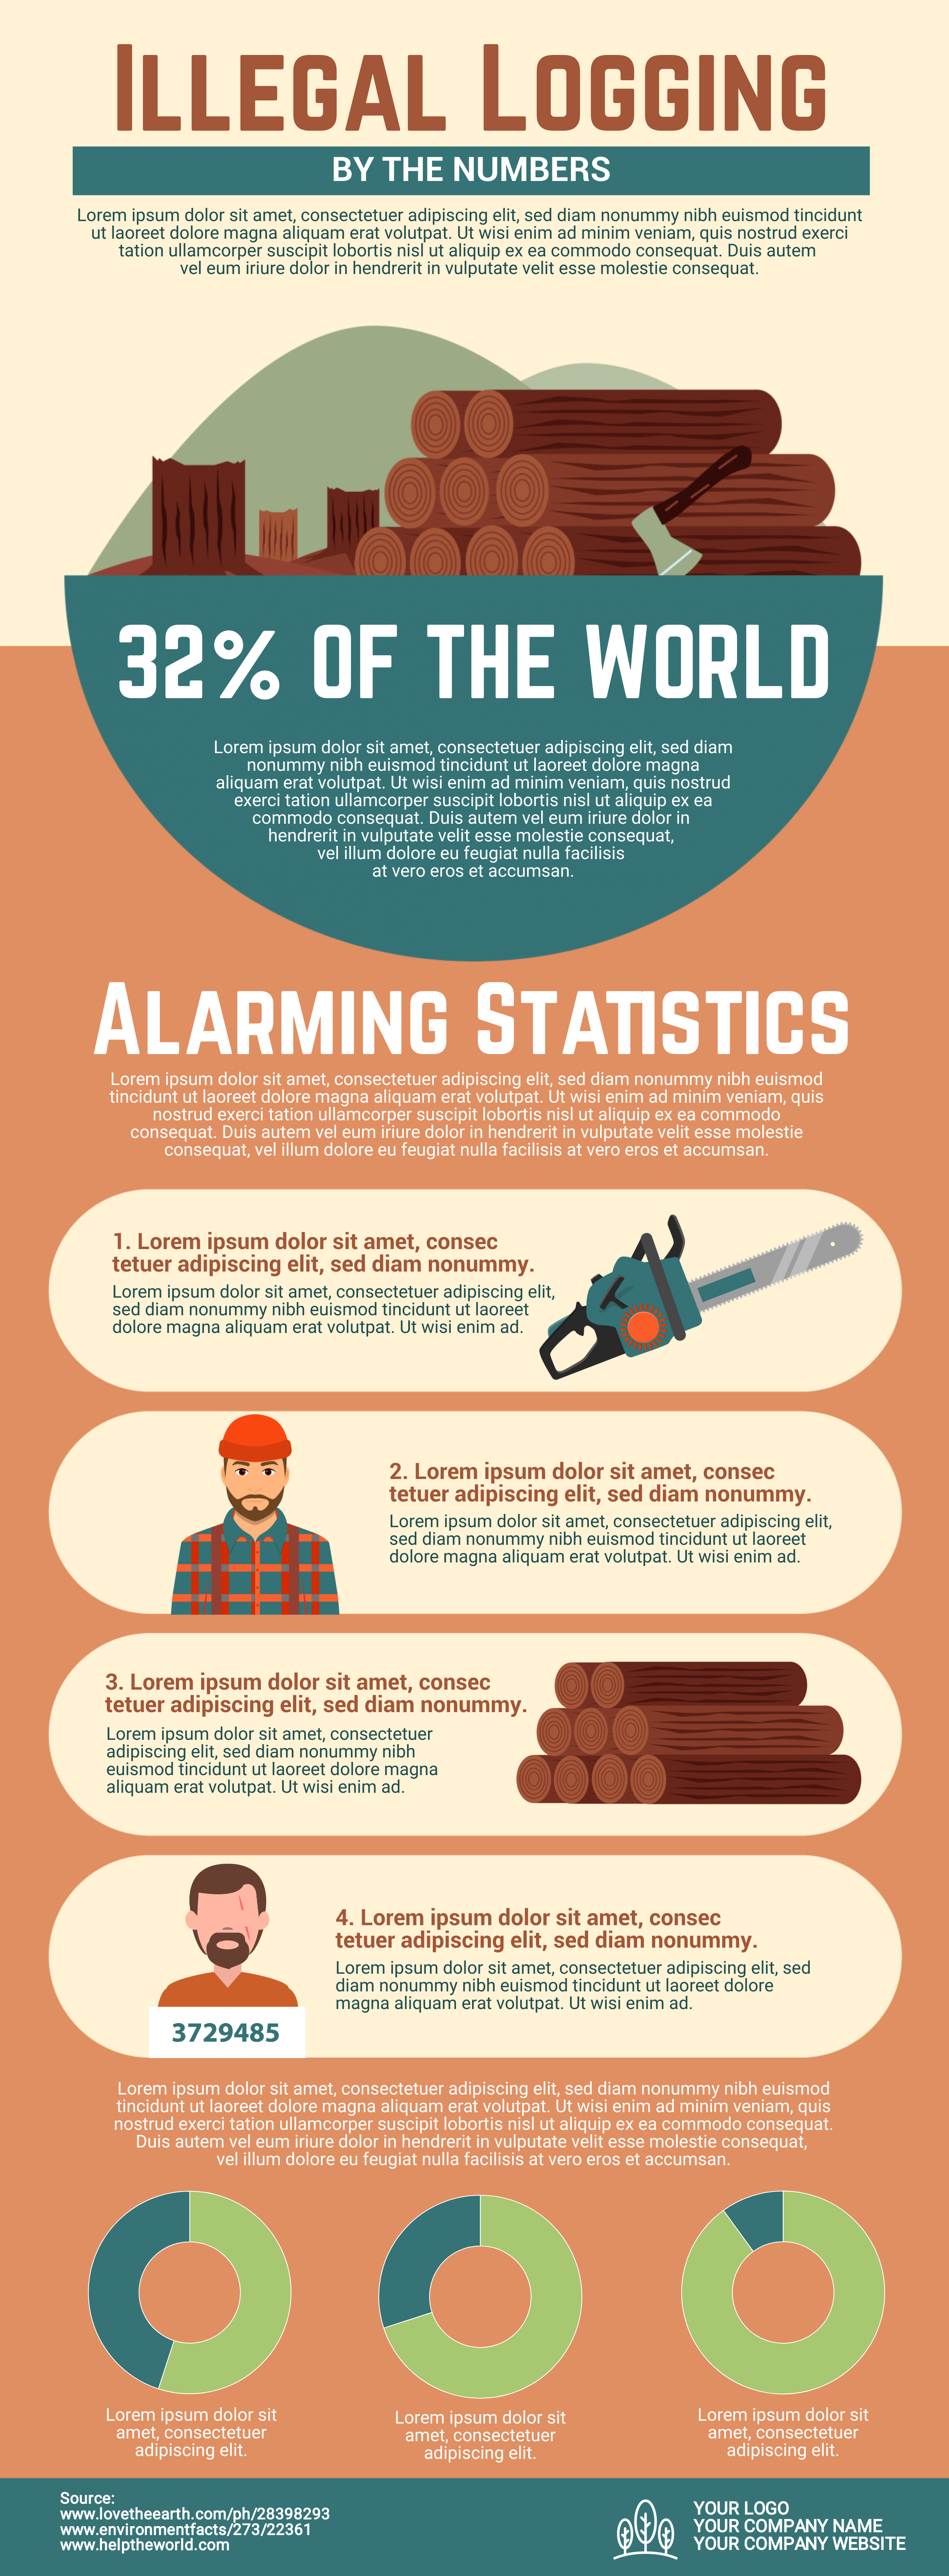
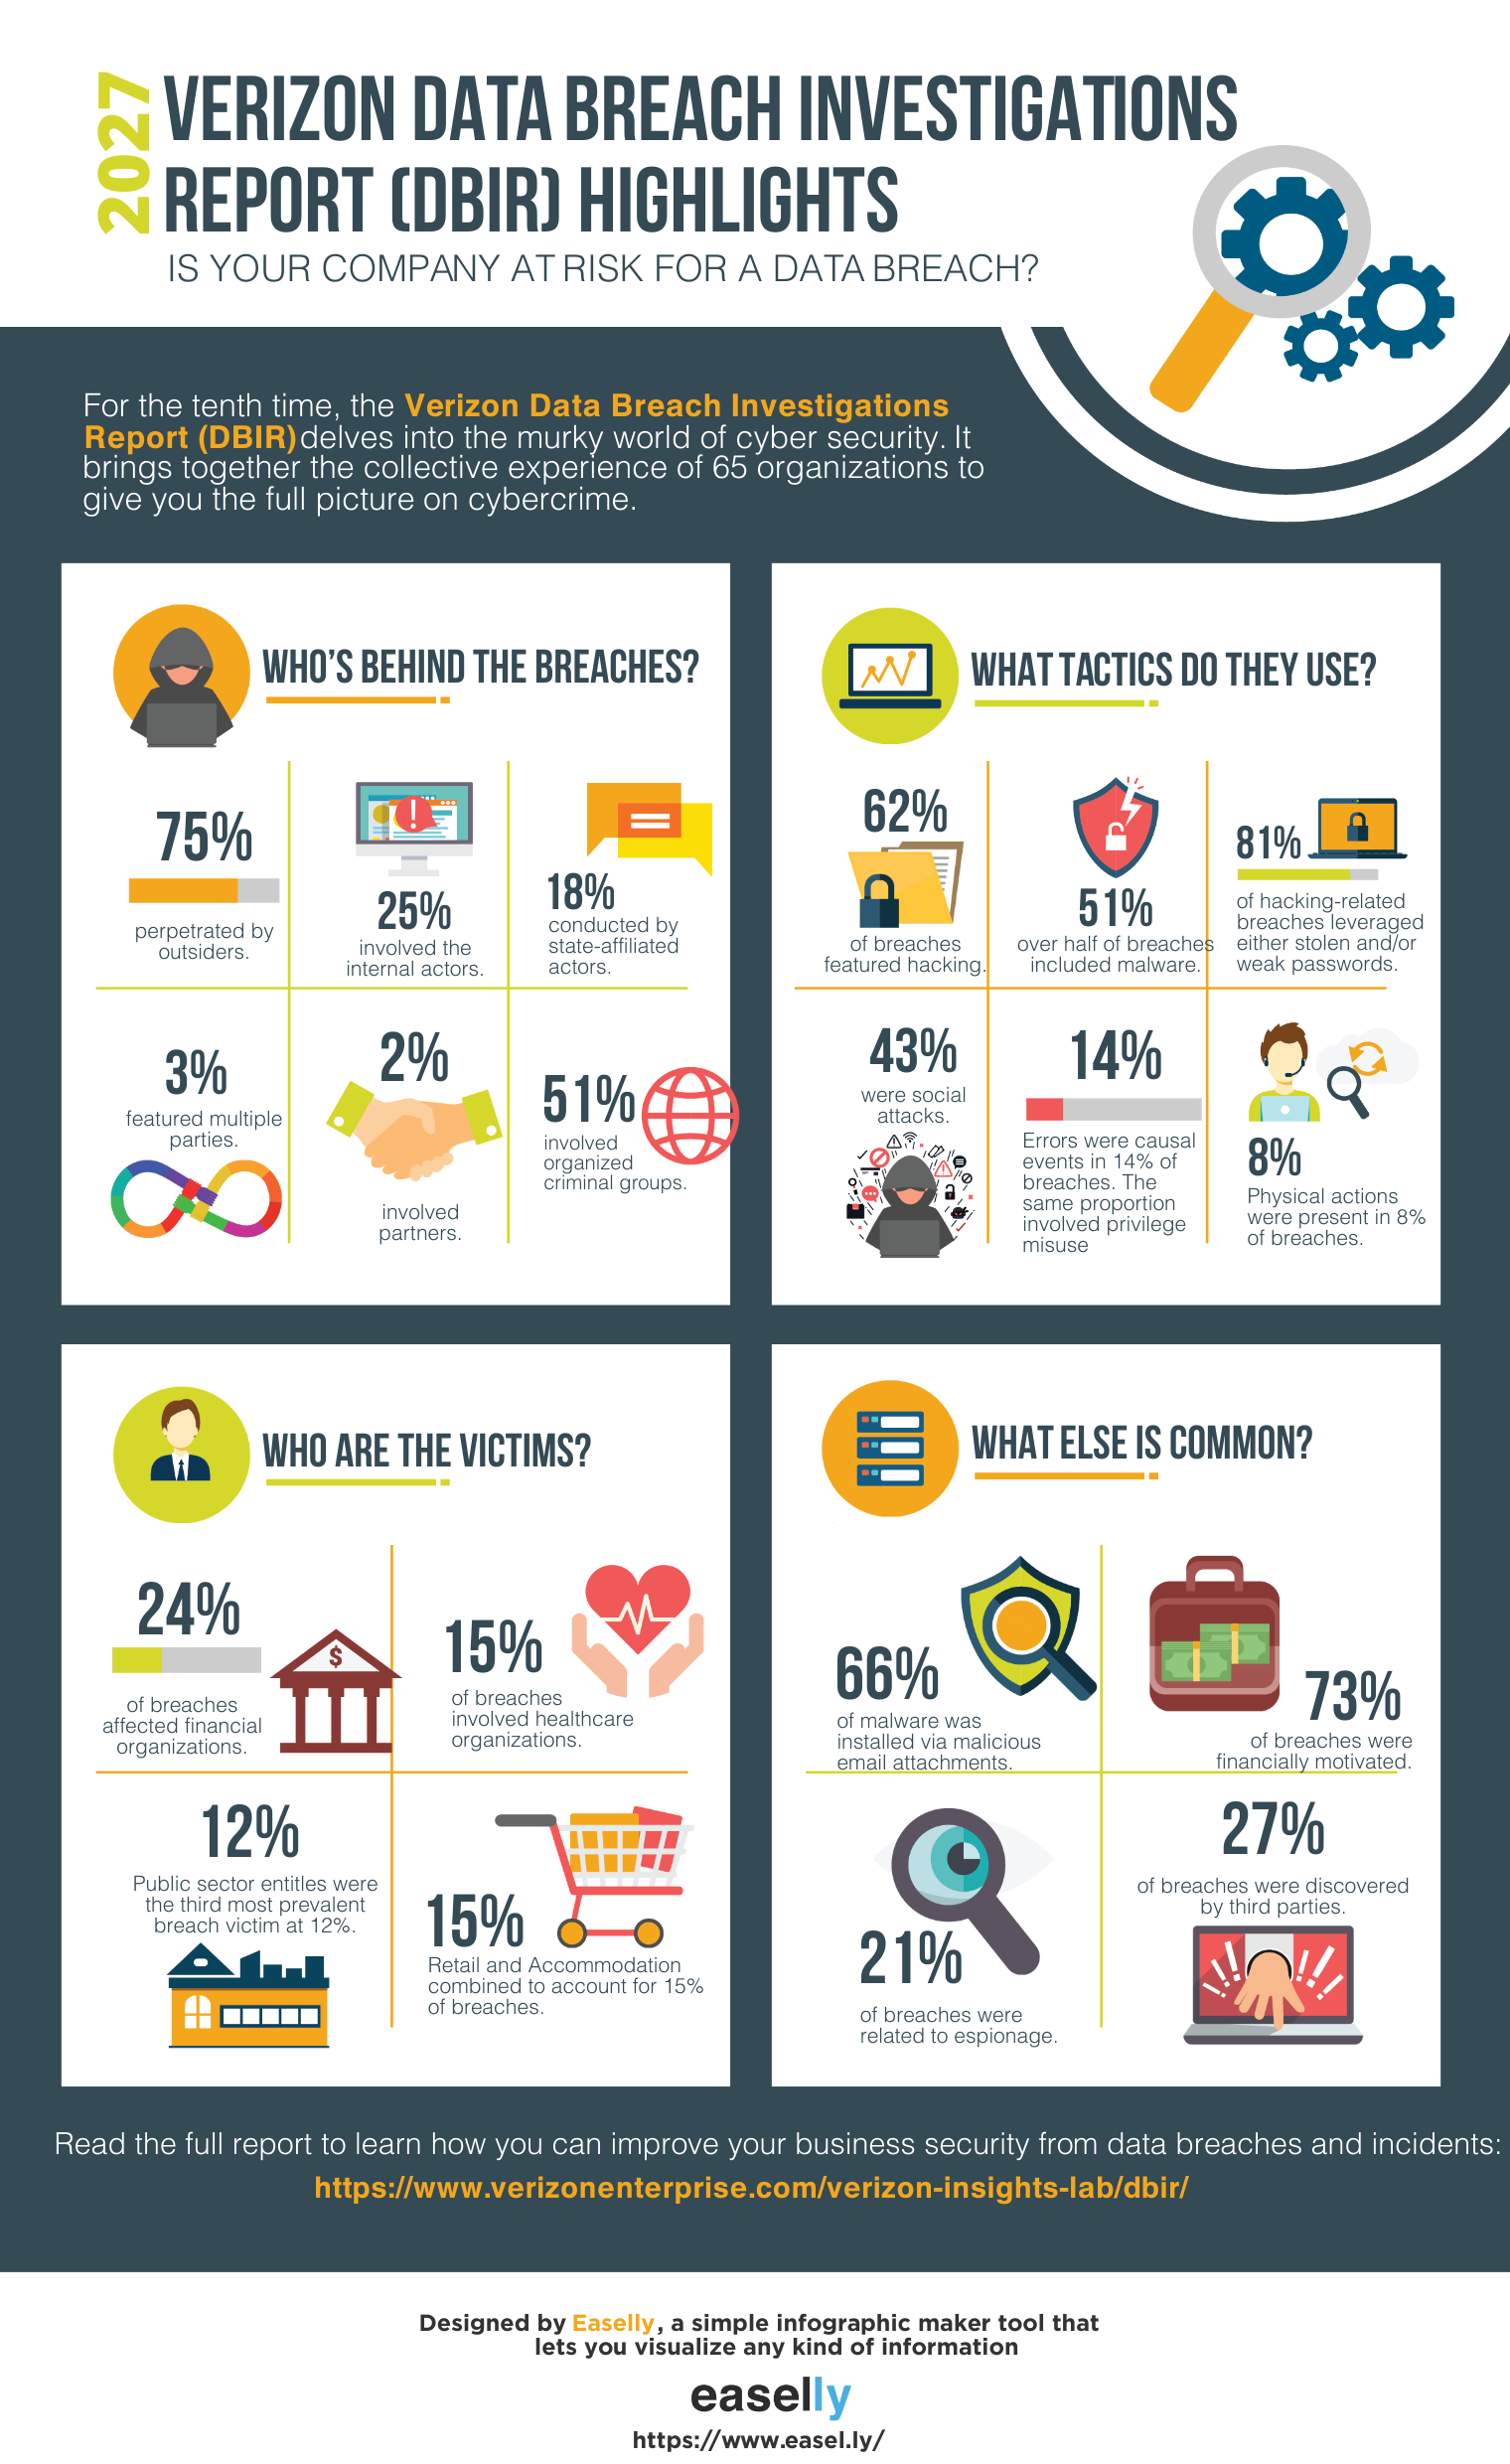
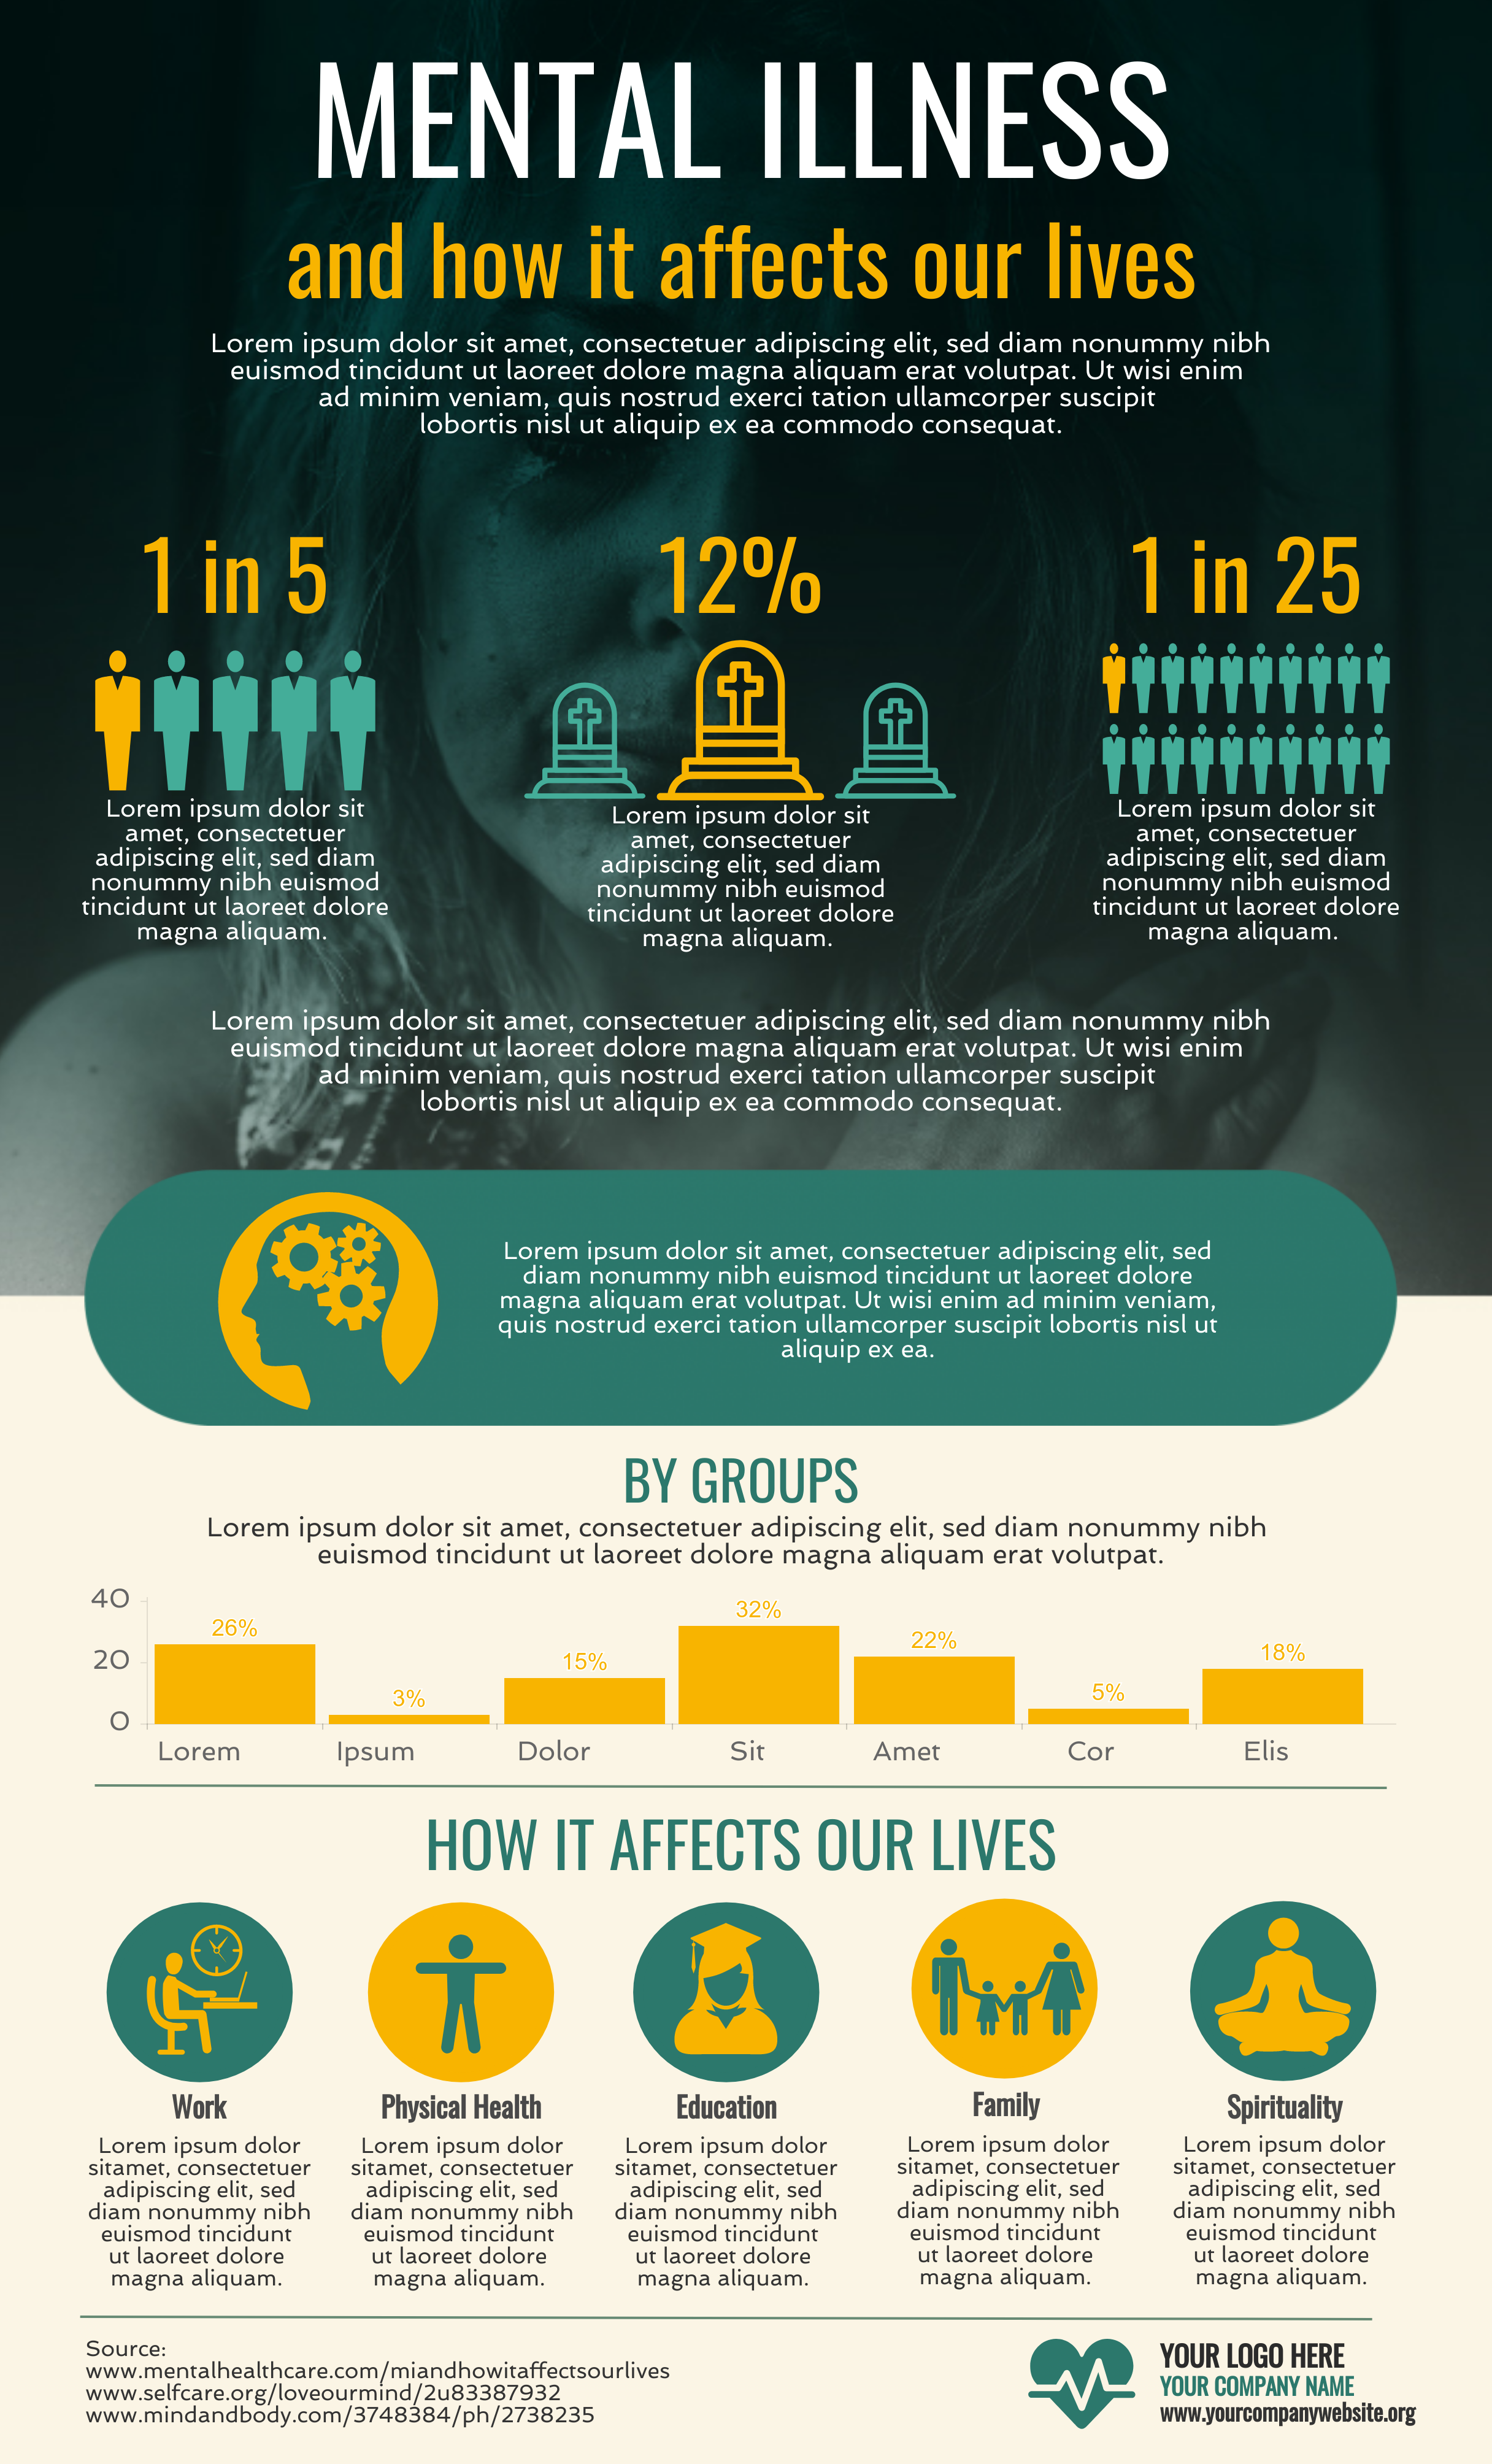
Break down long, investigative presentations into essential data points with visuals
Investigative reports or survey results can be tedious and uninteresting for many.
What if you have only 3 minutes to tell your audience what they need to know?
Highlight the important points and numbers by creating a visual hierarchy of information. A good infographic for this purpose should also be scannable and shareable at the same time.
Go forth and deliver great presentations now
Use the tips and templates from this post to make your presentation more memorable and engaging.
Visual aids are the first thing your audience will see, and it’s your job to keep their attention.
So you just found the right infographic template as visual aid, and you want to customize it with your data, but you’re not sure how to get started?
Learn from this 3-minute tutorial — How to Customize Infographic Templates in Easelly
Our infographic design pros can also make a custom infographic for you within 24-48 hours.