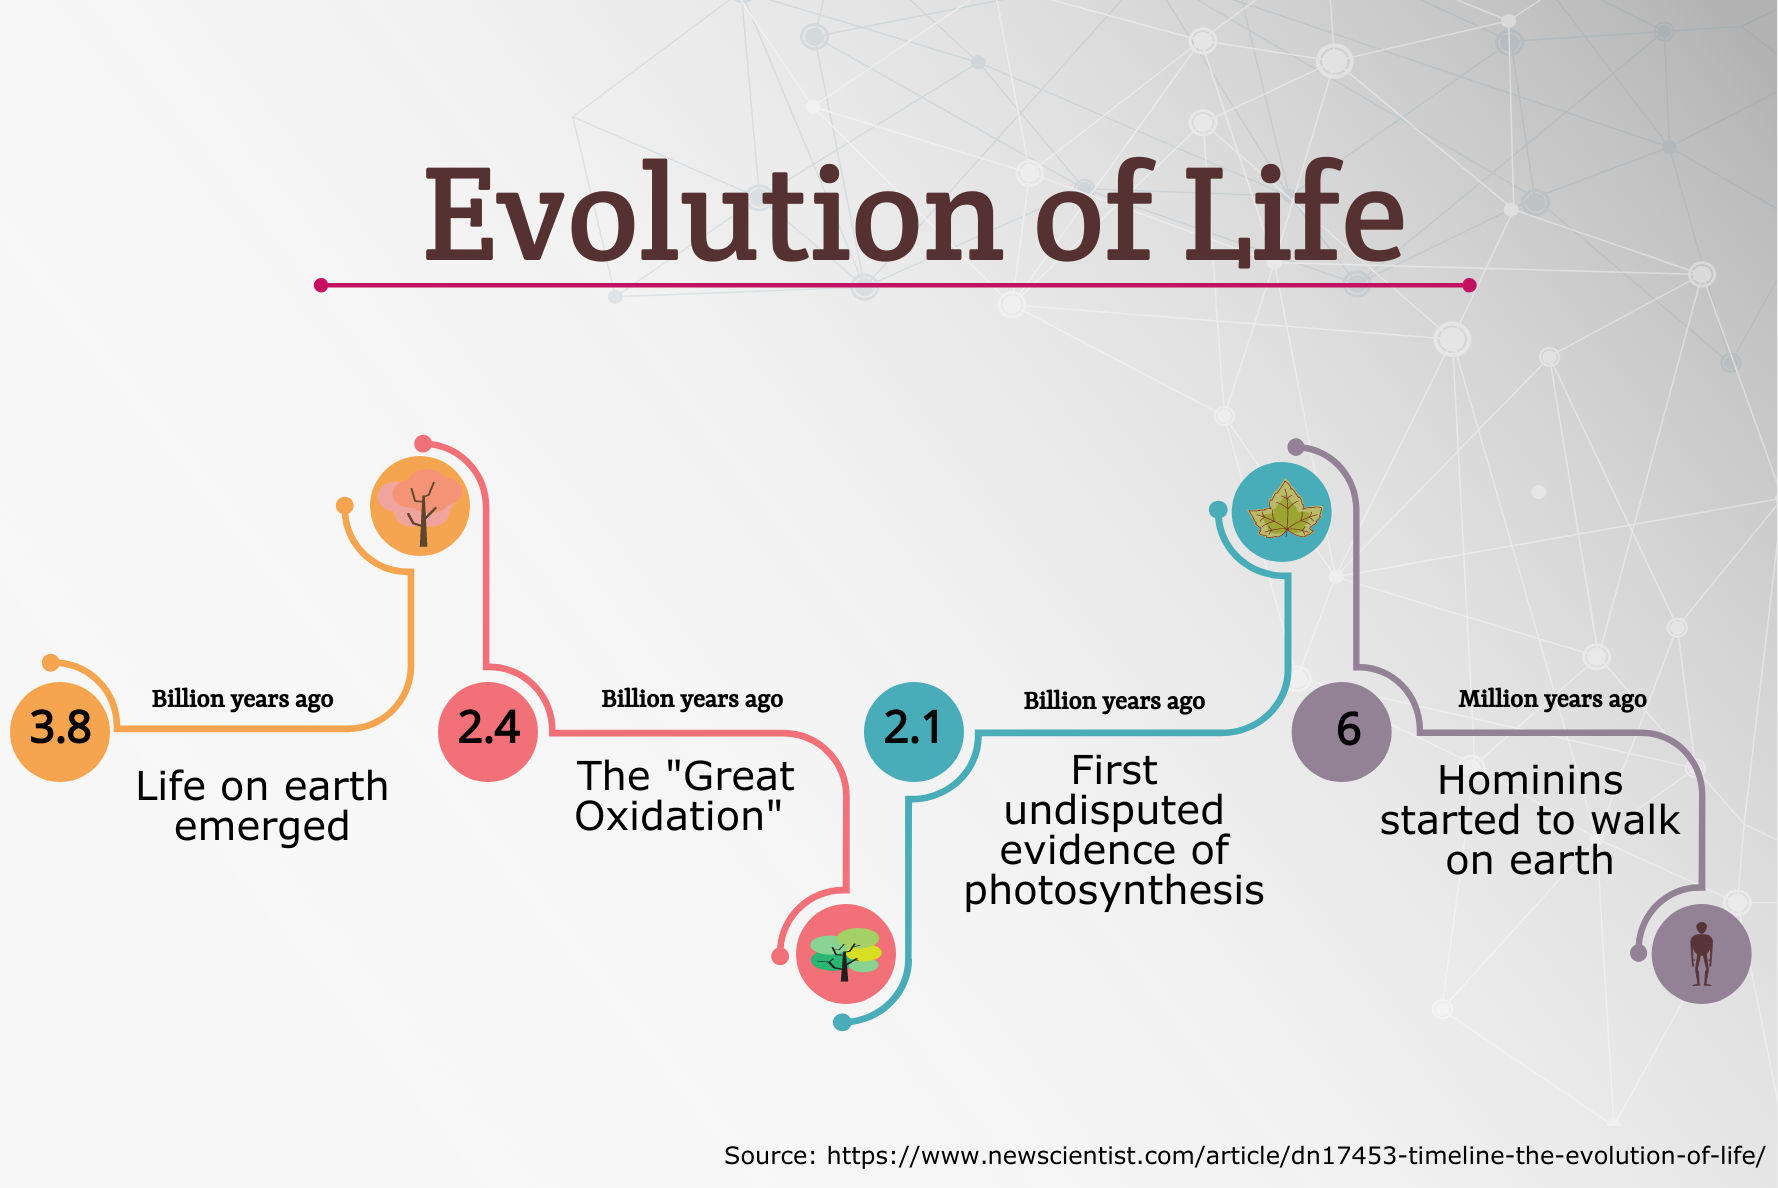
The beginning of life on earth was estimated to emerge around 3.8 billion years ago. Meanwhile, the first undisputed fossil evidence of photosynthesis happened roughly 2.15 billion years ago.
Finally, it was about 6 million years ago that hominins (the group consisting of modern humans, including extinct human species and all our immediate ancestors) started to walk on earth.
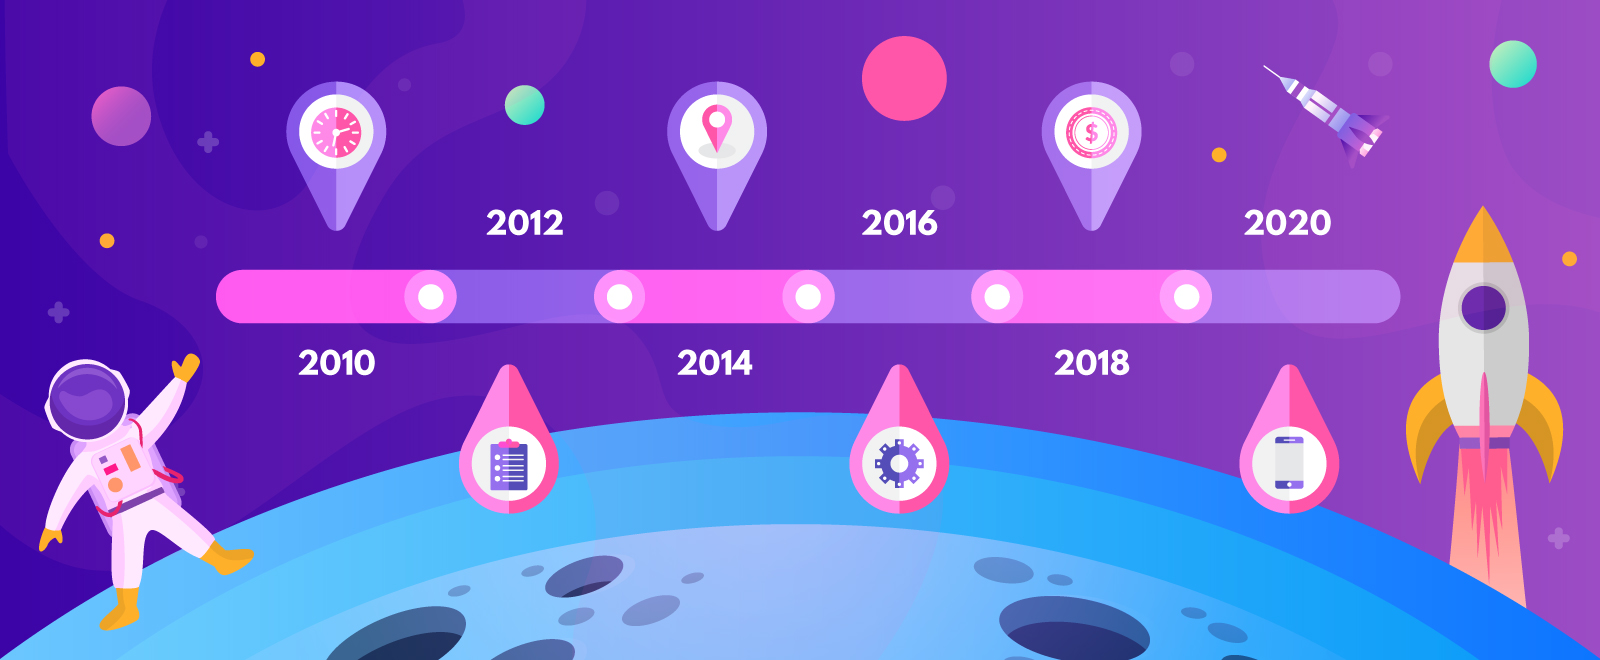
Now, can you imagine a visualization of the information above in an infographic timeline?
While the visual format of the information looks simple than the usual timeline infographics you see on the interwebs, it’s more engaging and memorable than its plain text format.
People are also more likely to pause and go over your infographic because the visualization automatically creates a sense of order and flow for them.
When to use timeline infographics
Timelines have been in use even before data visualization and infographic software were common. You’ll find timelines in print media such as history books, brochures, newspapers, and manuals explaining a procedure or process.
Today, timelines have also evolved with technology. It’s easier to create interactive, engaging timelines from scratch or through infographic templates.
The primary function of timelines in infographics is to communicate time-related information or data either for analysis or presentation.
It allows you to tell a story chronologically — from sharing how you got to where you are right now in your career to the evolution of Levi’s denim jeans.
In addition, timelines in your infographic allow your reader to notice patterns appearing over specific periods or how events take place during a selected time frame.
Specifically, timeline infographics are ideal if you want to:
- show how one thing leads to another
- demonstrate how something has changed over time
- make a long, complicated story easier to understand
5 timeline infographic examples for design inspiration
As you get started with your infographic, here are some examples you can take inspiration from to delight and inform your audience visually!
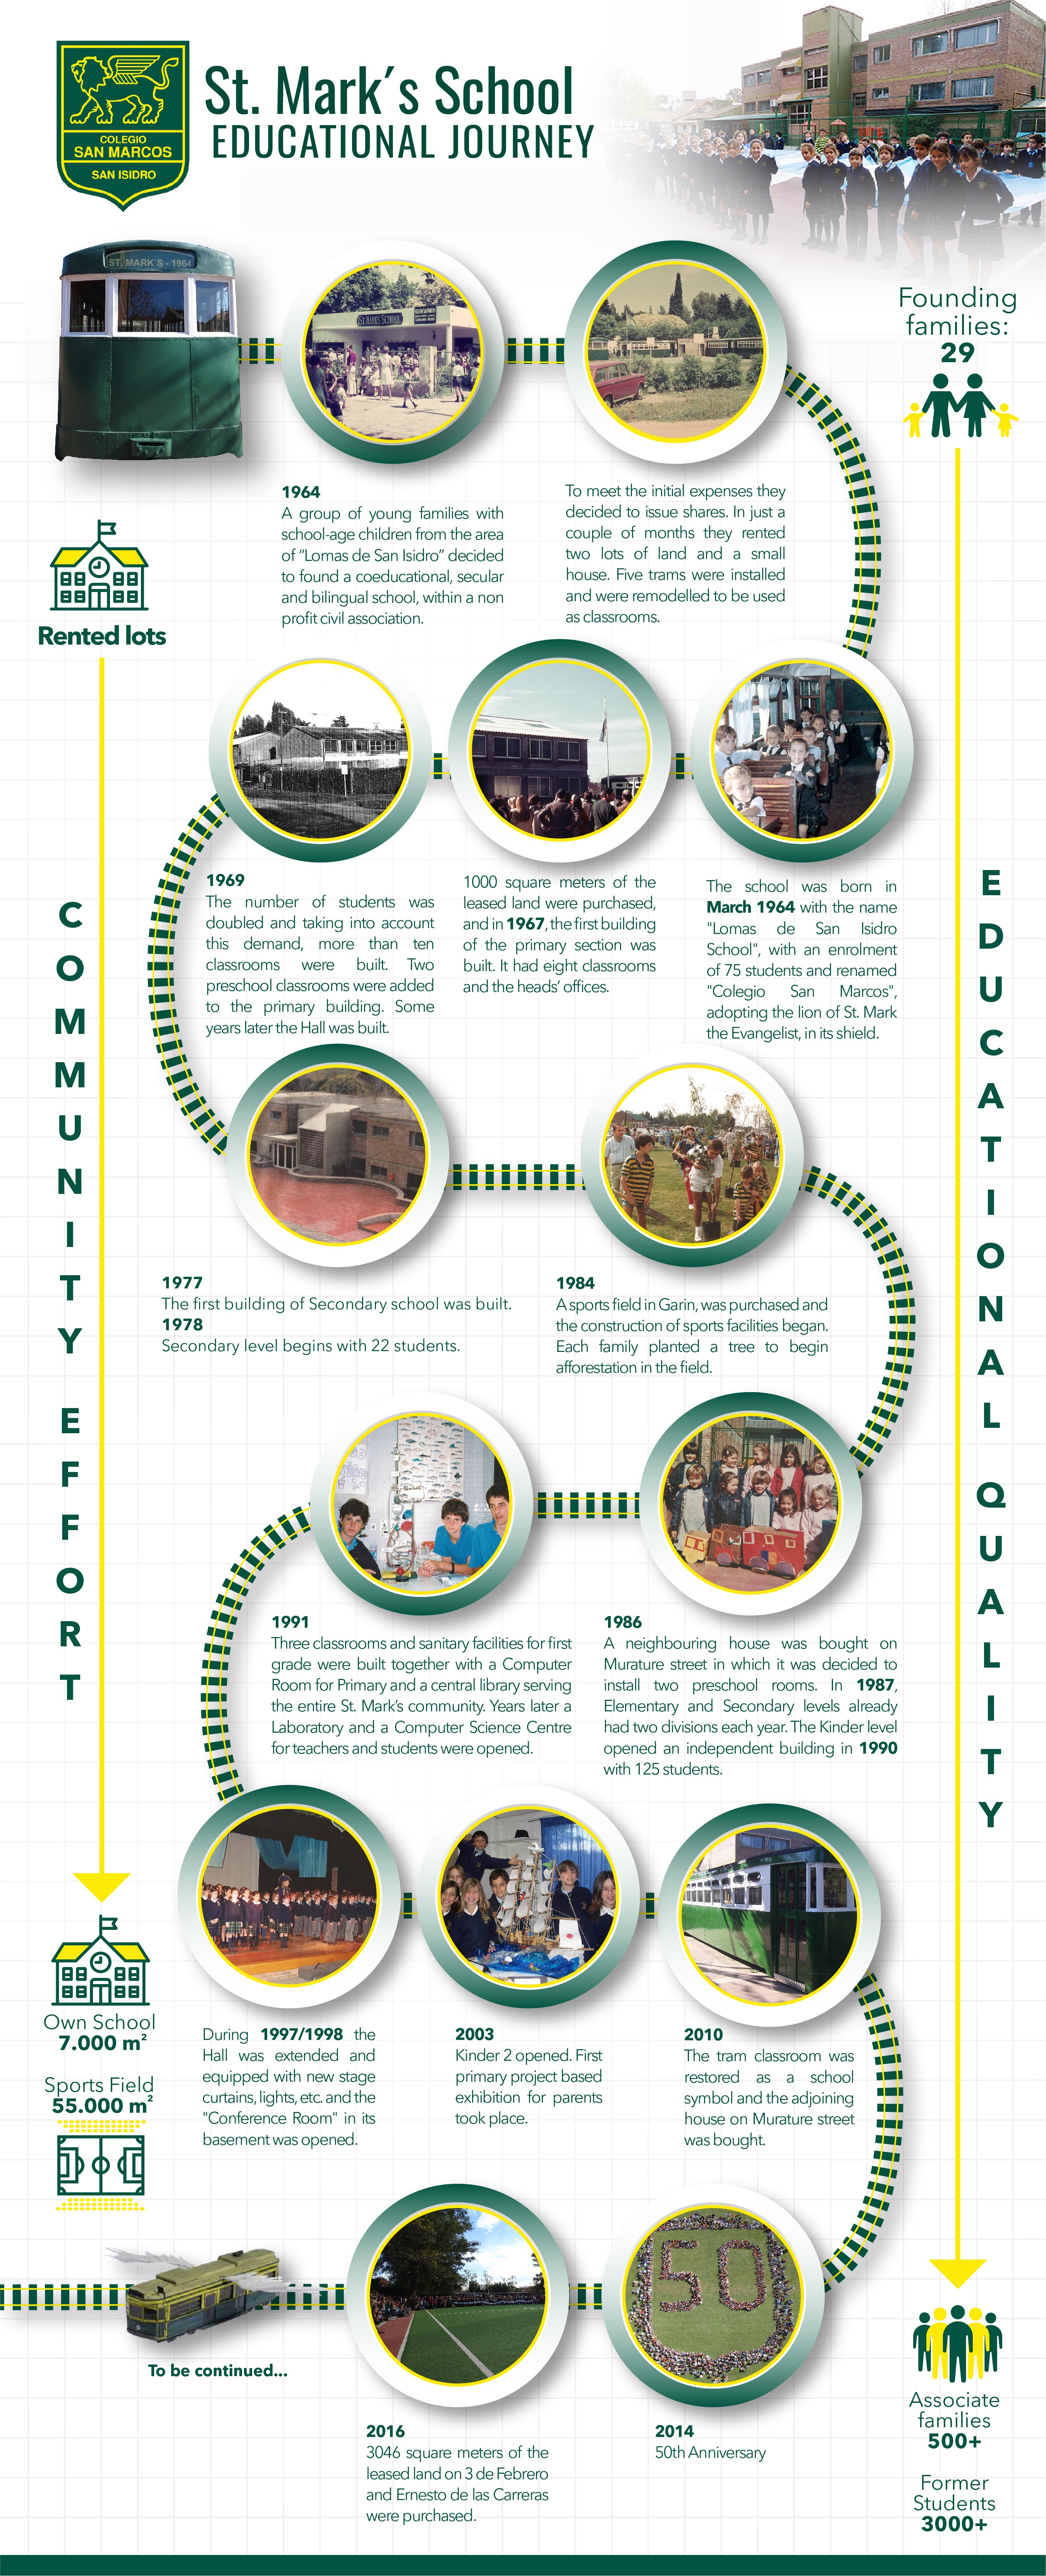
Use timeline infographics to share historical data
The historical timeline is perfect if you want to summarize a series of events from past to present. You can even upload your own images in your infographic just like the infographic below.
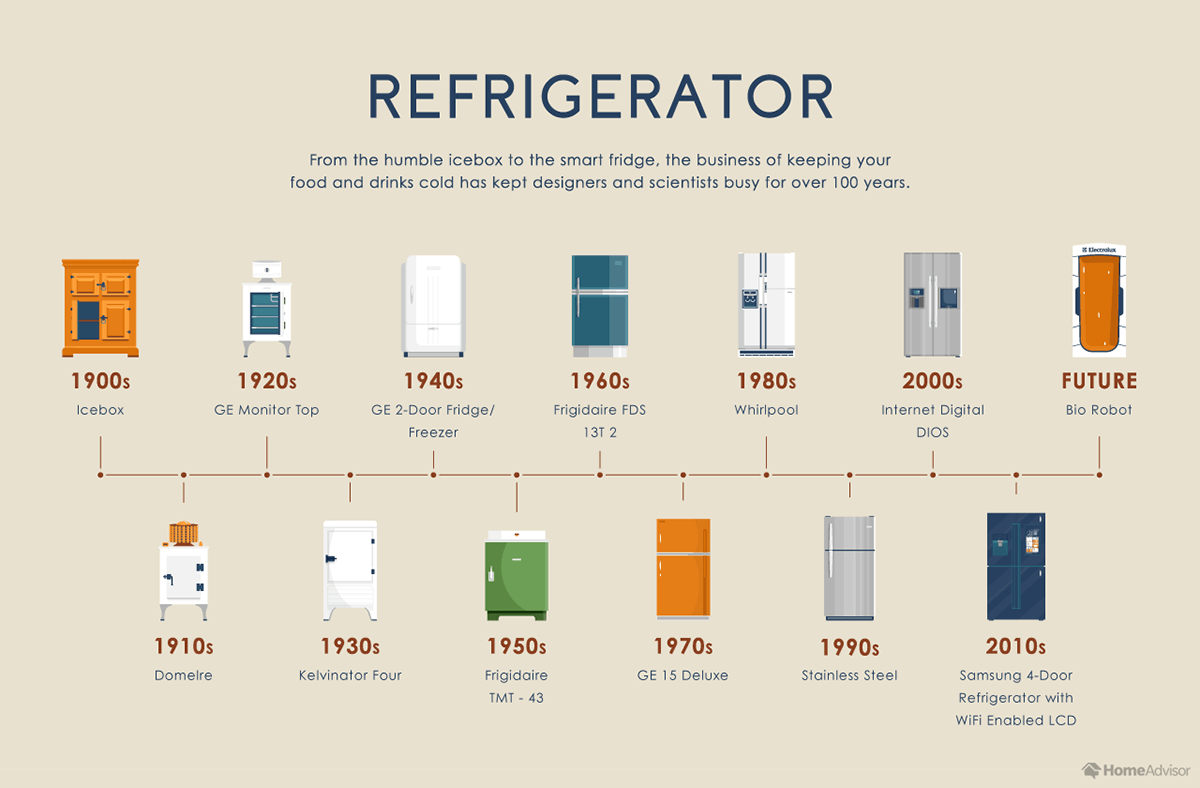
Use timeline infographics to demonstrate how things have changed or evolved
Want to highlight the transformation of a particular object or event? Keep it clear and simple like the chronological timeline infographic below.
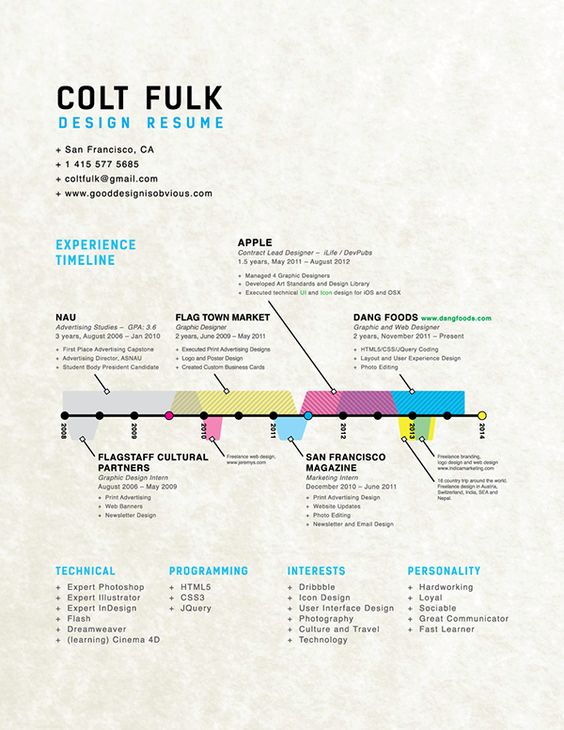
Use timeline infographics to highlight career milestones and work experience
If you’re seeking a new role or looking to shift to another career, a career timeline can help you stand out from other job seekers.
Hiring managers and recruiters skim resumes in seconds so an infographic resume is your best bet to getting picked for an interview!
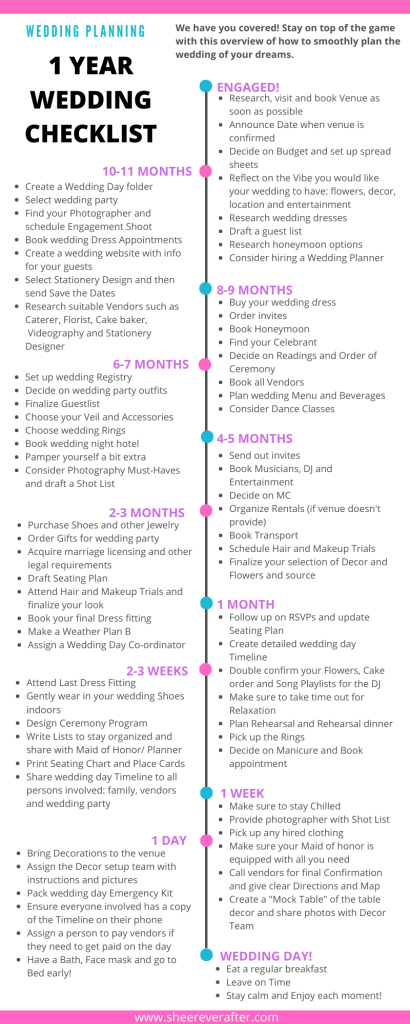
Use timeline infographics to plan for an event
Planning and organizing an event can be stressful even for event planning pros. Stay on track and don’t miss any details using event planning timeline infographics.
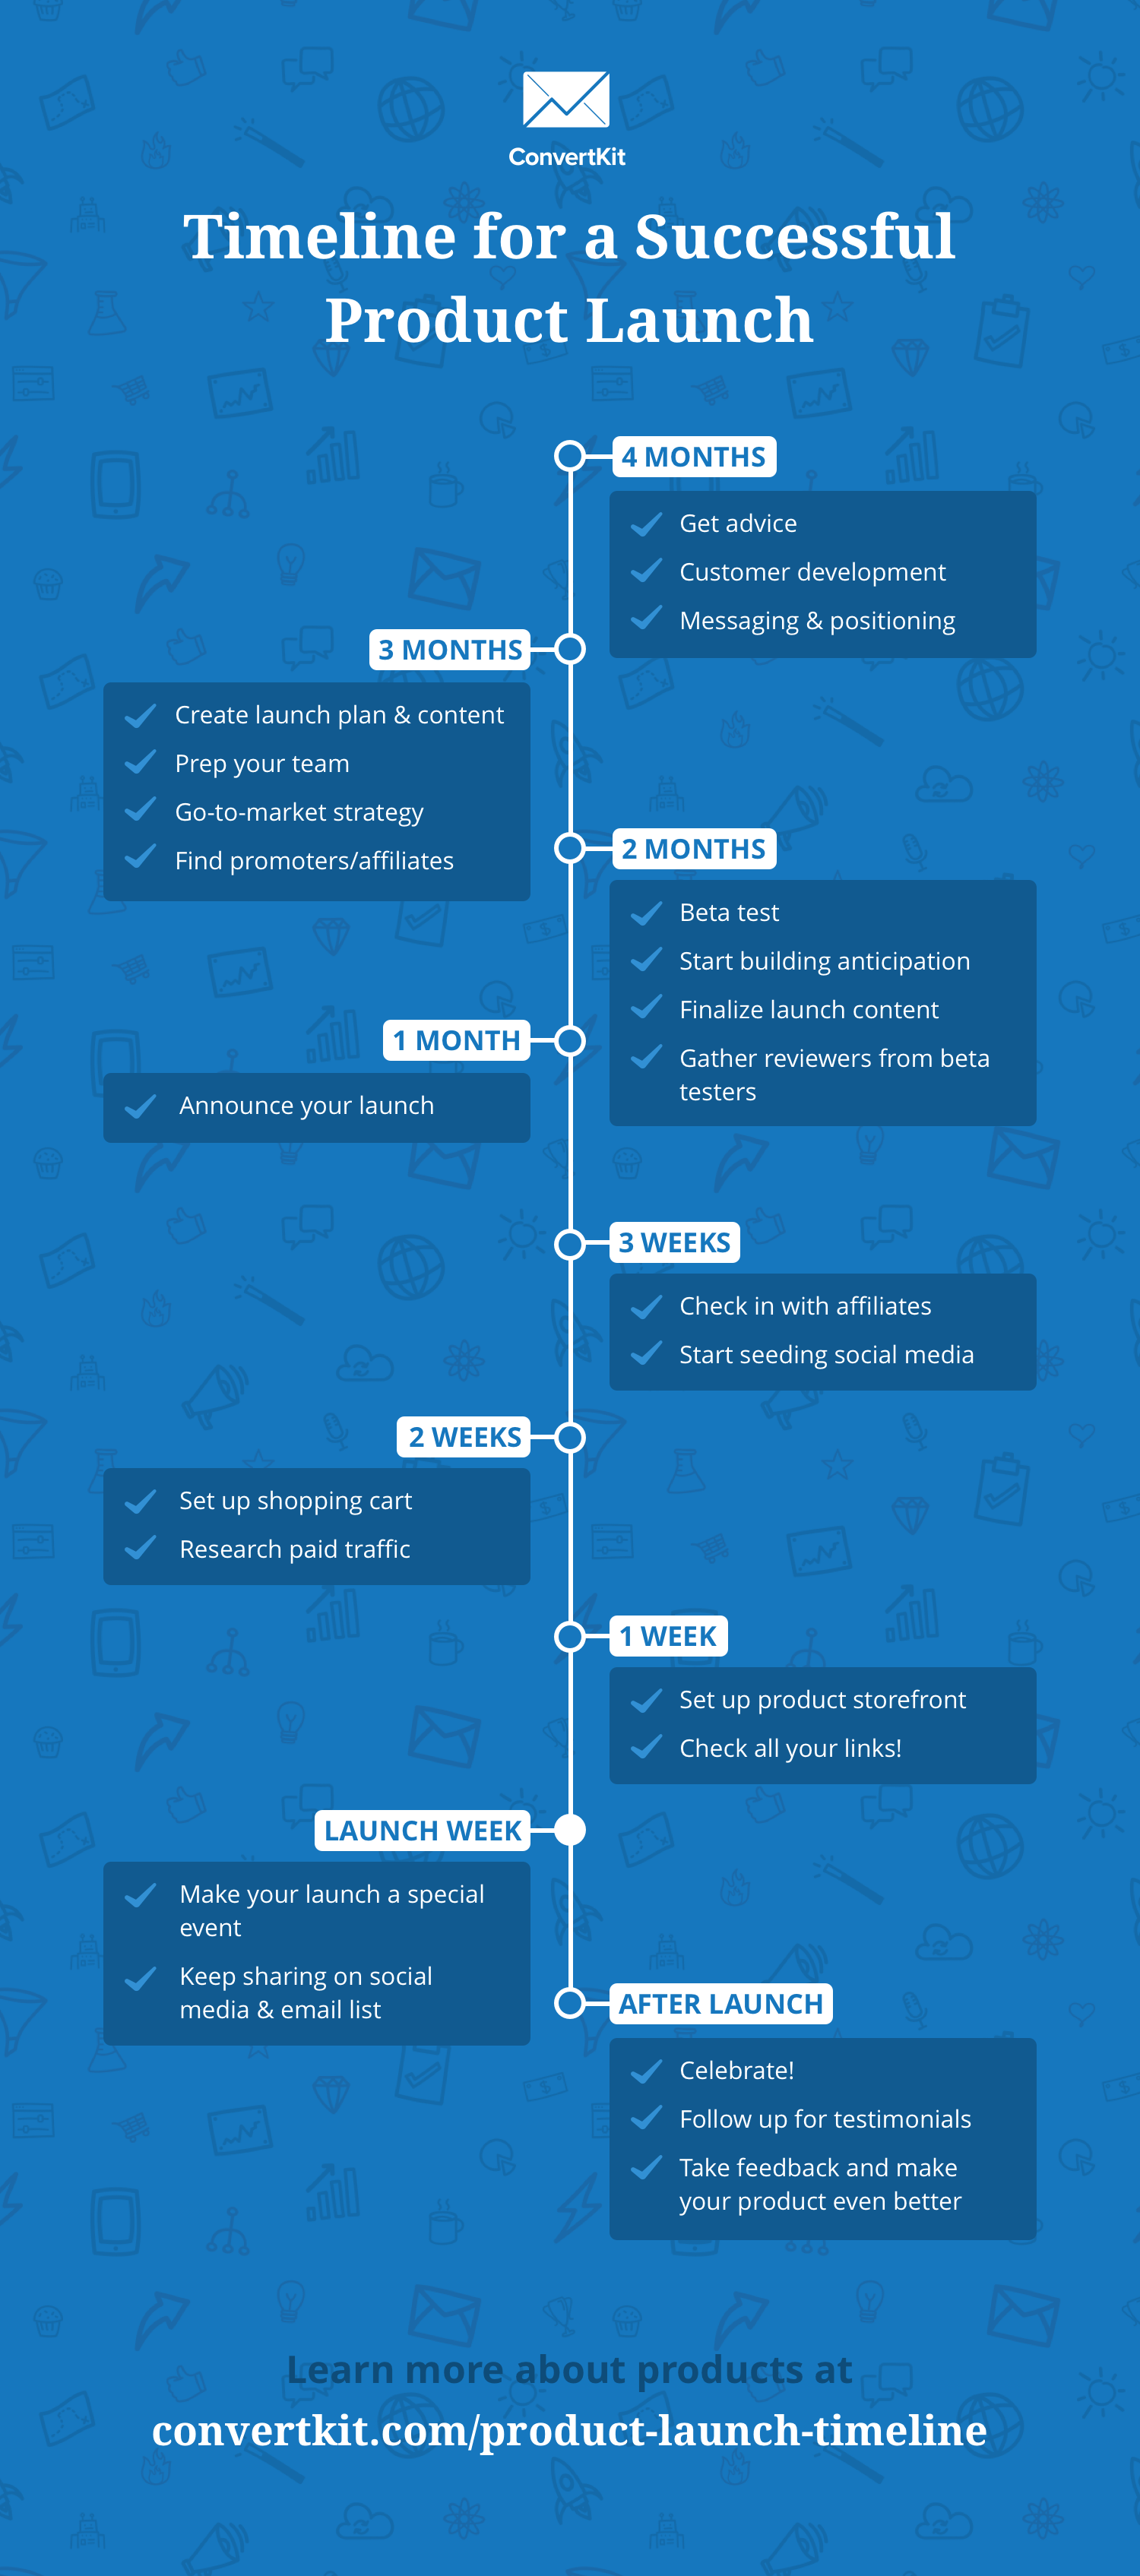
Use timeline infographics to explain how long a process takes place
A well-designed process infographic gives readers a sense of organization and structure. The product launch infographic by ConvertKit below is an excellent example.
7 timeline infographic templates you can edit and customize
Whether you’re looking for a timeline that will go well with your next Powerpoint presentation or you’d like to share the manufacturing process of your products, customize any of the templates below!
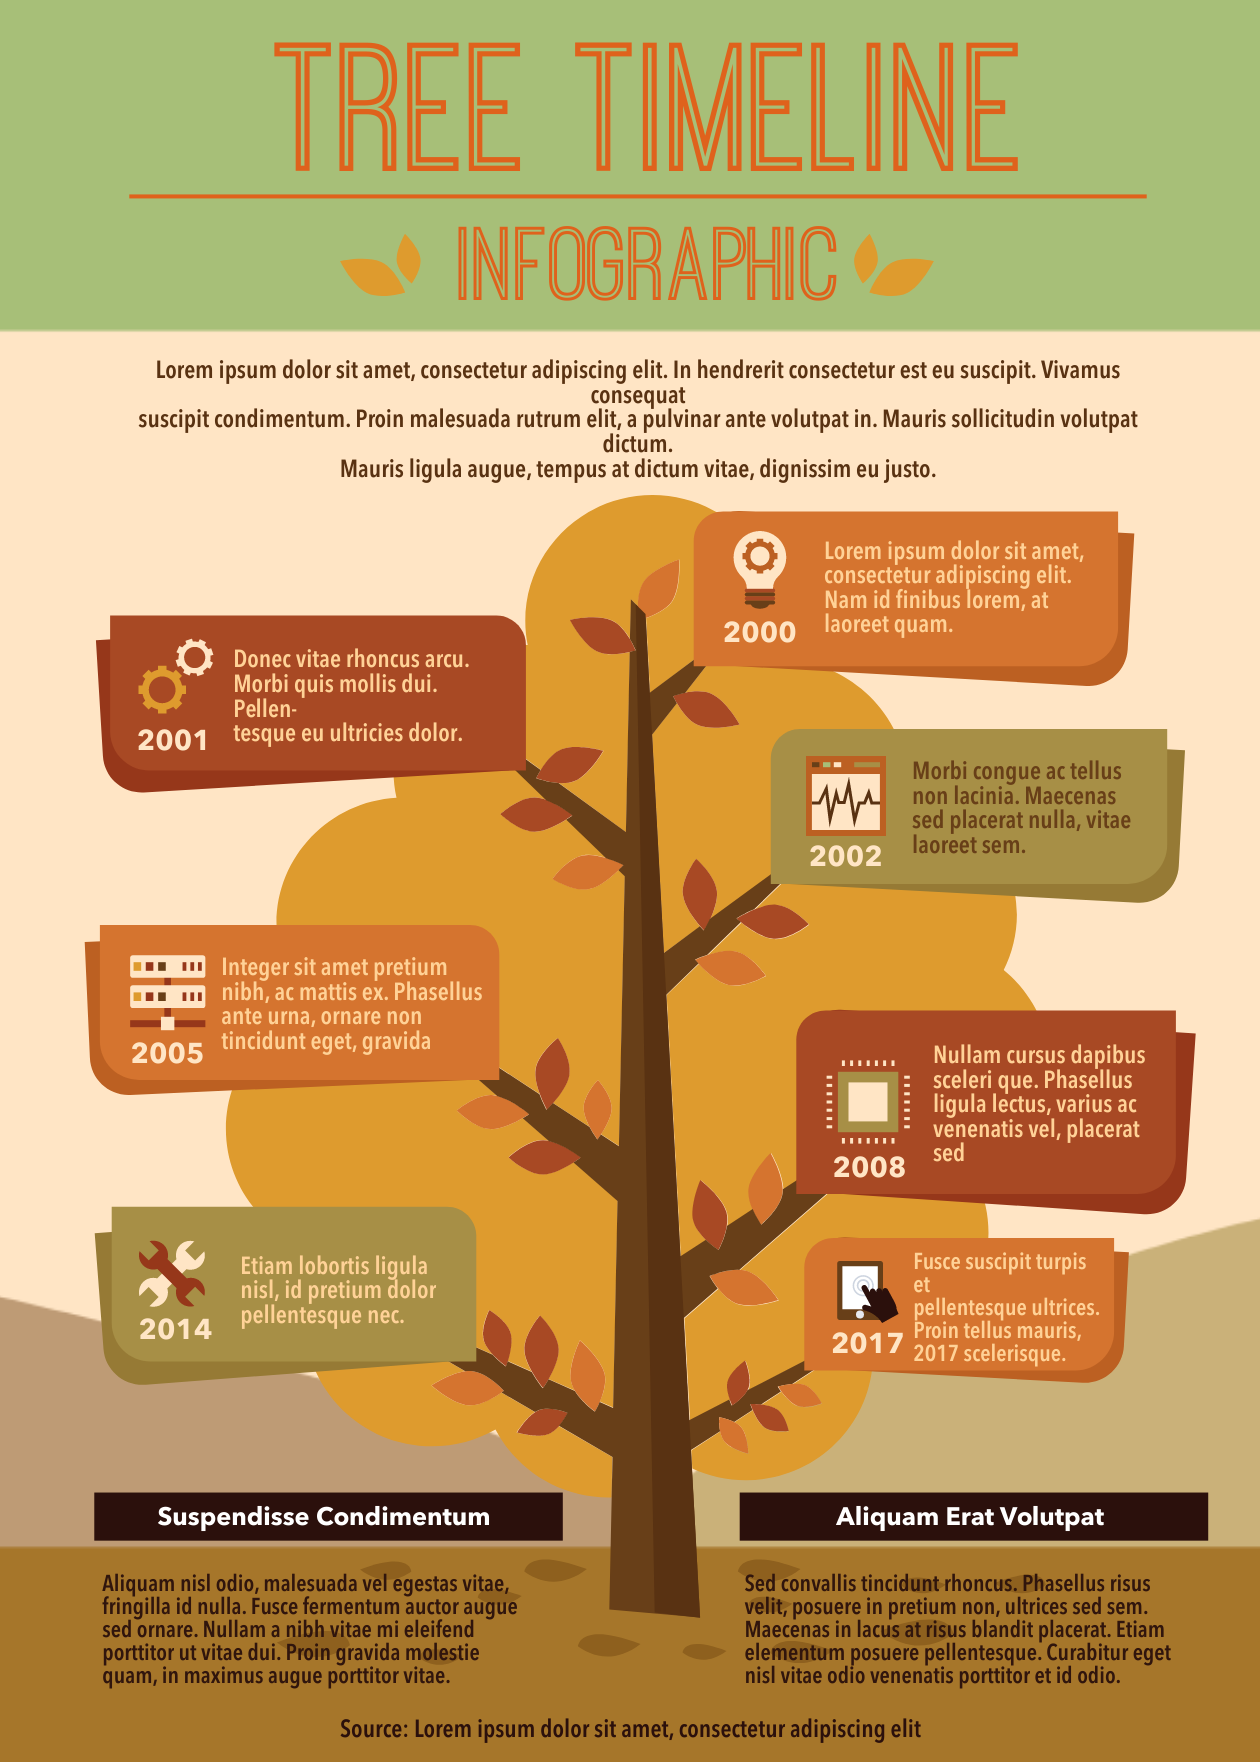
Tree timeline infographic template
With just a few clicks, you can customize this tree template into a beautiful, engaging visual.
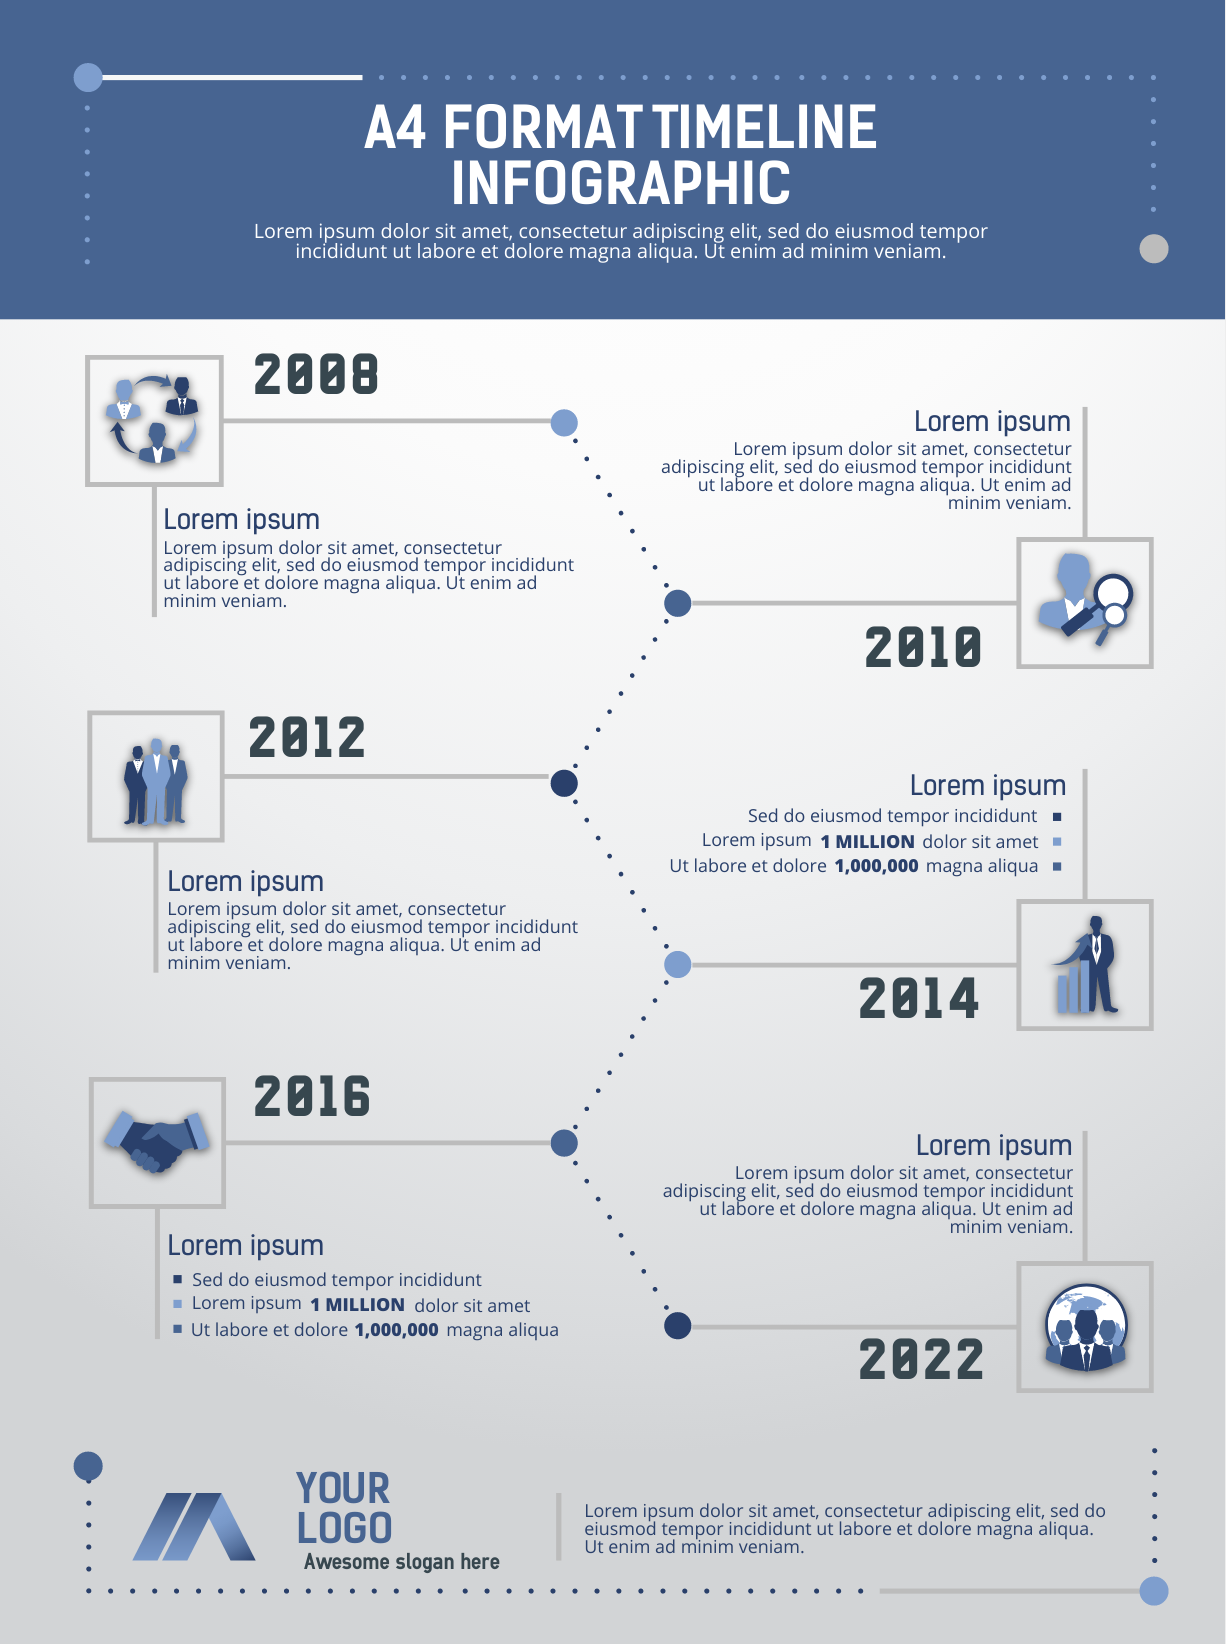
A4 format timeline template
Organize bits of data and make them more memorable for your audience with this infographic. Bonus points because this template is already print-ready in A4 format!
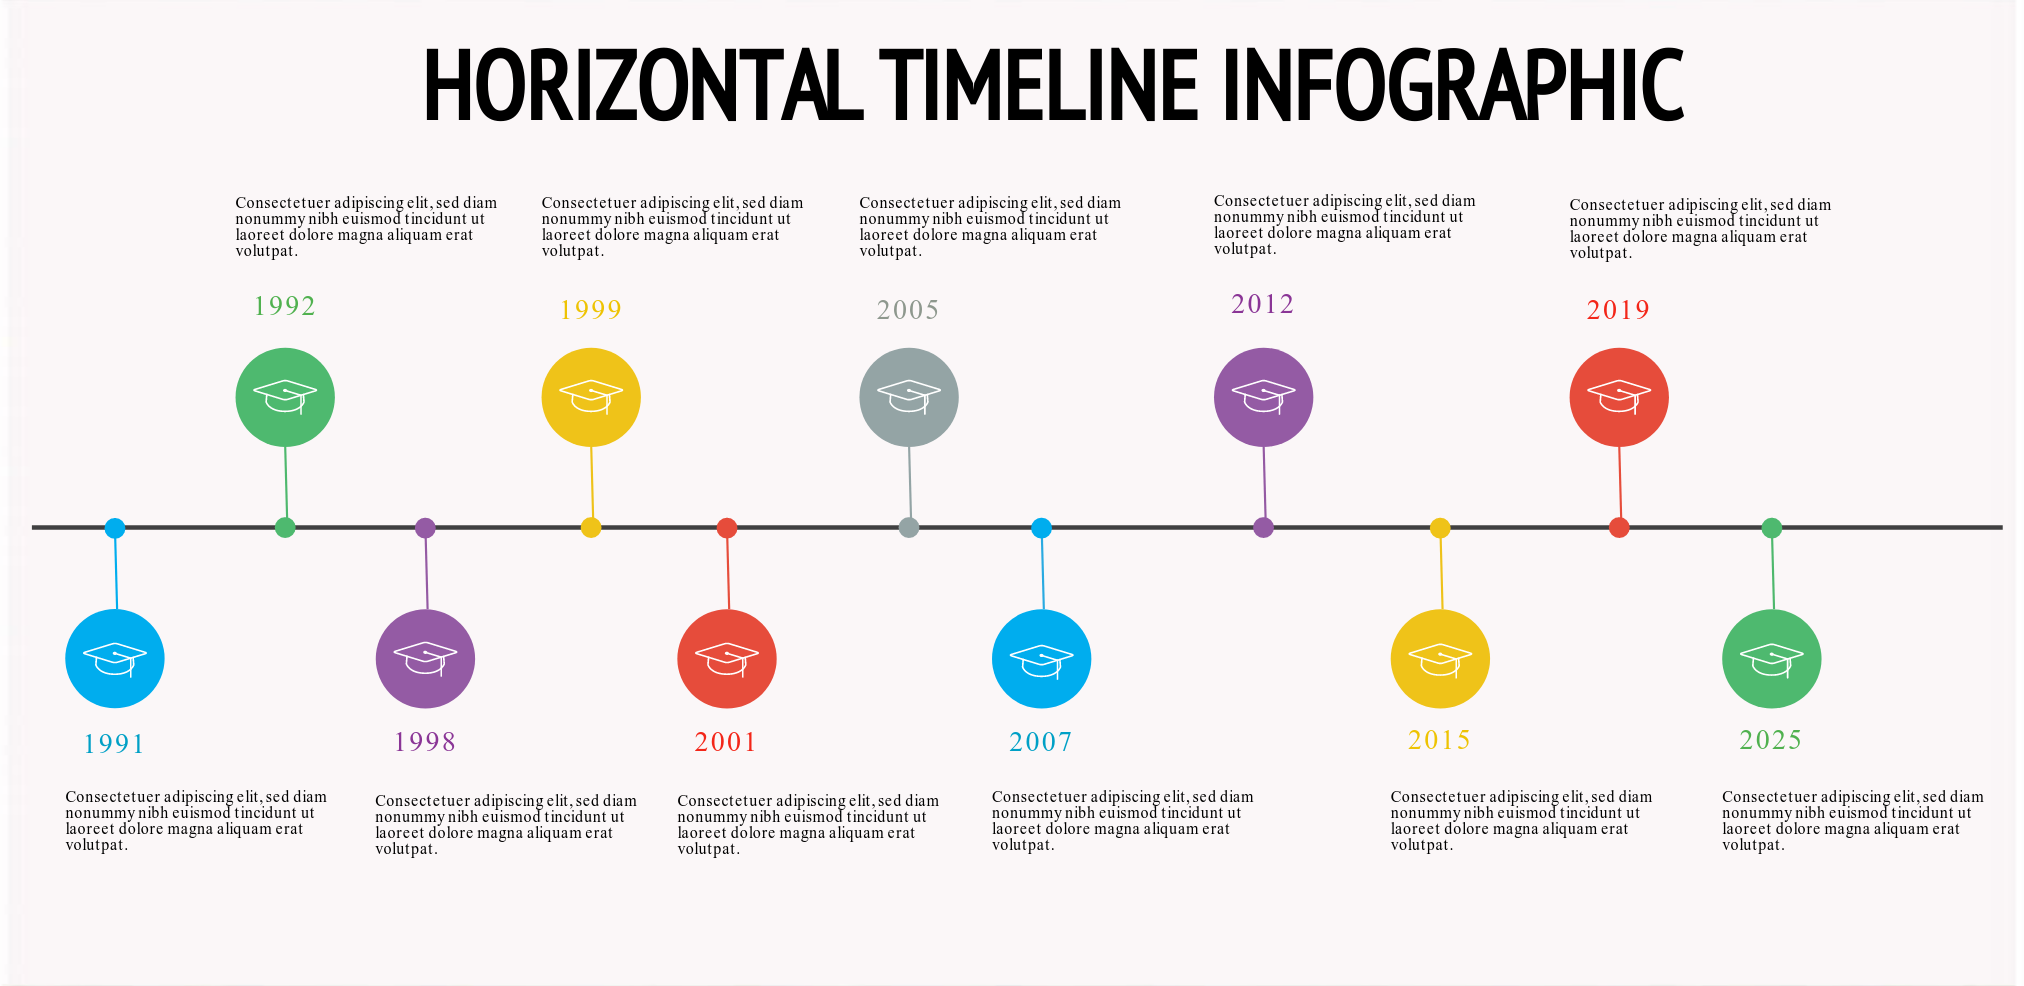
Horizontal timeline template
Take your audience back in time with this horizontal high quality template.
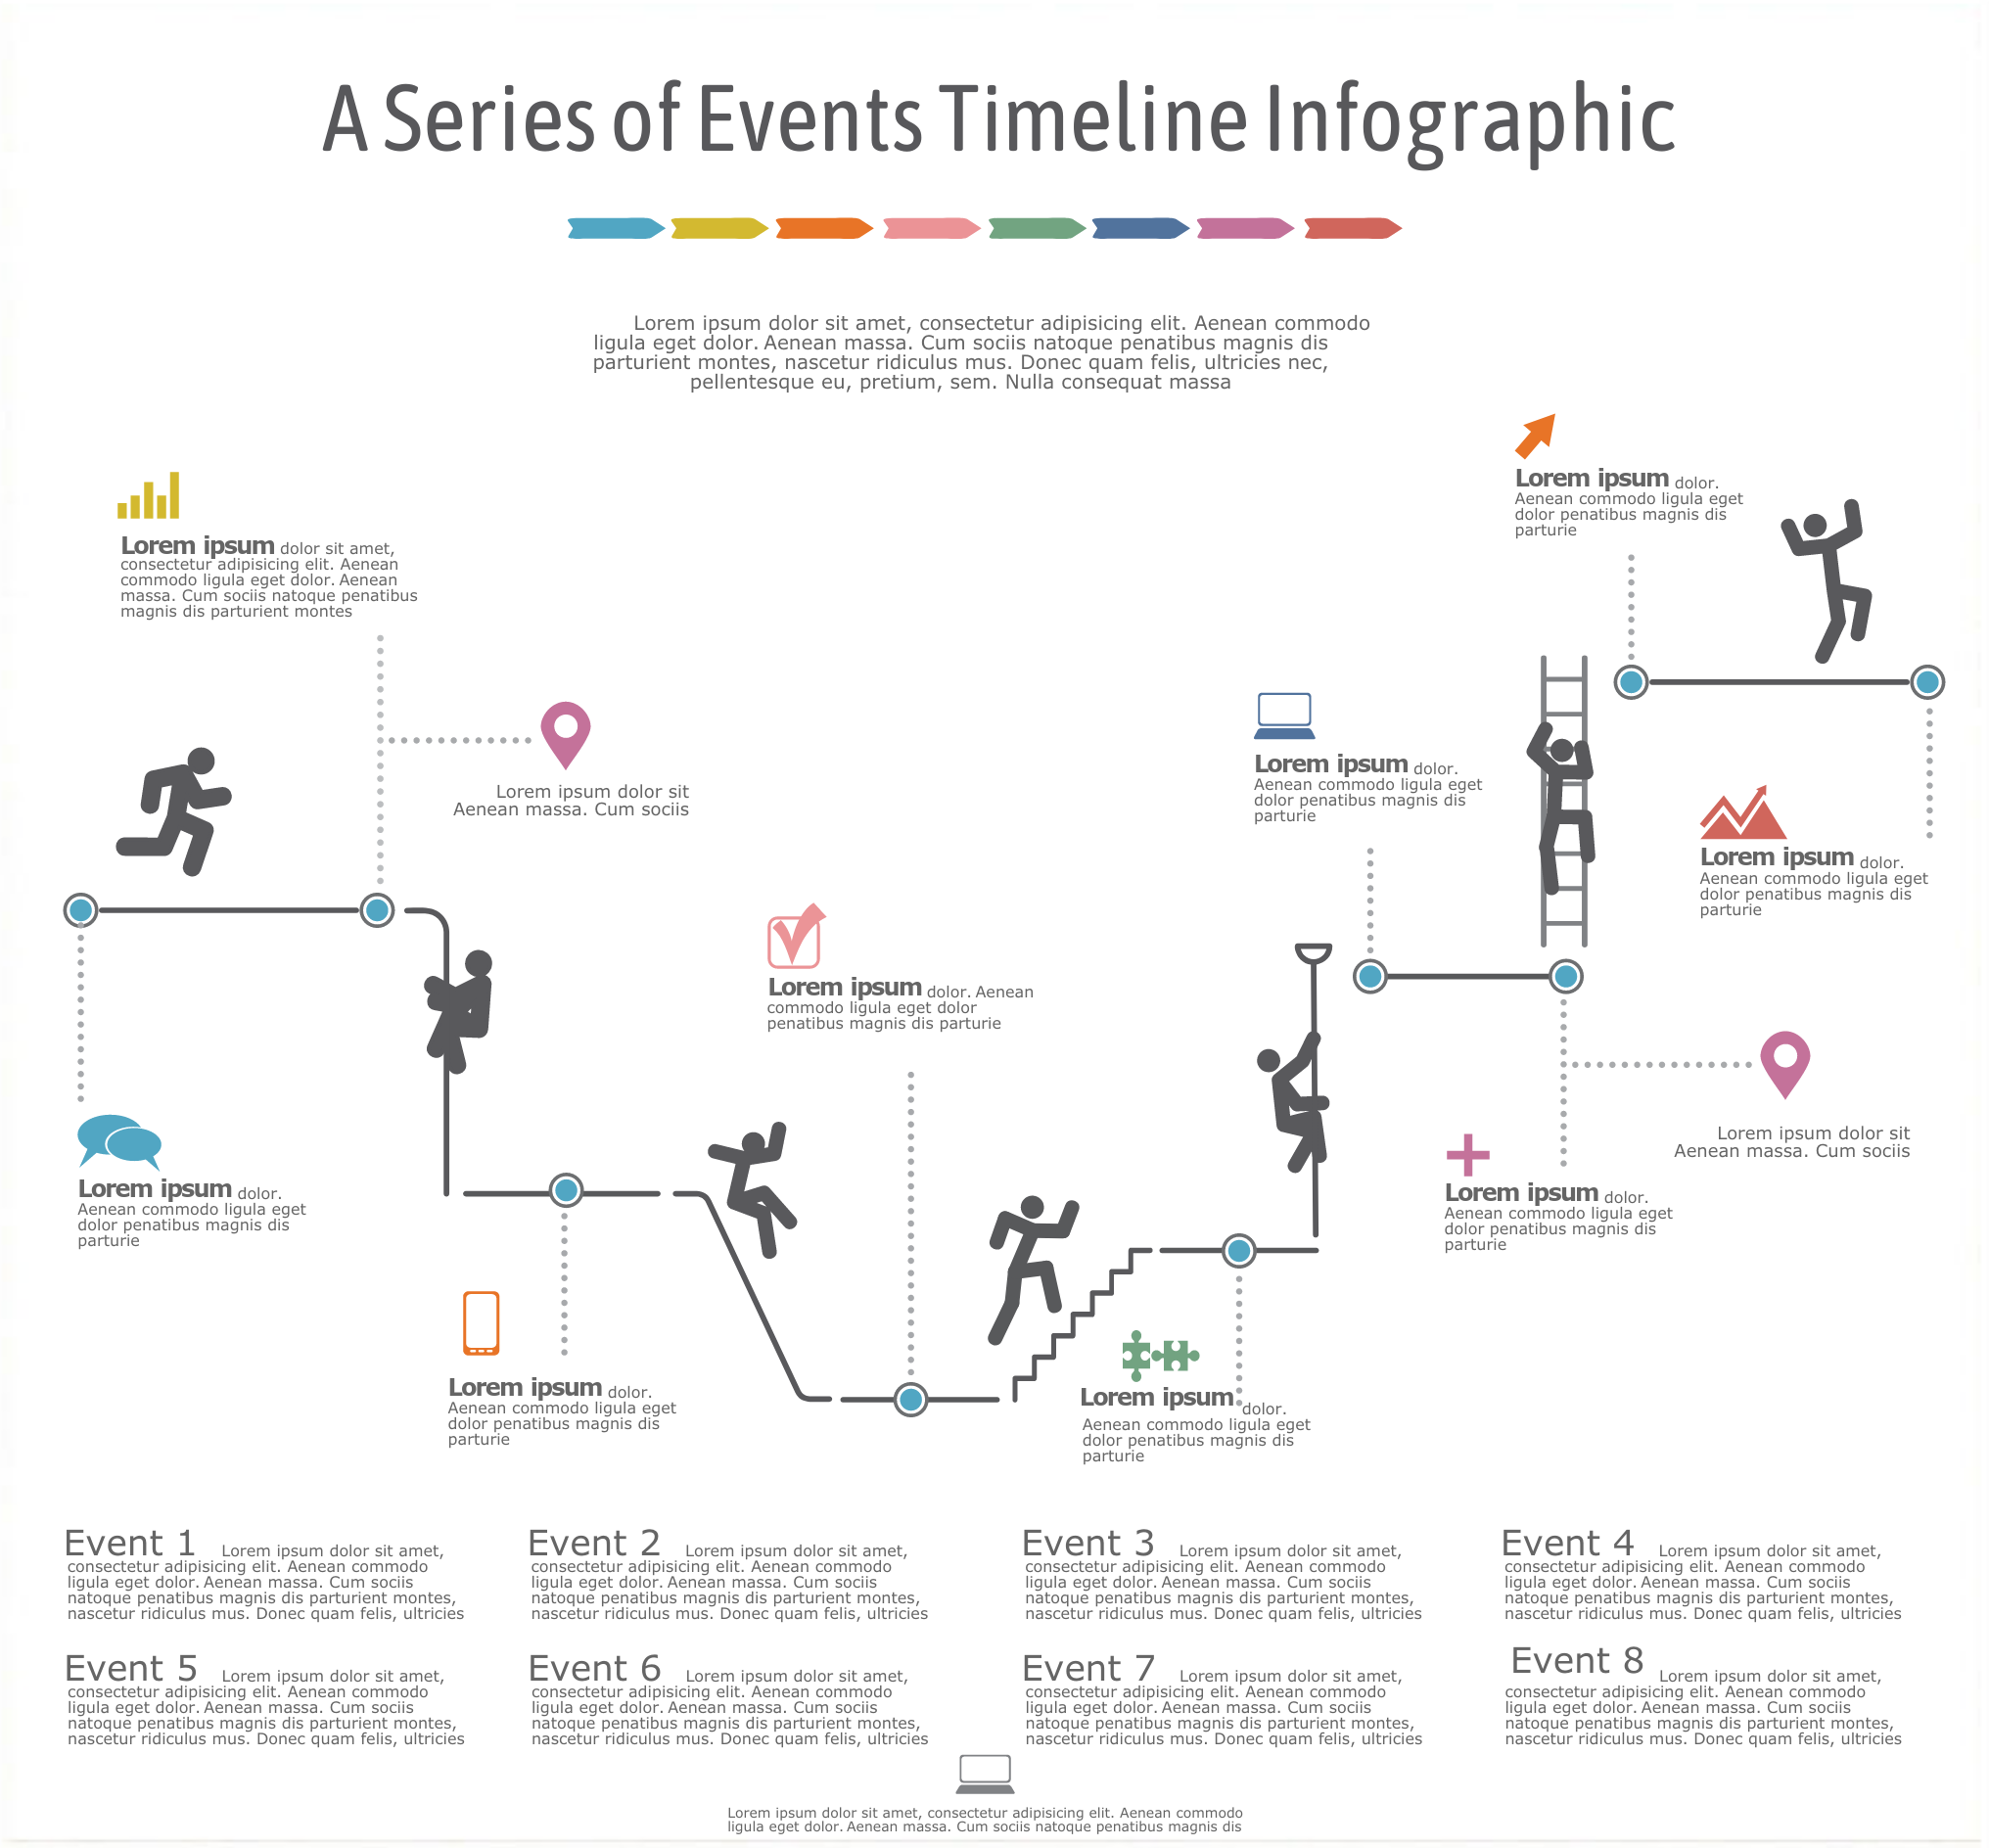
Series of events infographic template
Paint a vivid picture of an event and share blow-by-blow account information with this template with emphasis on a series of events.
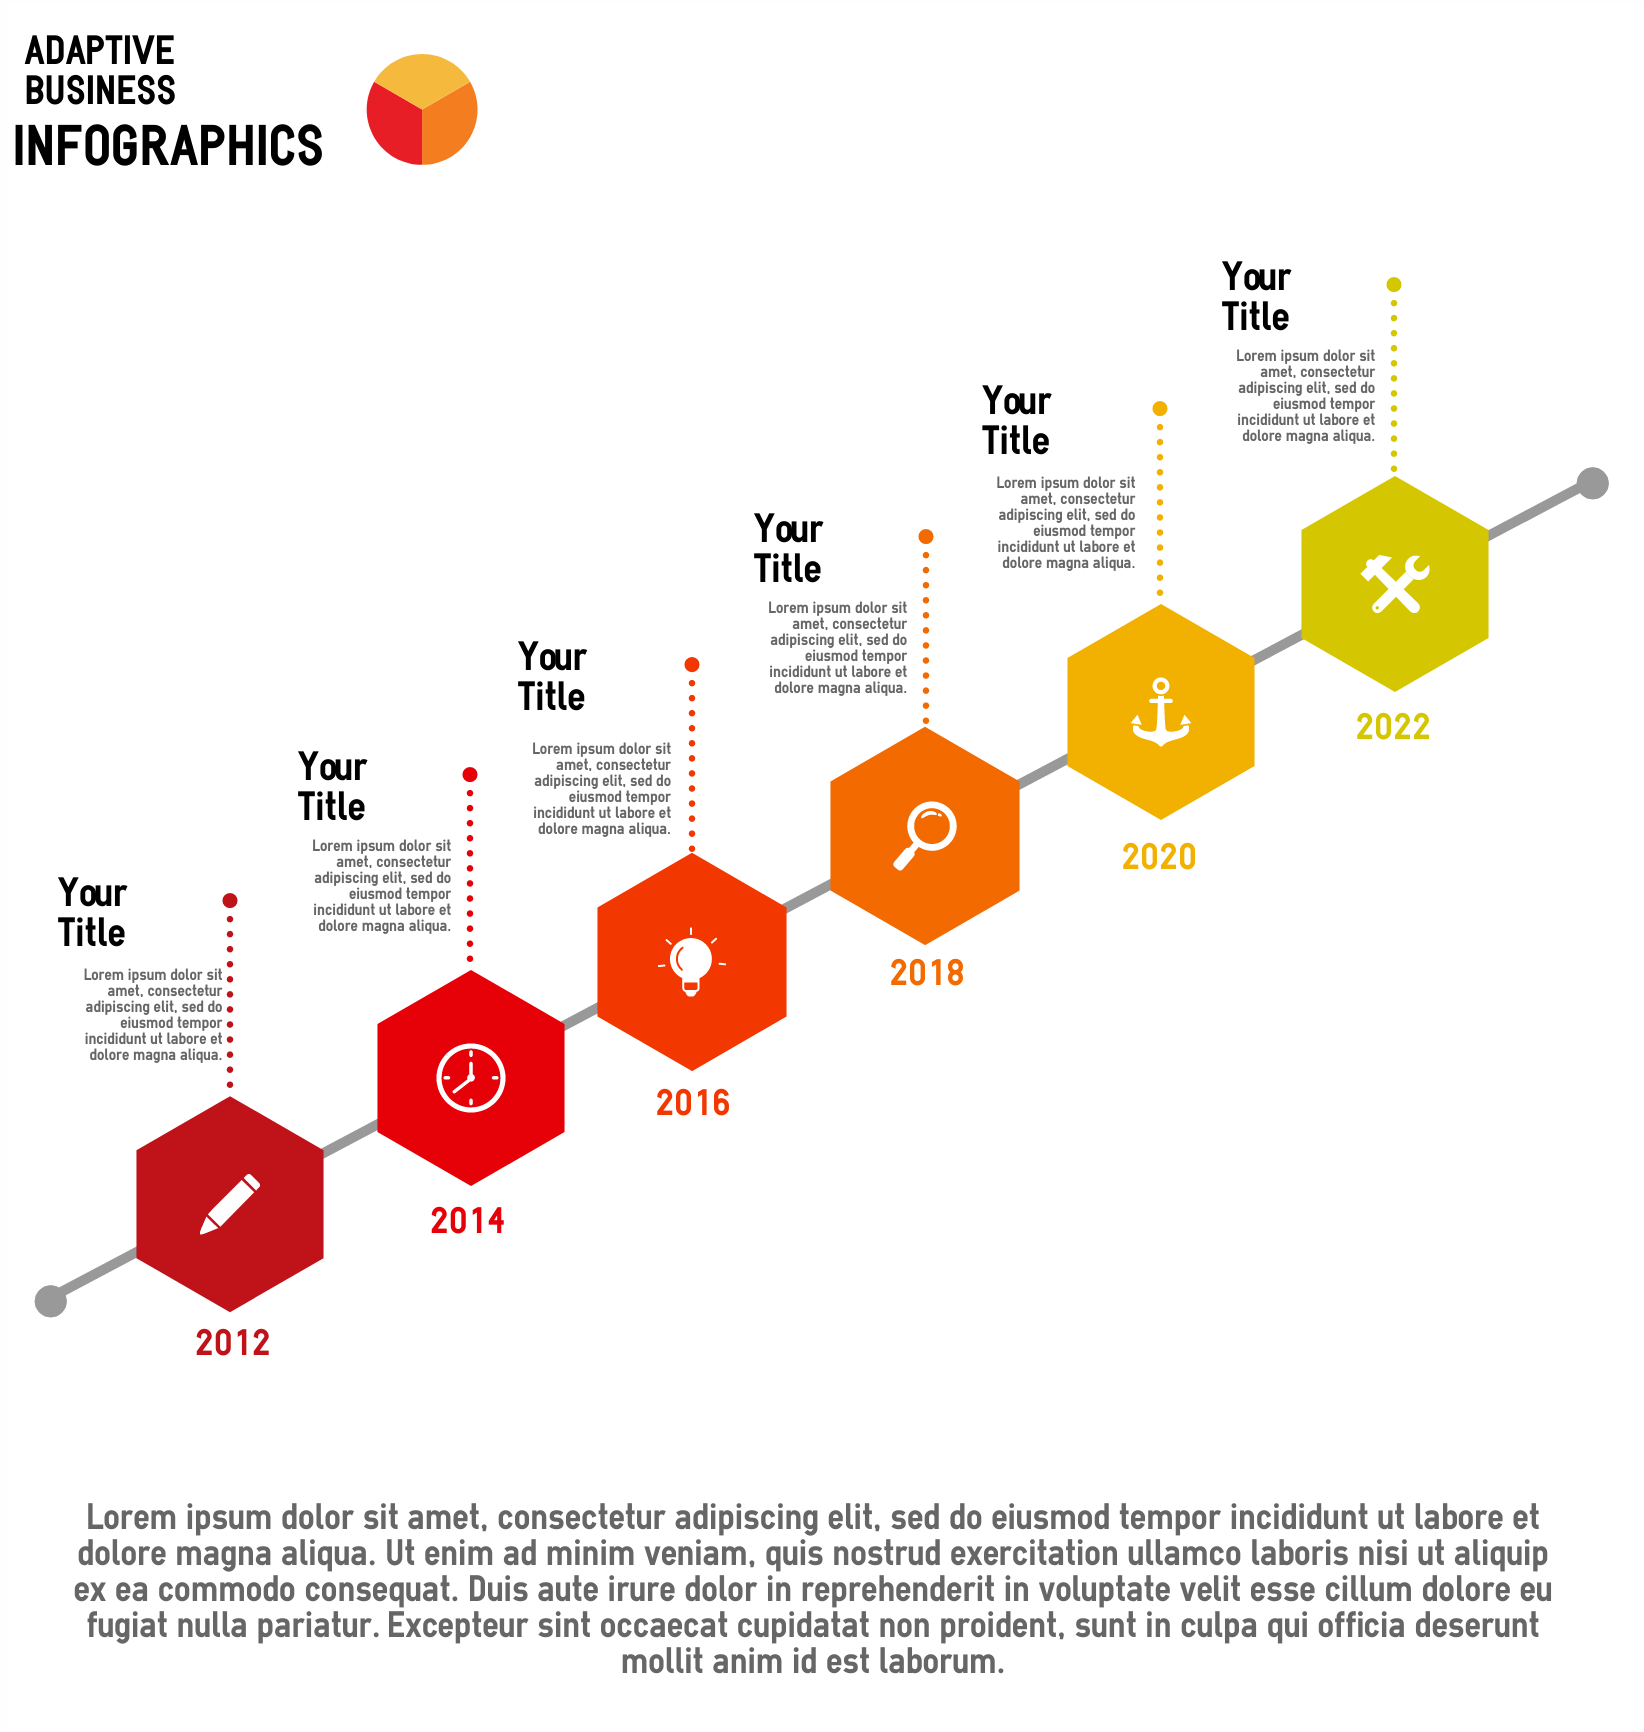
Upward infographic template
Customize this template if you prefer to highlight an upward trend in your timeline.
Flag timeline infographic template
Customize font colors, sizes, and objects in this template. As a result, you get an infographic that is unique and appealing to your target audience.
Project timeline infographic template
Managing multiple projects doesn’t have to be overwhelming if you use this project template. Keep everyone on the loop with their tasks as well as your monthly/weekly deliverables.
Wrapping up
You’re now ready to customize your timeline infographic template with your information and design preferences!
Play with your infographic colors, add pictograms, experiment with your fonts, and keep your infographic content to the point.
Watch the short video tutorial below for some tips on how to customize your infographic template with Easelly.
Do you have another timeline infographic in mind and you want it done from scratch? Collaborate with one of our infographic design pros and get it within 24-48 hours.
Alternatively, make your timeline visuals come to life with animated infographics!