
Science unveils a whole new frontier of discovery for kids and adults alike!
From different dinosaur species who used to roam the earth to the wonders of the bacterial universe inside your gut, science helps us understand the world better.
But with too many information channels these days, it can be overwhelming to find a medium that will help you engage students with science lessons quickly and effectively.
Make science fun and engaging with data visualization and infographics
Science infographics are a great tool to showcase scientific facts and interesting bits of data.
Make your science lessons stand out with graphs and charts that will help your audience quickly make the connection between two or more data points. You can also add pictures, icons, or illustrations that best represents your idea.
What if you don’t have enought time to learn about making infographics from scratch?
Use infographic templates!
With infographic templates, you can simplify complex scientific concepts quickly.
Plus, it’s easier to customize your infographic colors, icons, fonts, and backgrounds. Before you know it, your science infographic is good to go!
Here are 10 ways to jazz up your science classroom (virtual or physical!) with infographics and data visualization.
1. Design your own science poster for the classroom.
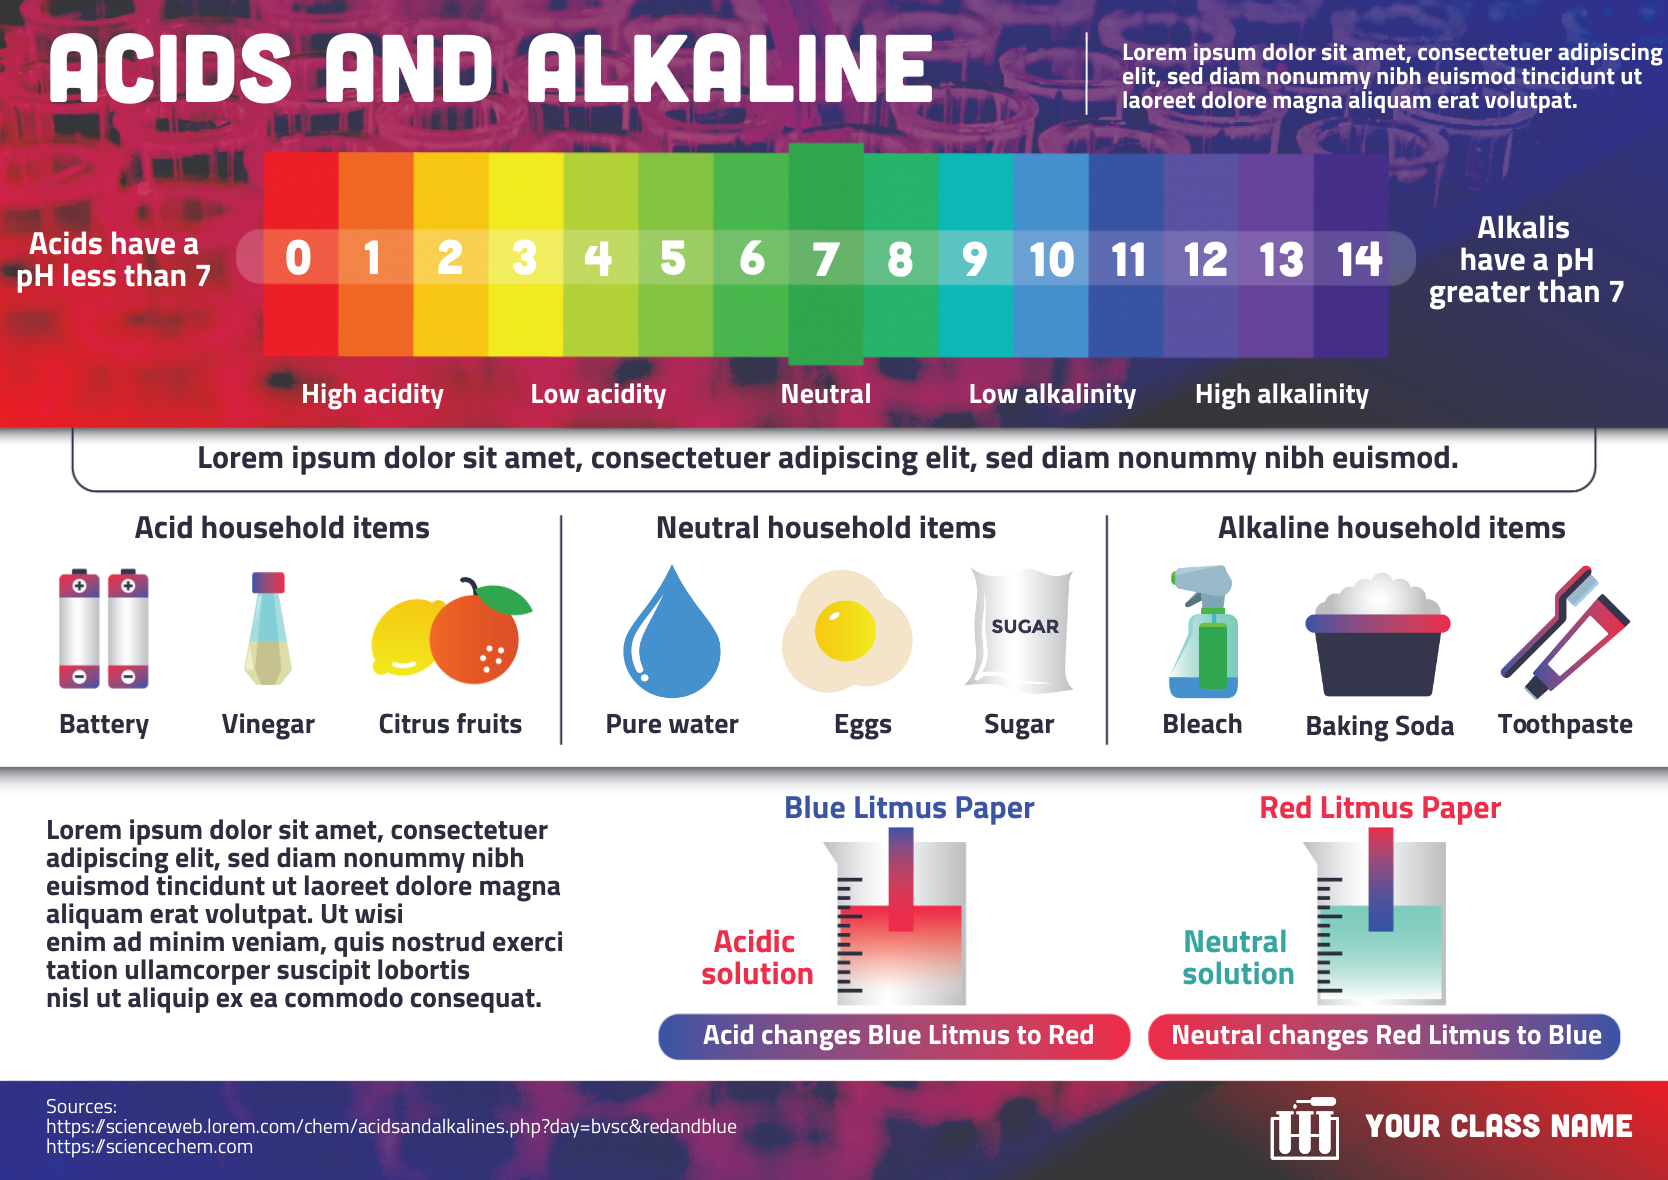
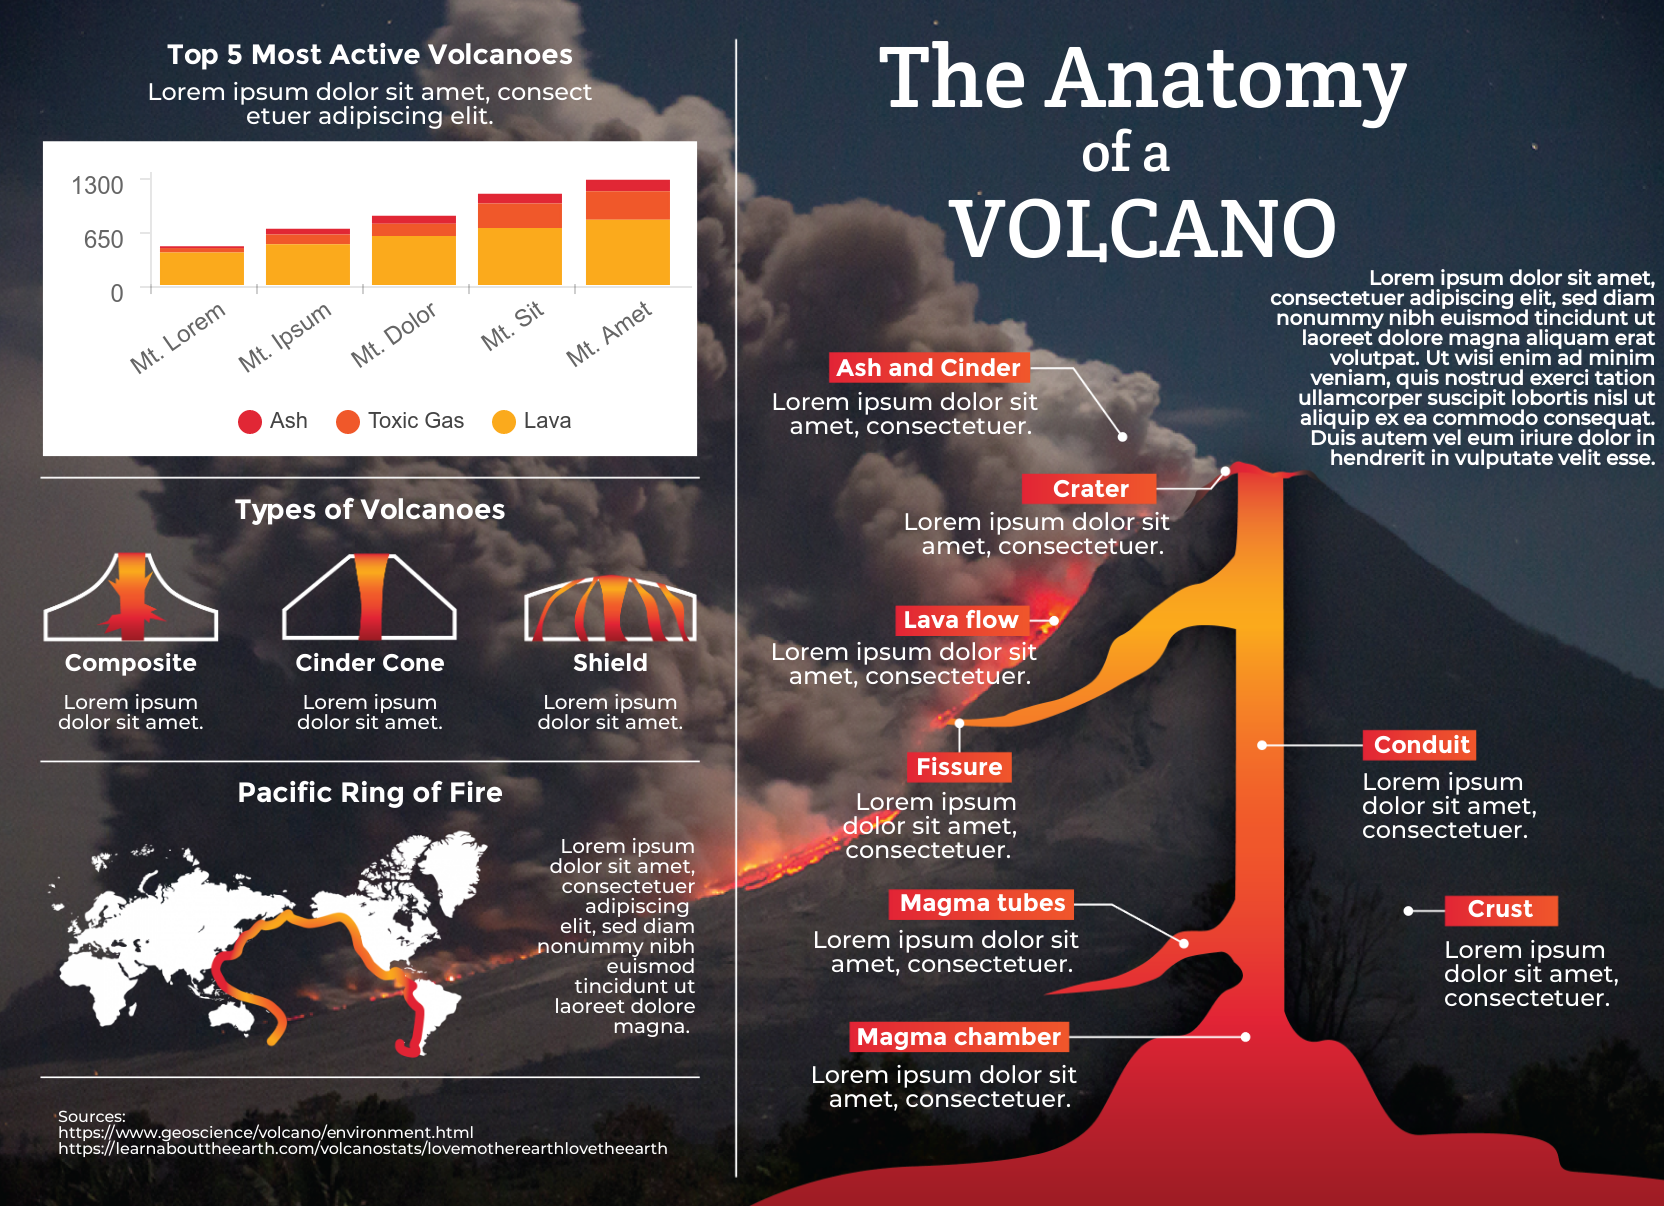
2. Use photos or diagrams combined with short facts to make complicated concepts easier to understand.
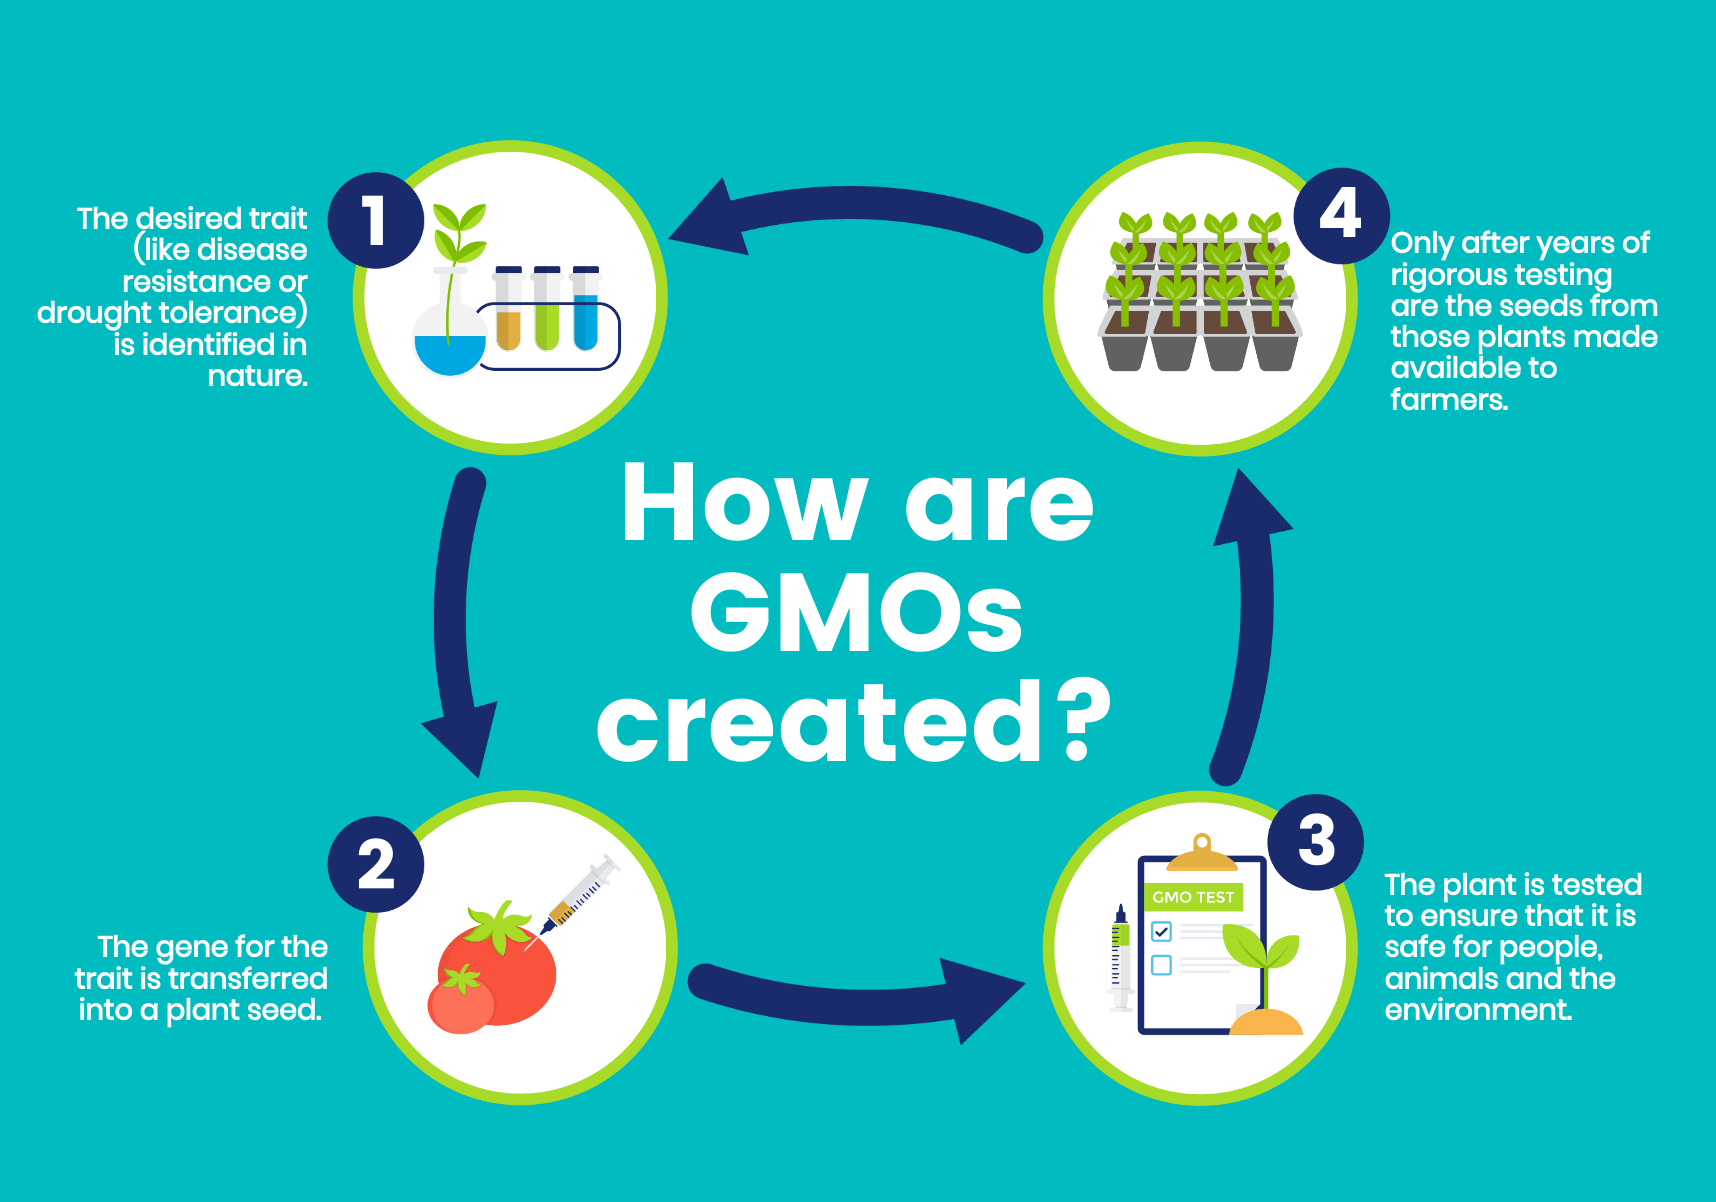
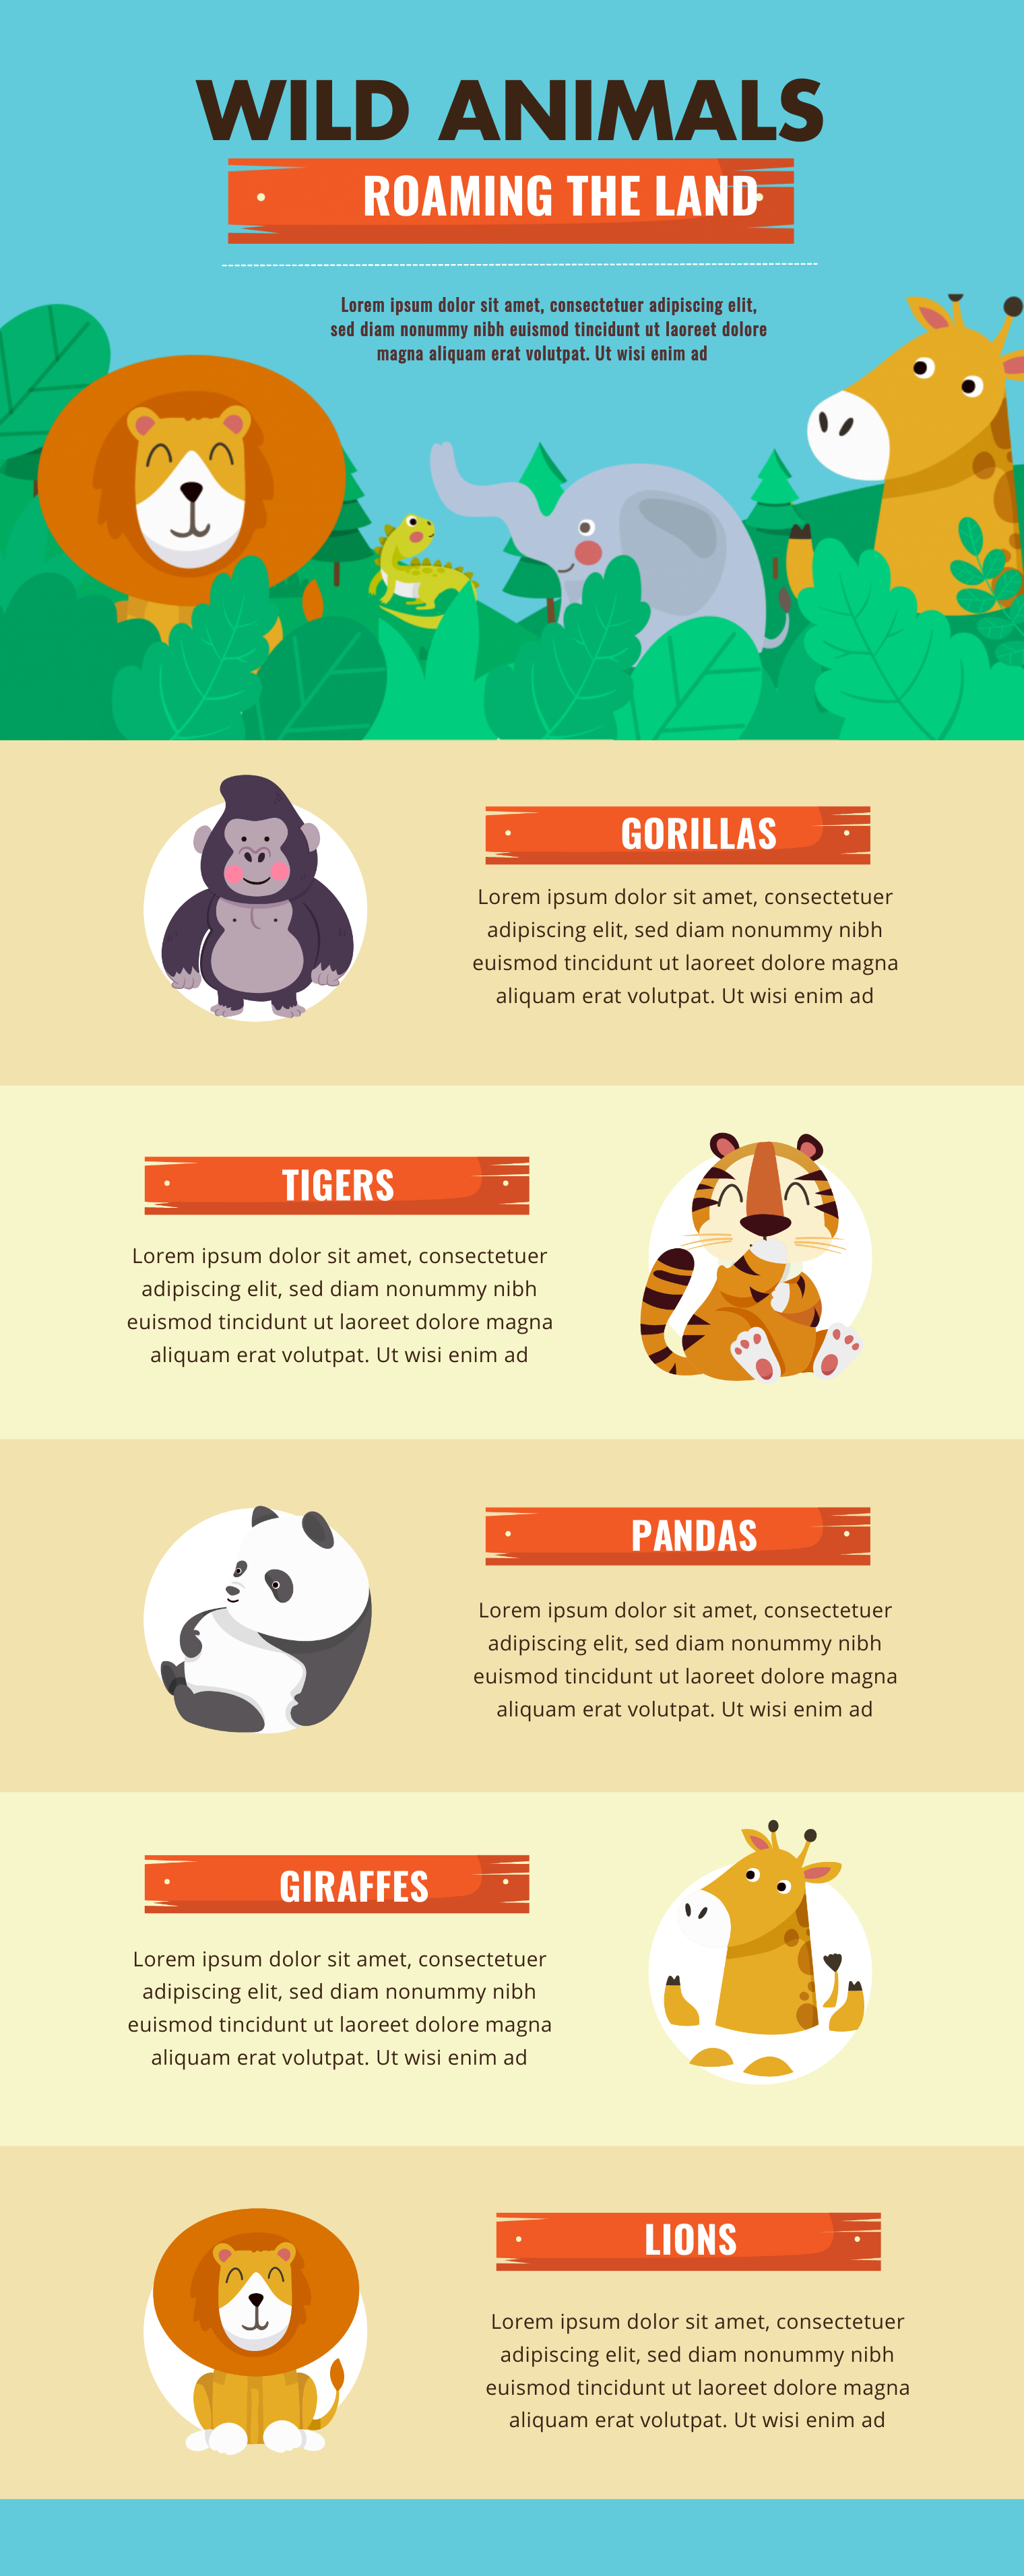
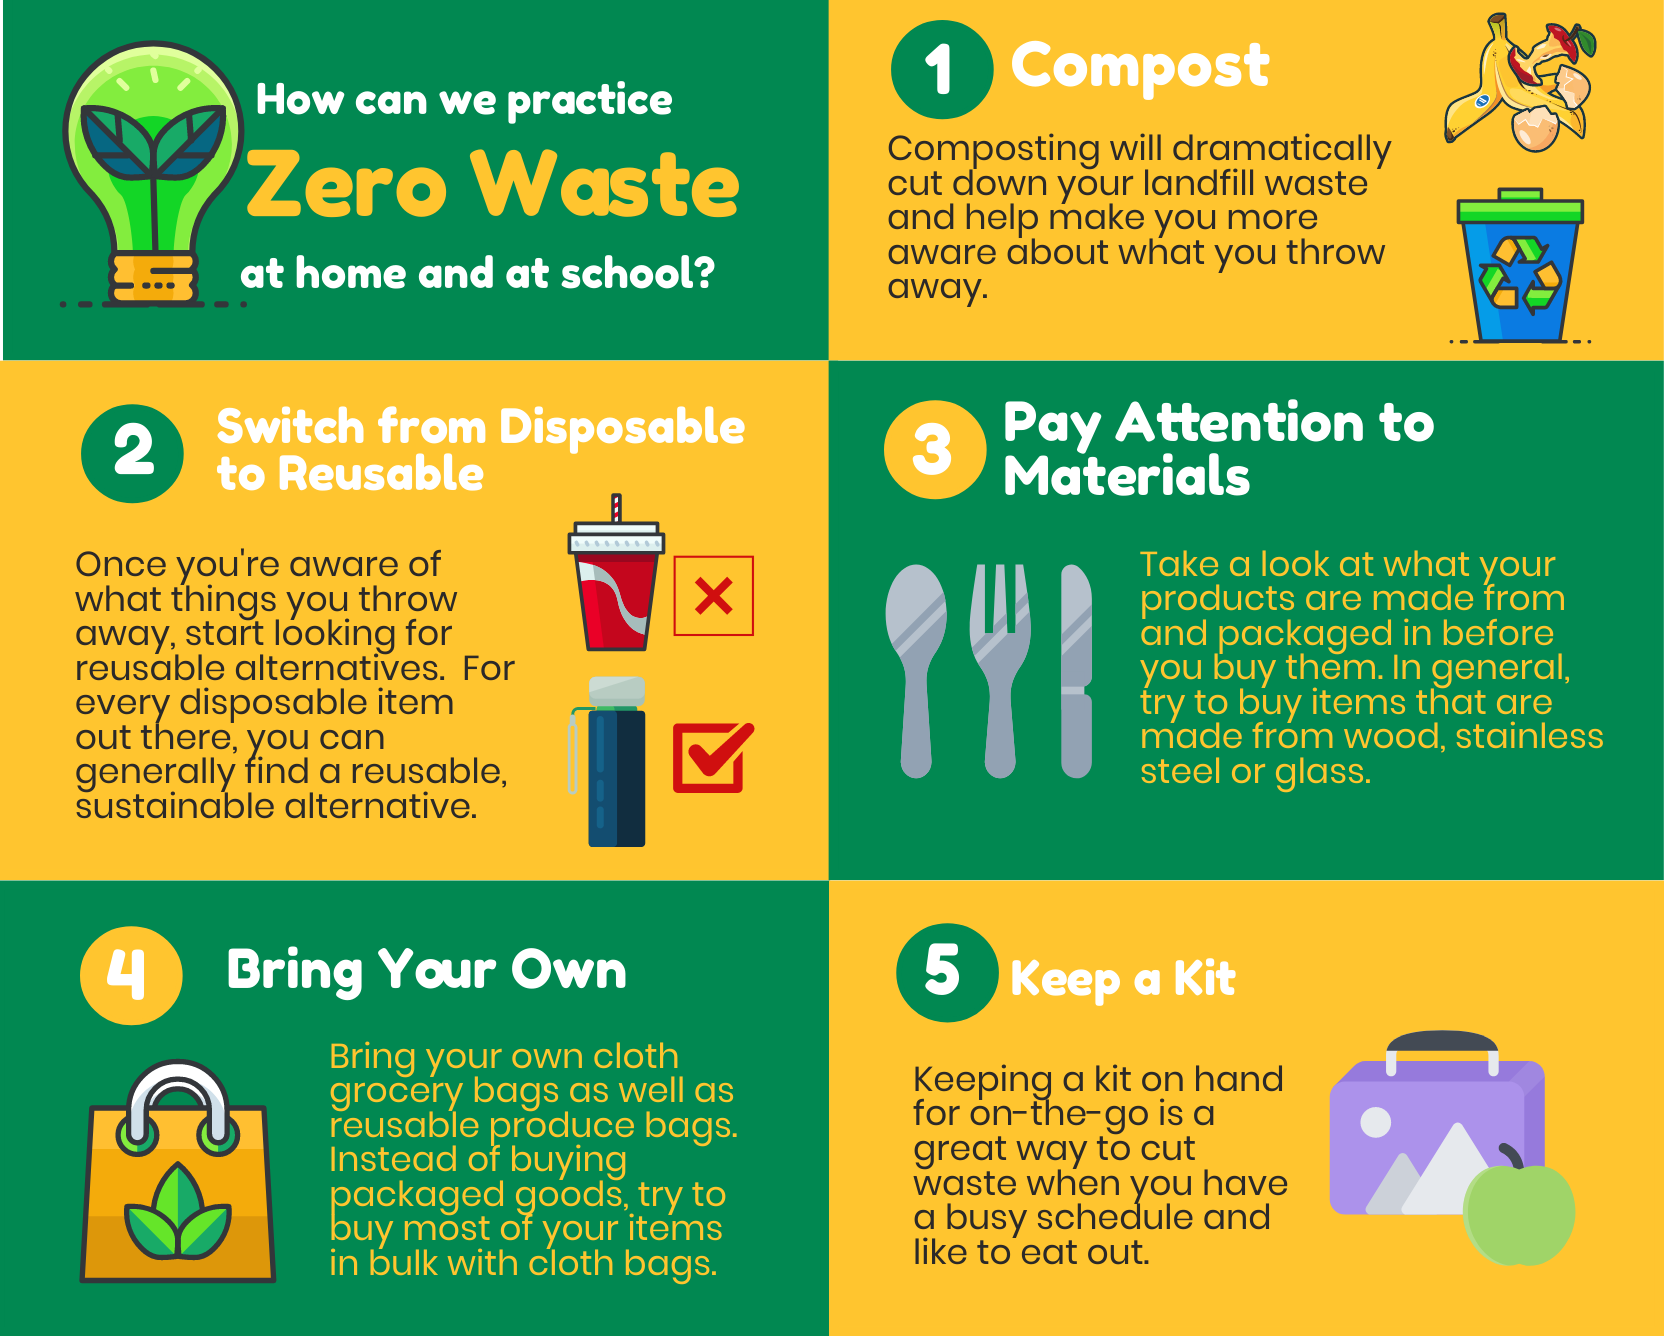
3. Present your science content with bright colors and cartoon-line images to make it more eye-catching for young, curious learners.
4. Learning science vocabulary is easier to remember when it’s presented visually.
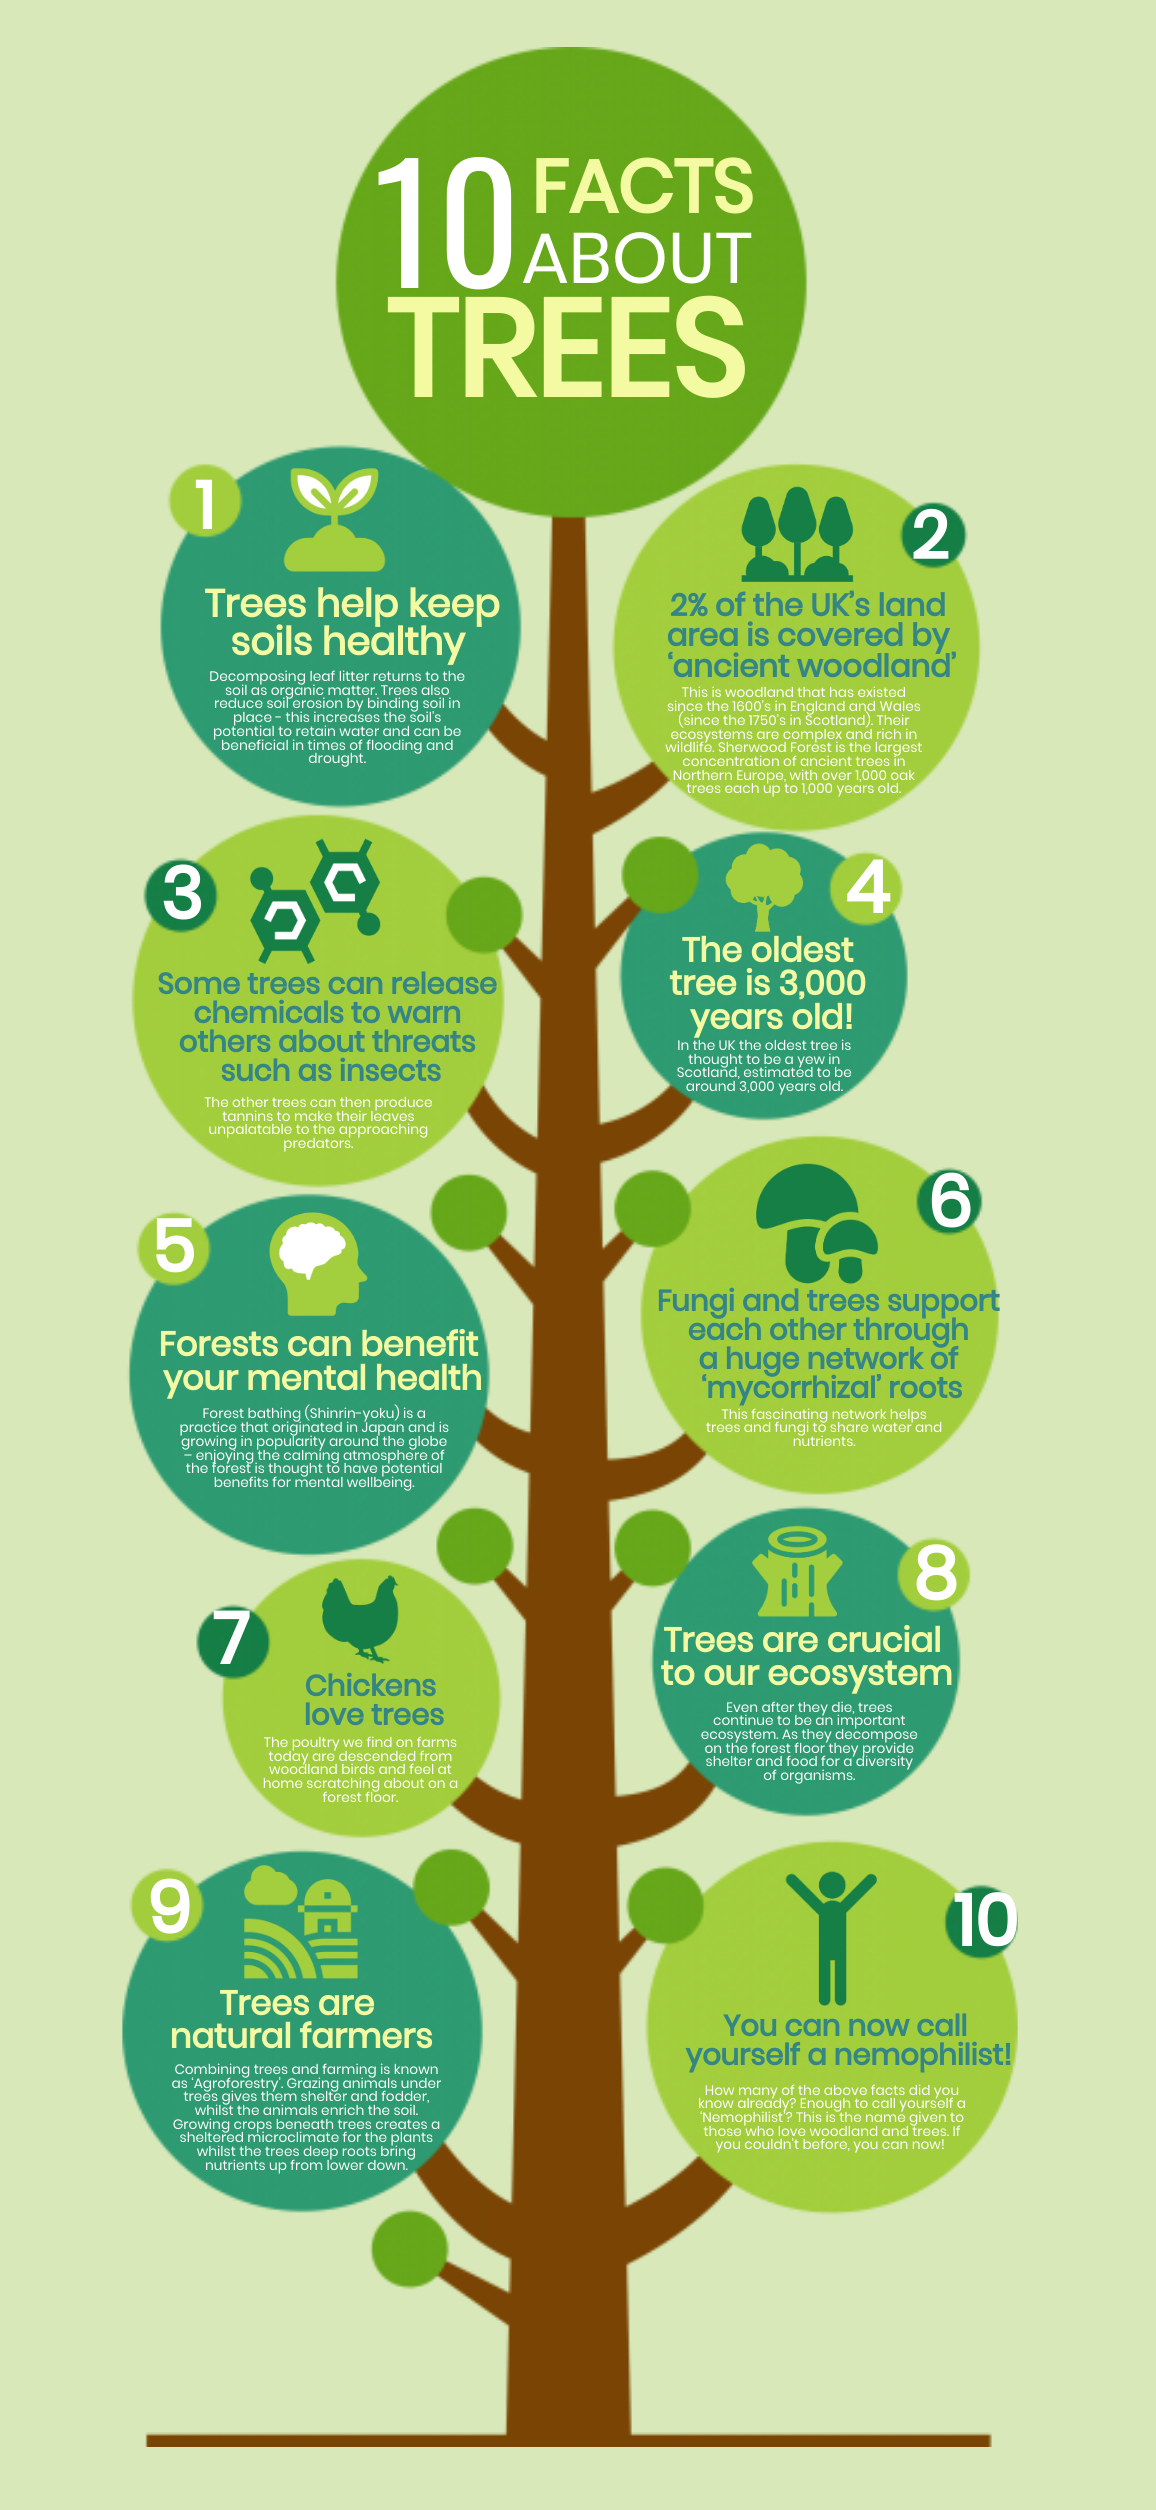
5. Boost awareness of pressing scientific issues by presenting facts with icons and illustrations.
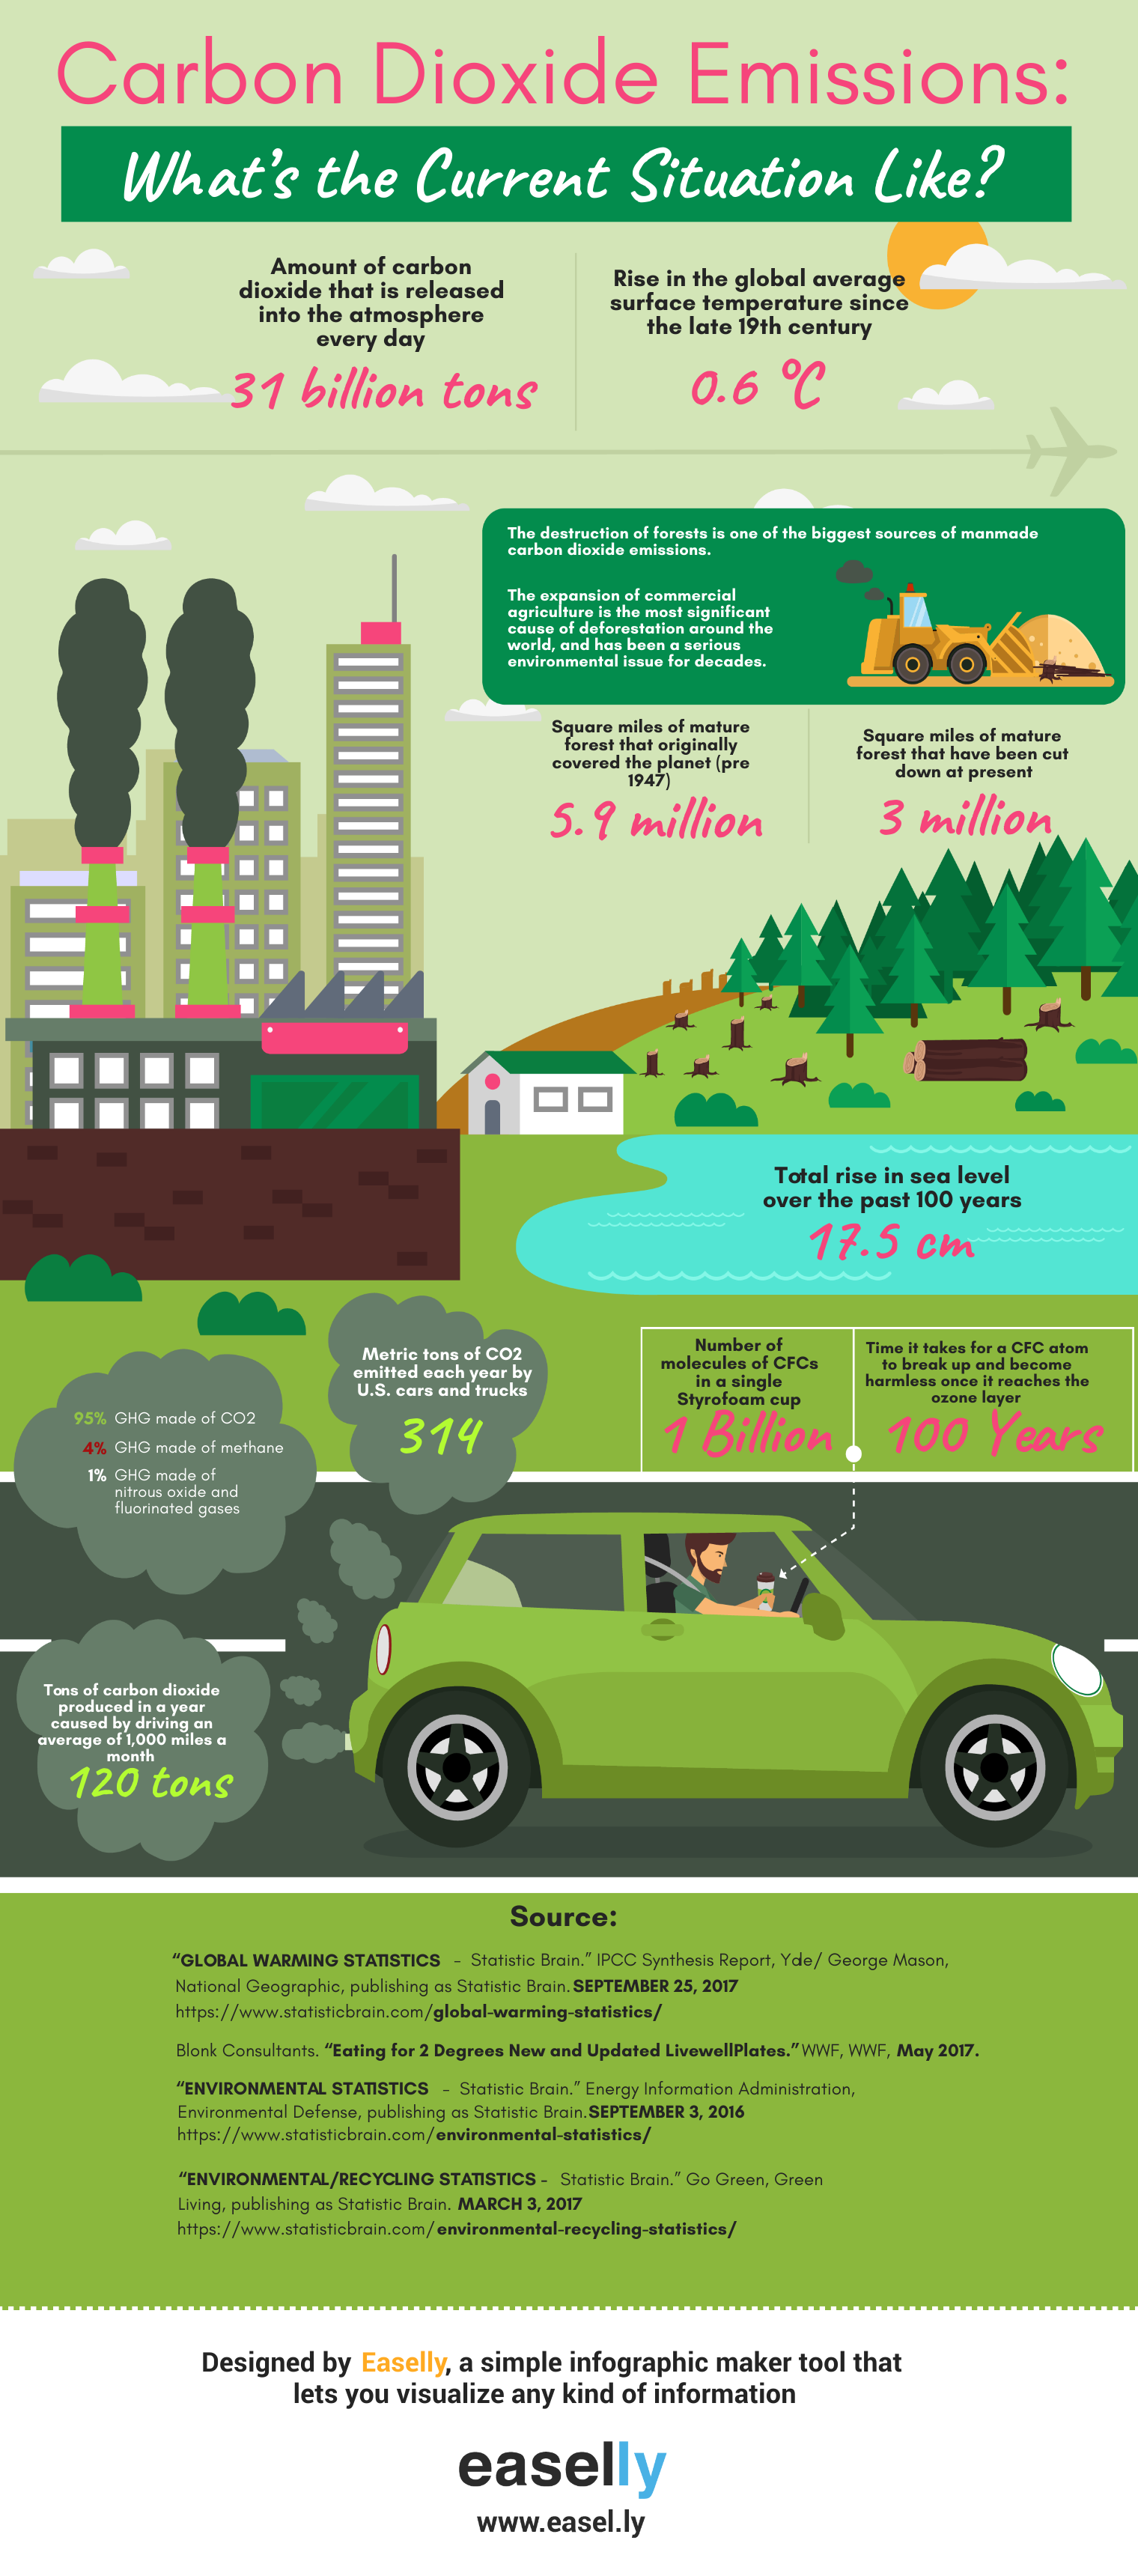
Related Infographic: Do You Know Your Carbon Footprint? A Case Study & Infographics
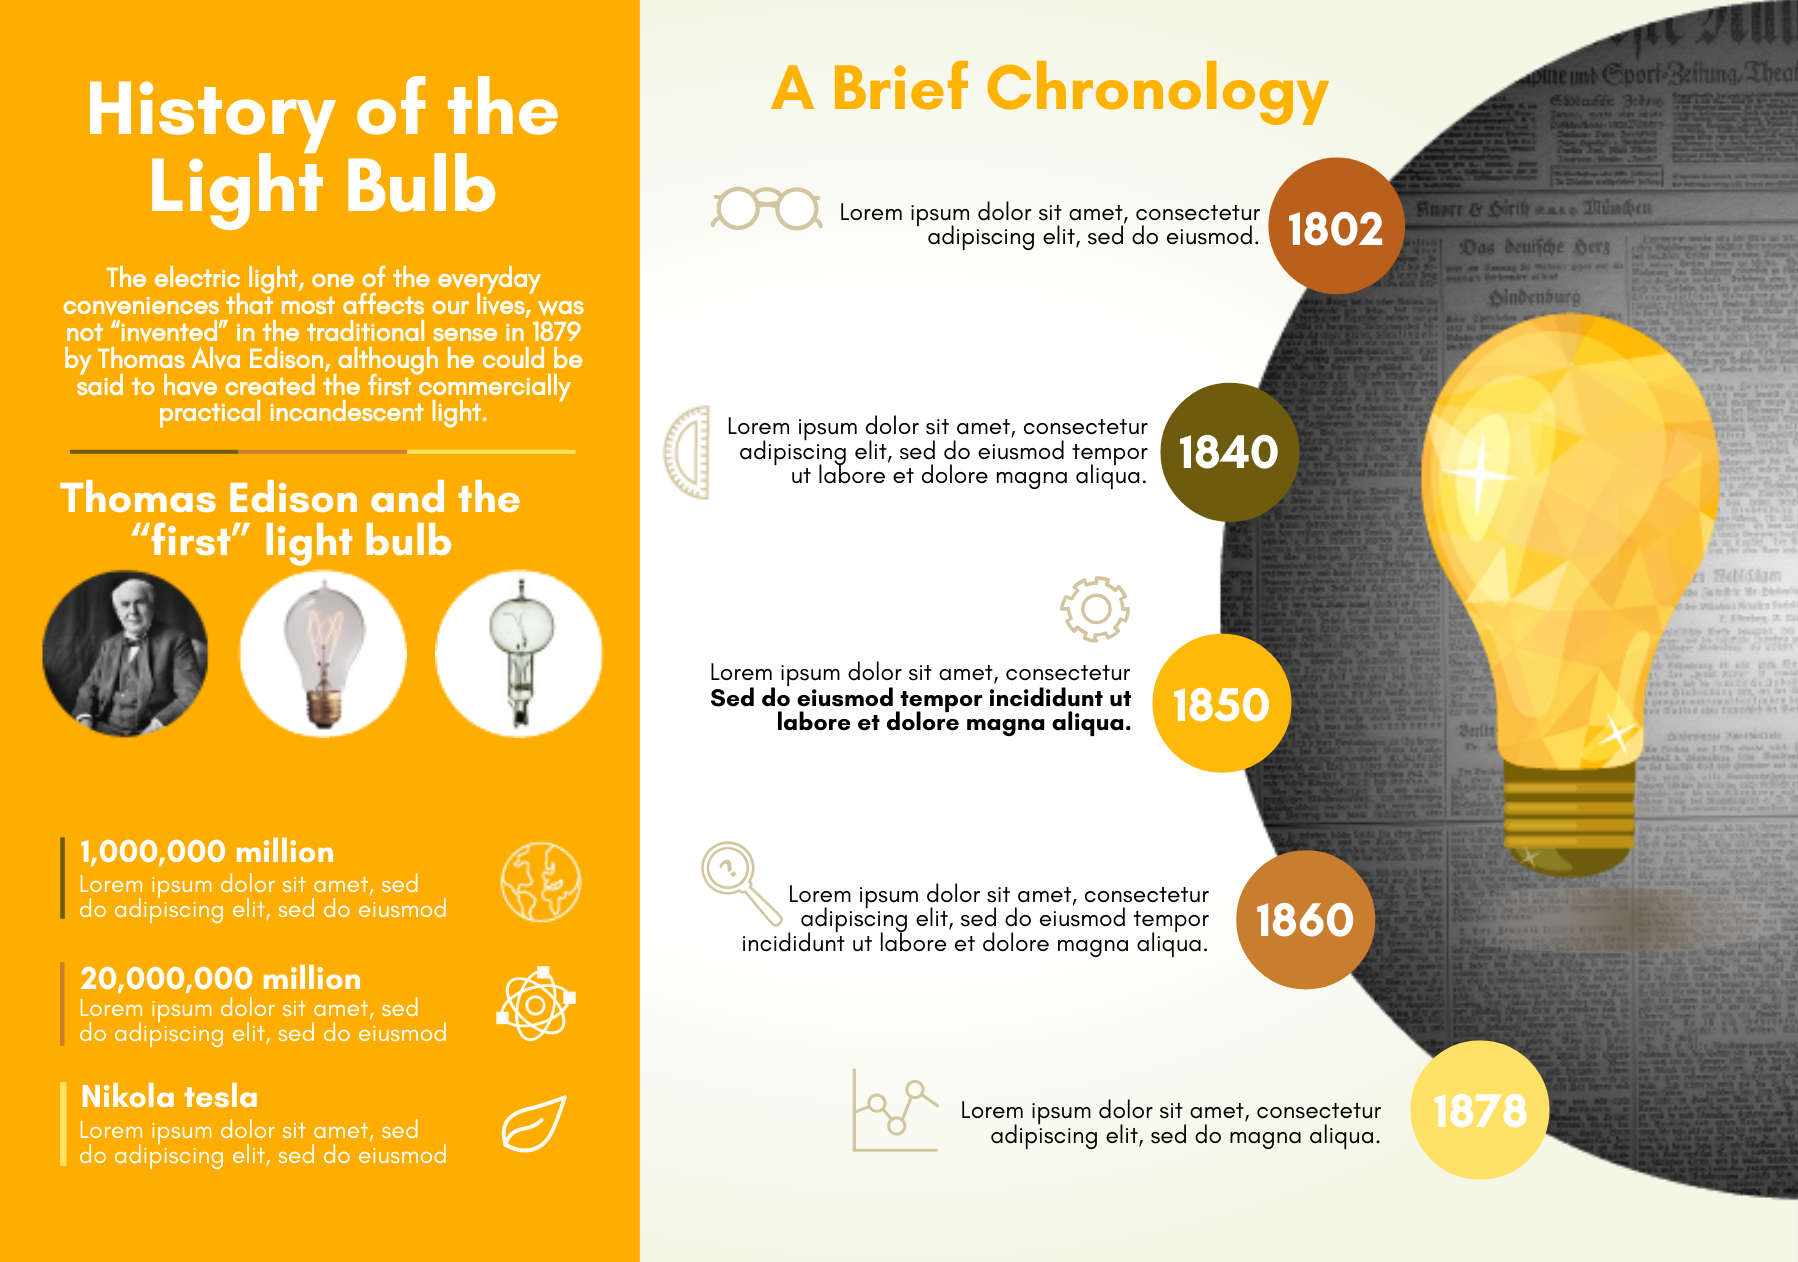
6. Shine a light on important events in the history of science and technology.
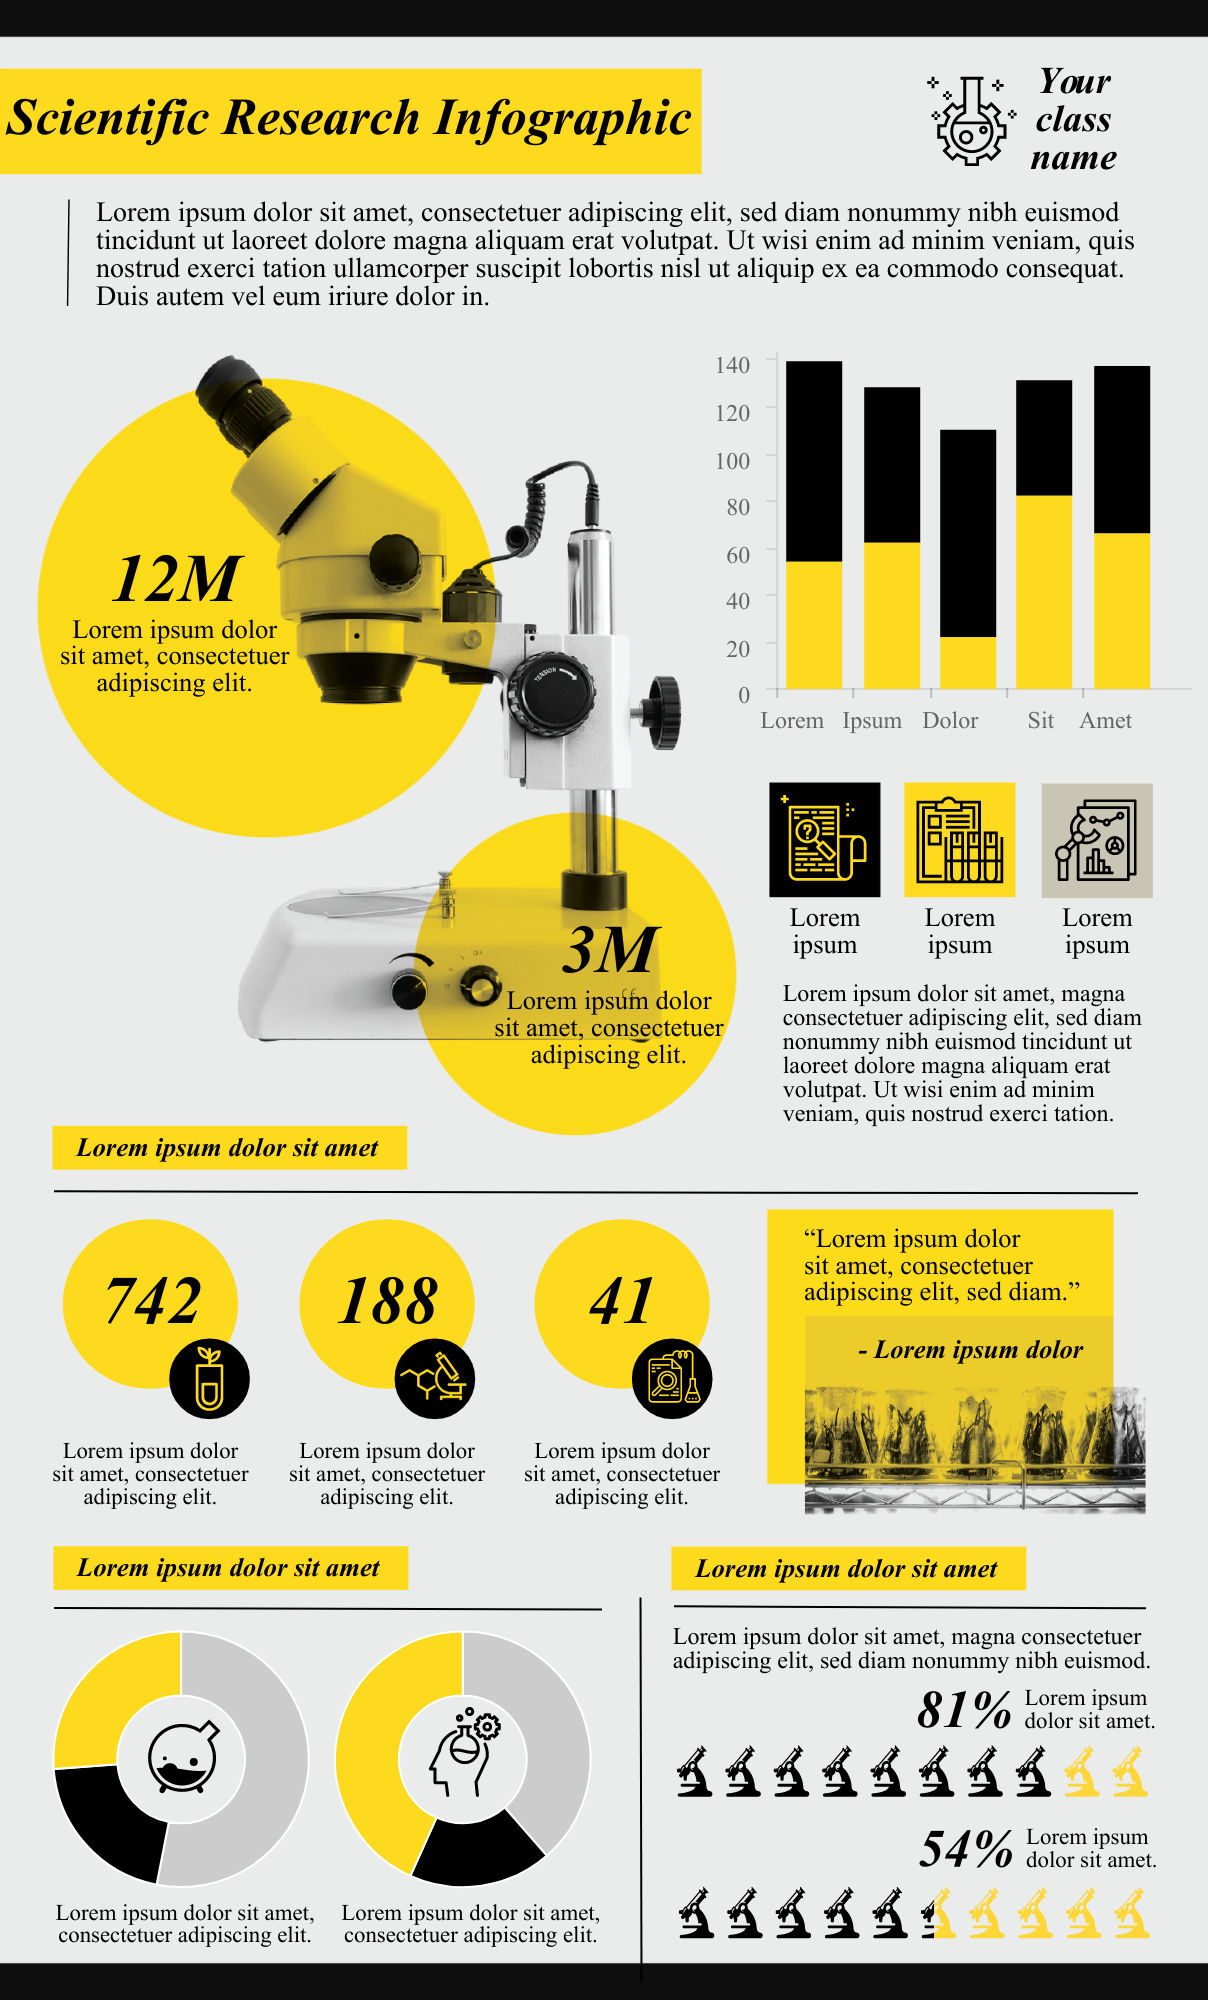
7. Use graphs, charts, and pictograms to help develop pattern recognition and trend analysis amongst students.
8. Advocate for problem-based learning and help students solve real-world problems.
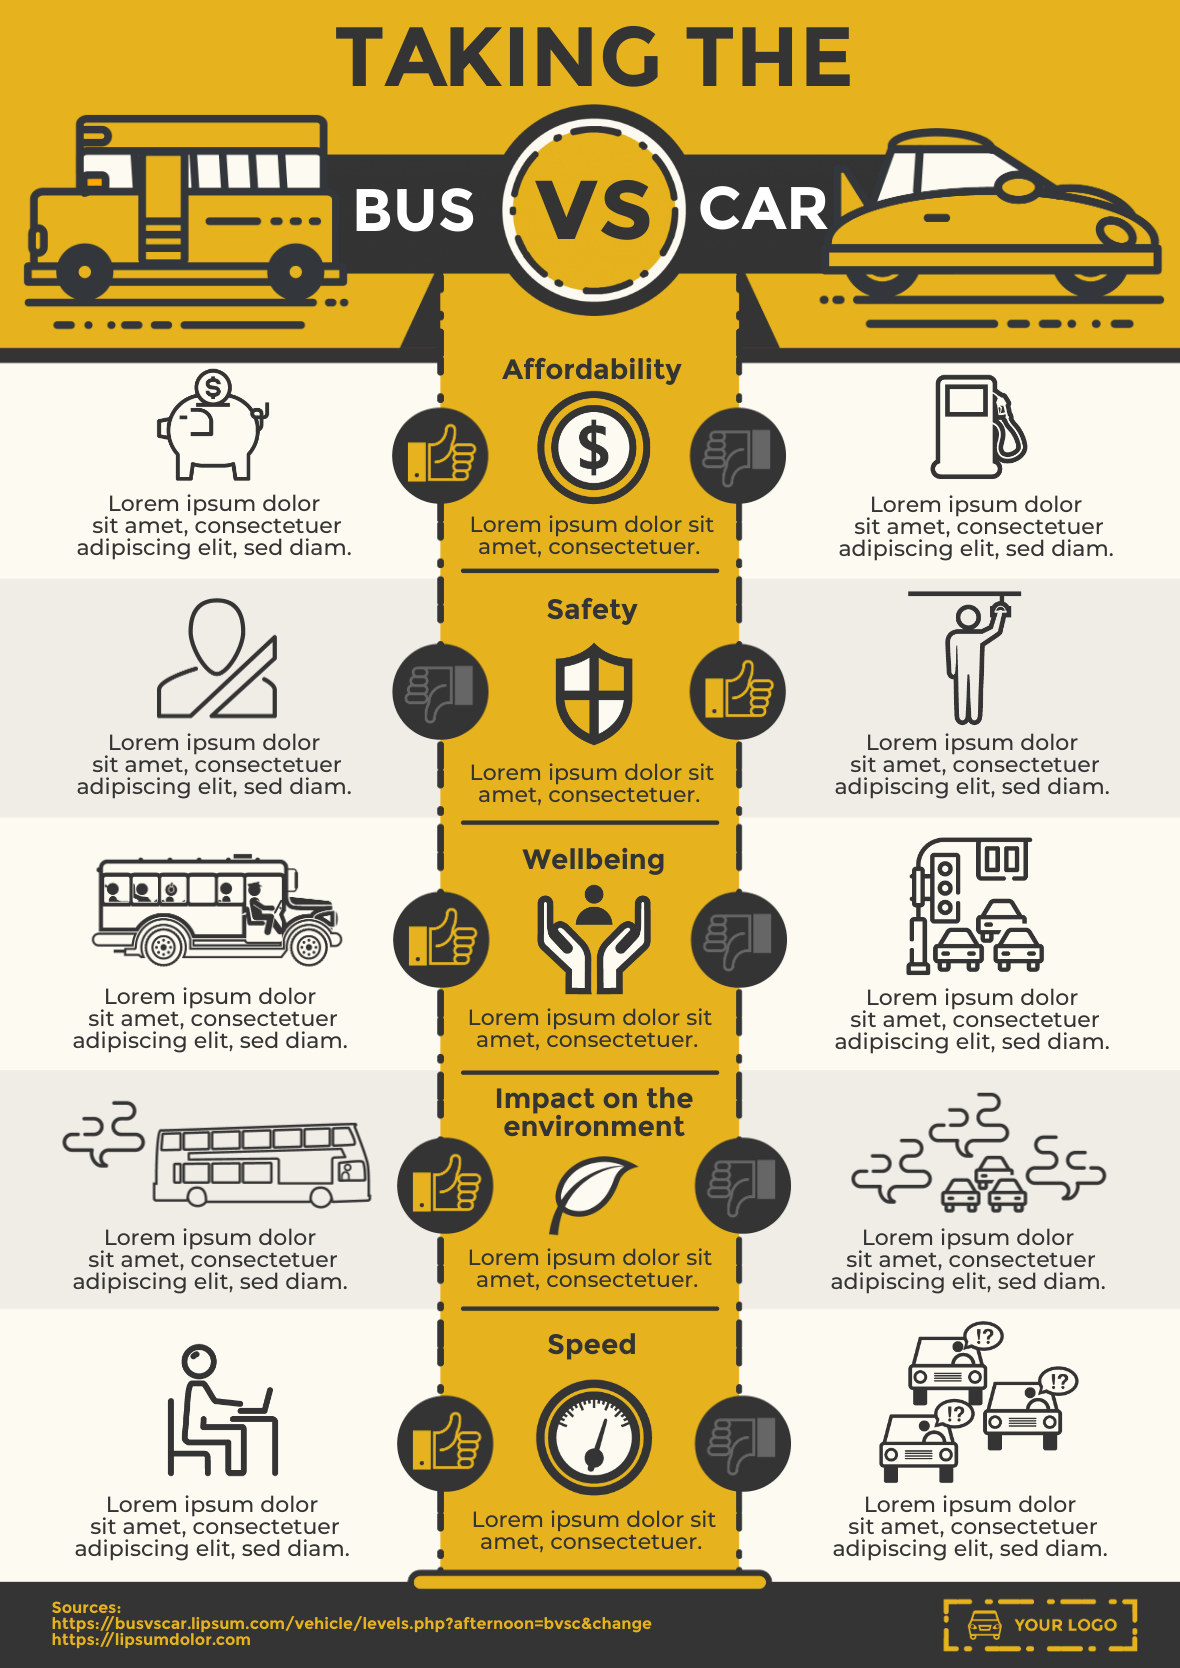
9. Make a comparison infographic in class to explain the differences or similarities between two opposite ideas or theories.
10. Have students use infographics to present a report in class.
Does reliance on templates stifle creativity?
At Easelly, we believe that limitations such as the science infographic templates we featured can help boost creativity.
Making something new despite the lack of resources and time is a creative act in itself!
If you prefer to start your science infographic with a clean slate, you can either make one with our infographic maker tool or ask our infographic design pros to make one for you.
Recommendations for further reading:
- How to Customize Infographics in Easelly (video tutorial)
- The Complete Infographic Checklist for Your Next Infographic
- How to Create Good, Relevant, and Useful Infographics
*Editor’s Note: This blog post was updated on April 28, 2020 for accuracy, new updates, and comprehensiveness. It was originally published on May 9, 2014.