This semester I’m teaching preparation courses for high school students who want to study science at Uni, and only 3 of those students are girls (in a class of 25!). I asked these girls why were they the only ones to choose this course (is an elective course) and they told me that other girls think science is too hard. Representation matters, and as I am the only woman teaching science at those schools, the principal asked me to give them a little class about women in science. I am making some of the visuals using Easel.ly, this one is about women that have been awarded with the Nobel Prize.
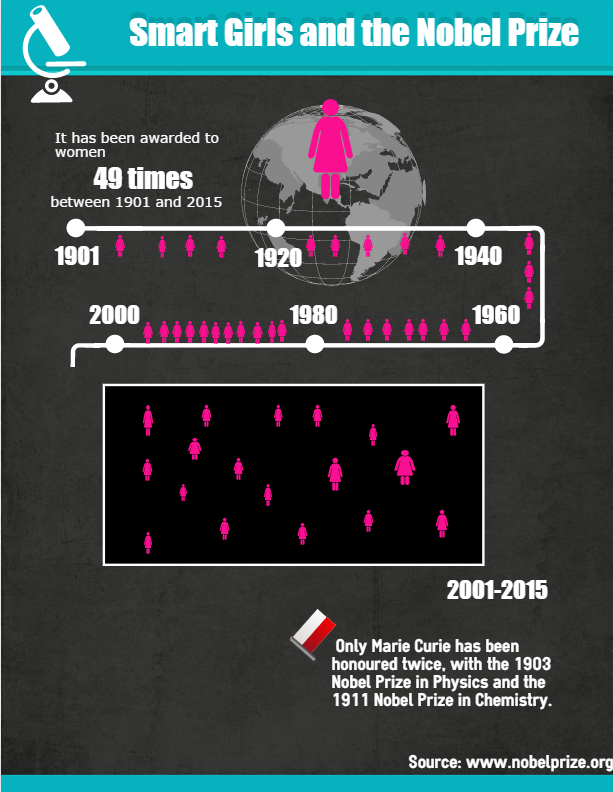
The Vheme I choose for this infographic is one of two I really like to use when I want to show things that happened during a period of time. This one is for a smaller scale, and I divided it for periods of 20 years. I could have just written the number of Nobel Prizes given to women during each period of time, but it looks better with the little icons you can find in the “Object” tool, under the category “People”. I made them pink, maybe is a little too much but as they are high school students I tried to make it more colorful. Also, it was easy to use icons because (sadly) there are only a few women awarded with the Nobel Prize. You can play with the icons and make them bigger, smaller, change the shape a little bit, in order to show diversity.
I tried not to put too many words on my infographic, but at the end I added some facts about Madame Curie (my personal idol) and I found a Poland flag under the category “flags” of the “Object” tool.
– submitted by Easelly user
Learn more about using infographics in the classroom.