
Admit it, studying science may not be a piece of cake compared to other subjects. But once you find great resources that help you retain more information, you’ll be a pro!
Science helps us understand the world a little bit better, so why not make it interesting?
Make science more engaging and fun with infographics
Here are 6 science infographics that will share interesting facts – and pique your interest in a variety of science fields.
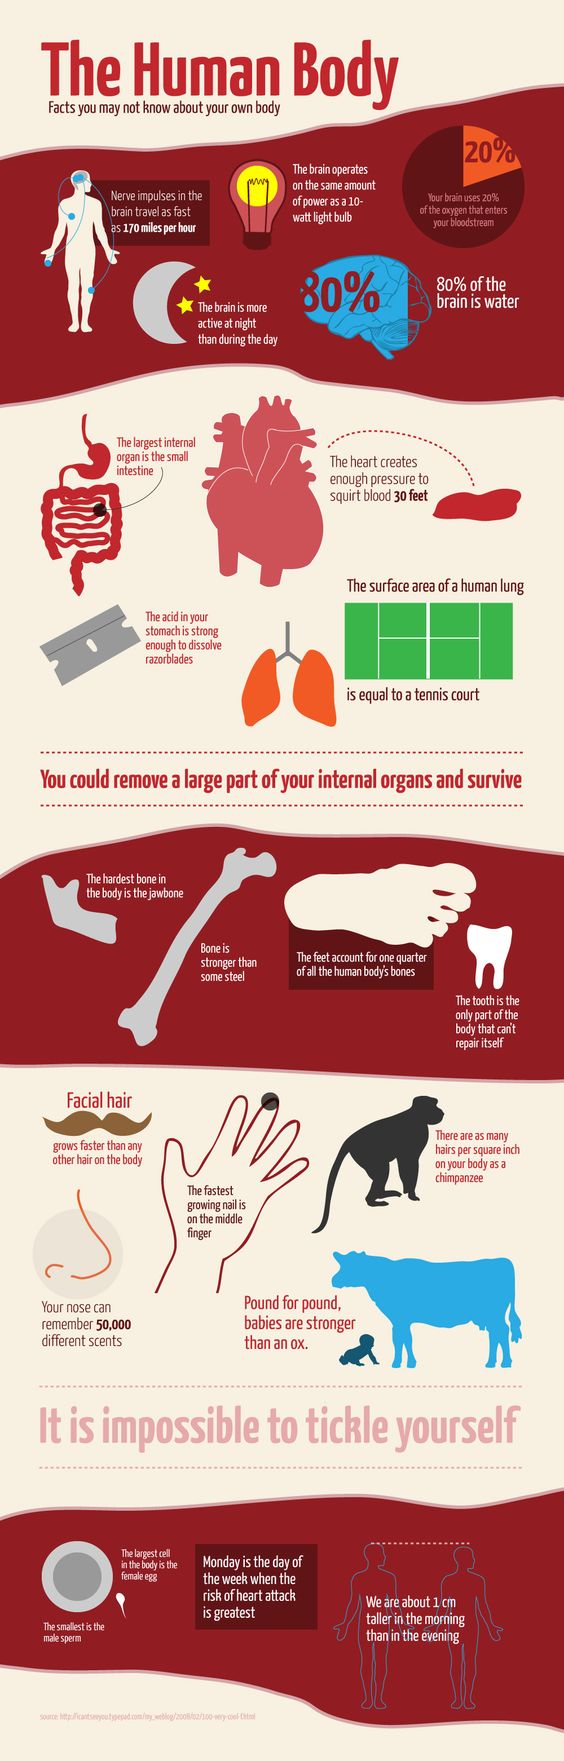
Anatomy infographic
Are you fascinated with the study of the structures and parts of living organisms?
If so, this anatomy infographic cleverly presents facts that you may not know about the human body. Did you know that the brain operates at the same power level as a 10-watt light bulb, or that the nose is able to remember 50,000 different scents? This infographic shares tons of fascinating information about our bodies.
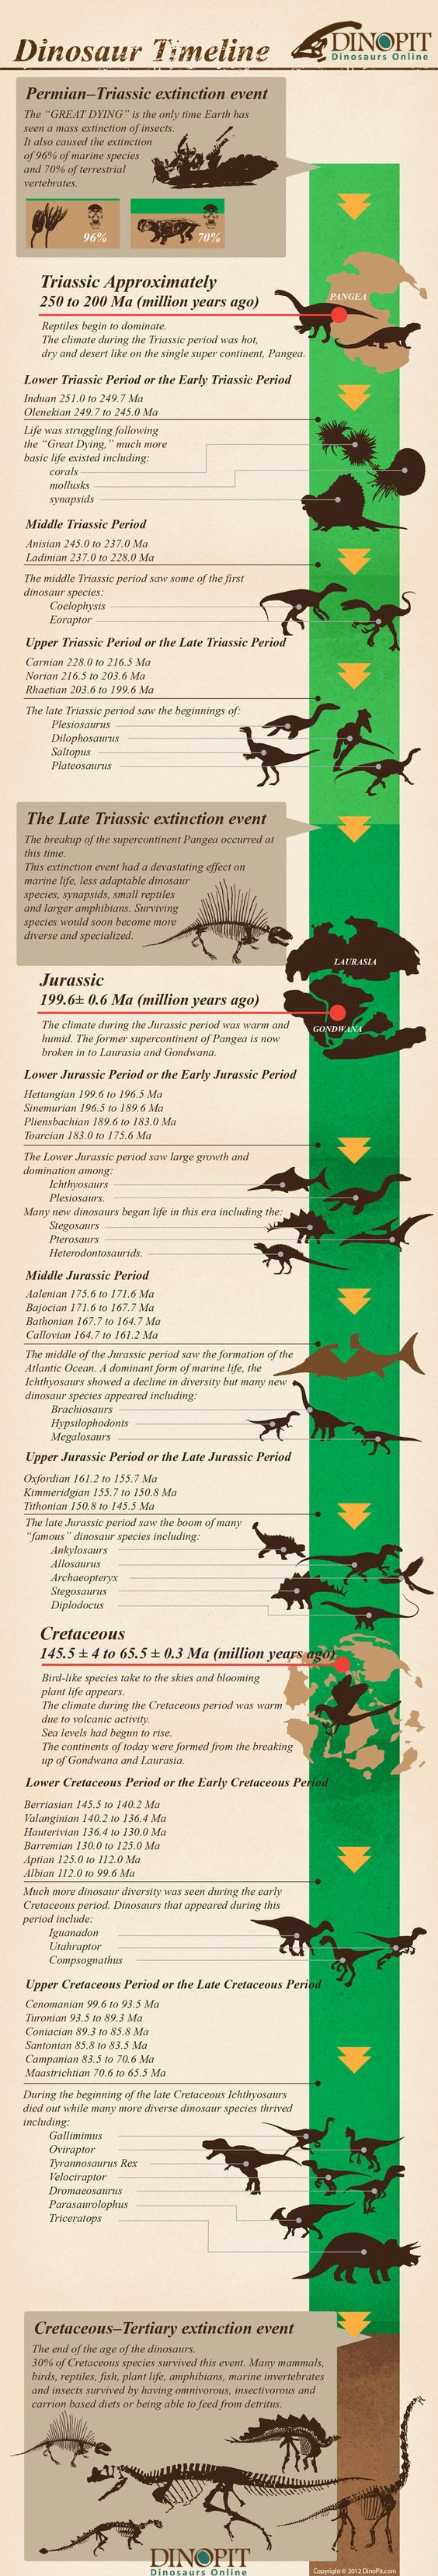
Dinosaur timeline infographic
If there’s one science topic that can easily attract young kids, it’s dinosaurs! (Does anyone else hear the Jurassic Park theme song playing?)
From films to popular culture to books and recent discoveries, these mysterious and captivating creatures are a pleasure to study. This dinosaur infographic will take you back 250 million years, when reptiles dominated the earth, then to the Jurassic era – 199 million years ago – where Ichthyosaurus and Plesiosaurs were all over the place. This timeline infographic covers it all – even the end of the age of the dinosaurs.
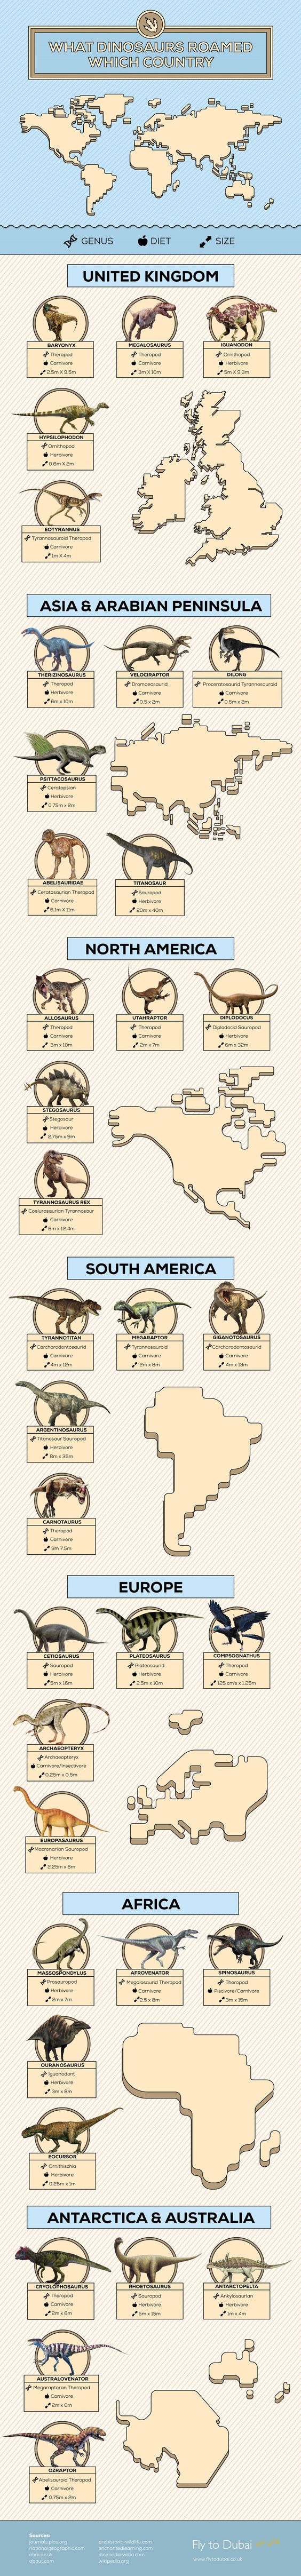
Dinosaur species infographic
Another infographic about dinosaurs shows which dinosaur species roamed the different continents. The dinosaur species infographic shows actual illustrations of the dinosaurs, plus facts about their size and diet. Overall, it’s perfect for a quick scan, or great for sharing with students for an infographic project in the classroom.
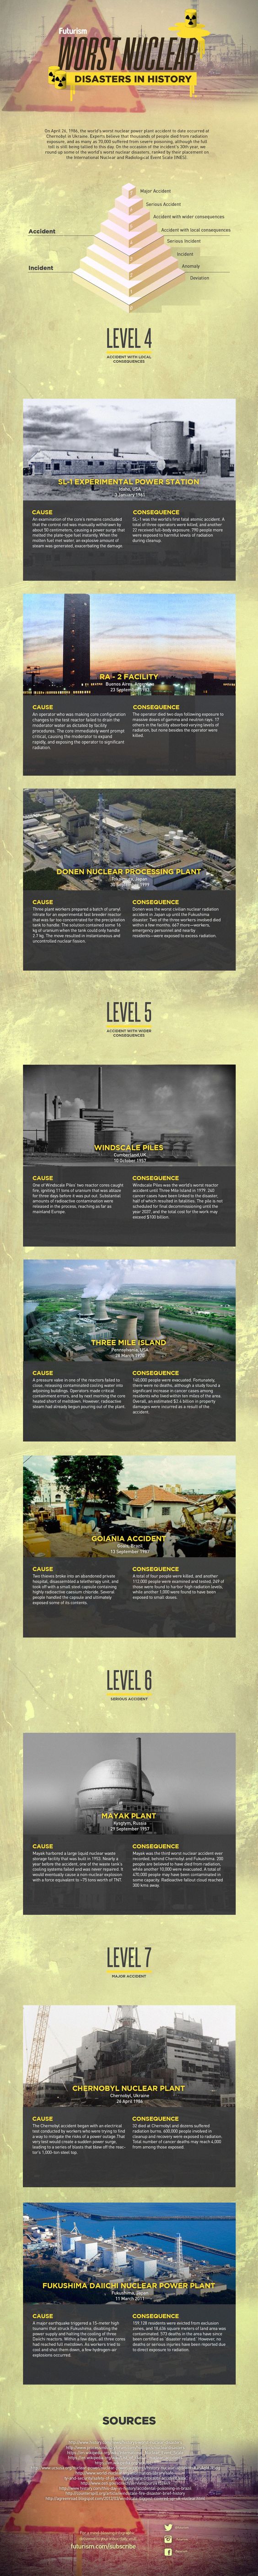
Nuclear disasters in history infographic
This nuclear disasters in history infographic exposes the worst nuclear events recorded. It highlights the eve- famous Chernobyl event in 1986, where thousands of people died due to radiation exposure. Learn about other significant nuclear events in this highly intriguing historical infographic.
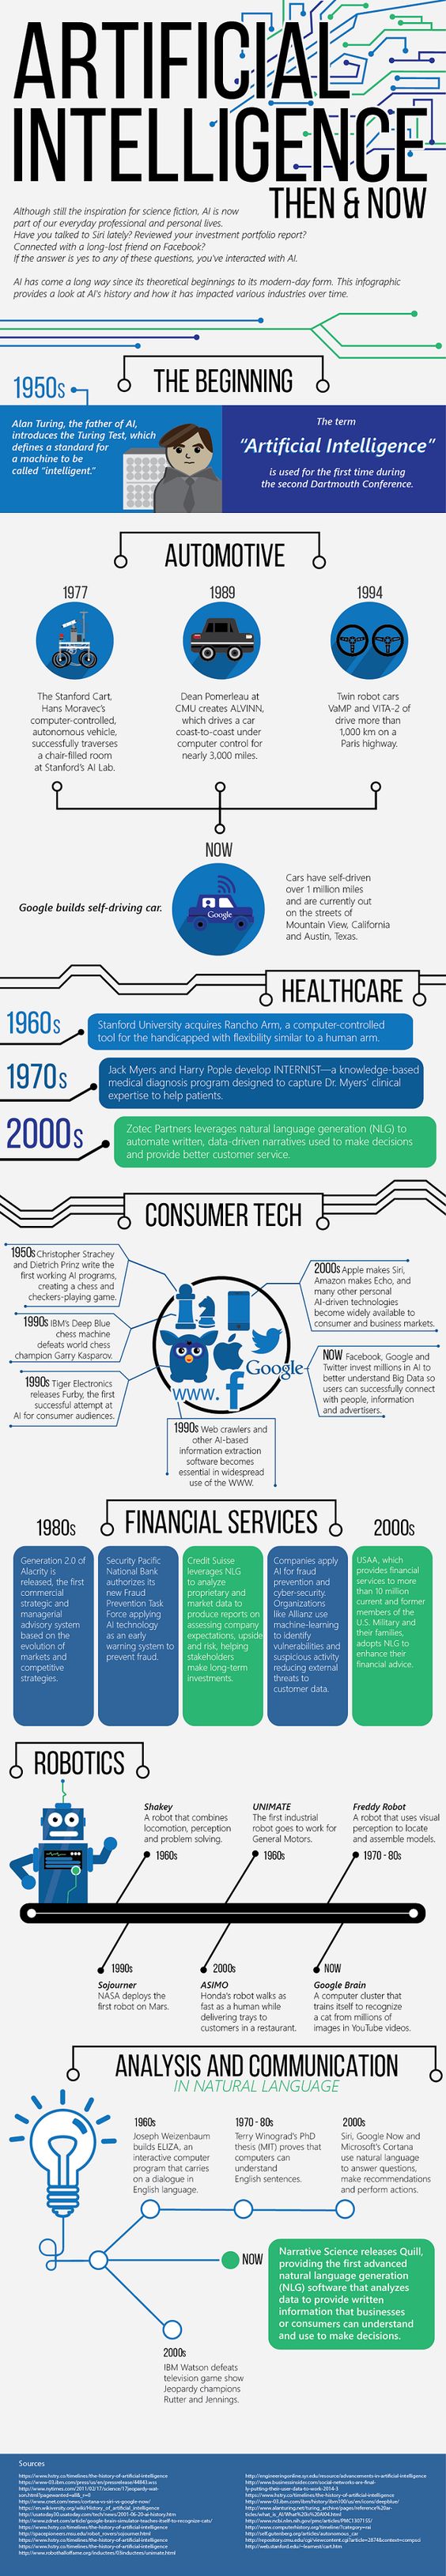
Artificial intelligence infographic
Robots and Artificial Intelligence (AI) have come a long way in recent years. This artificial intelligence infographic shows the progression of AI since the1950s to today. There are so many changes in technology that self-driving cars are no longer a thing of the future. Healthcare, IT and even financial services are benefitting from AI, so learn more before the robots take over!
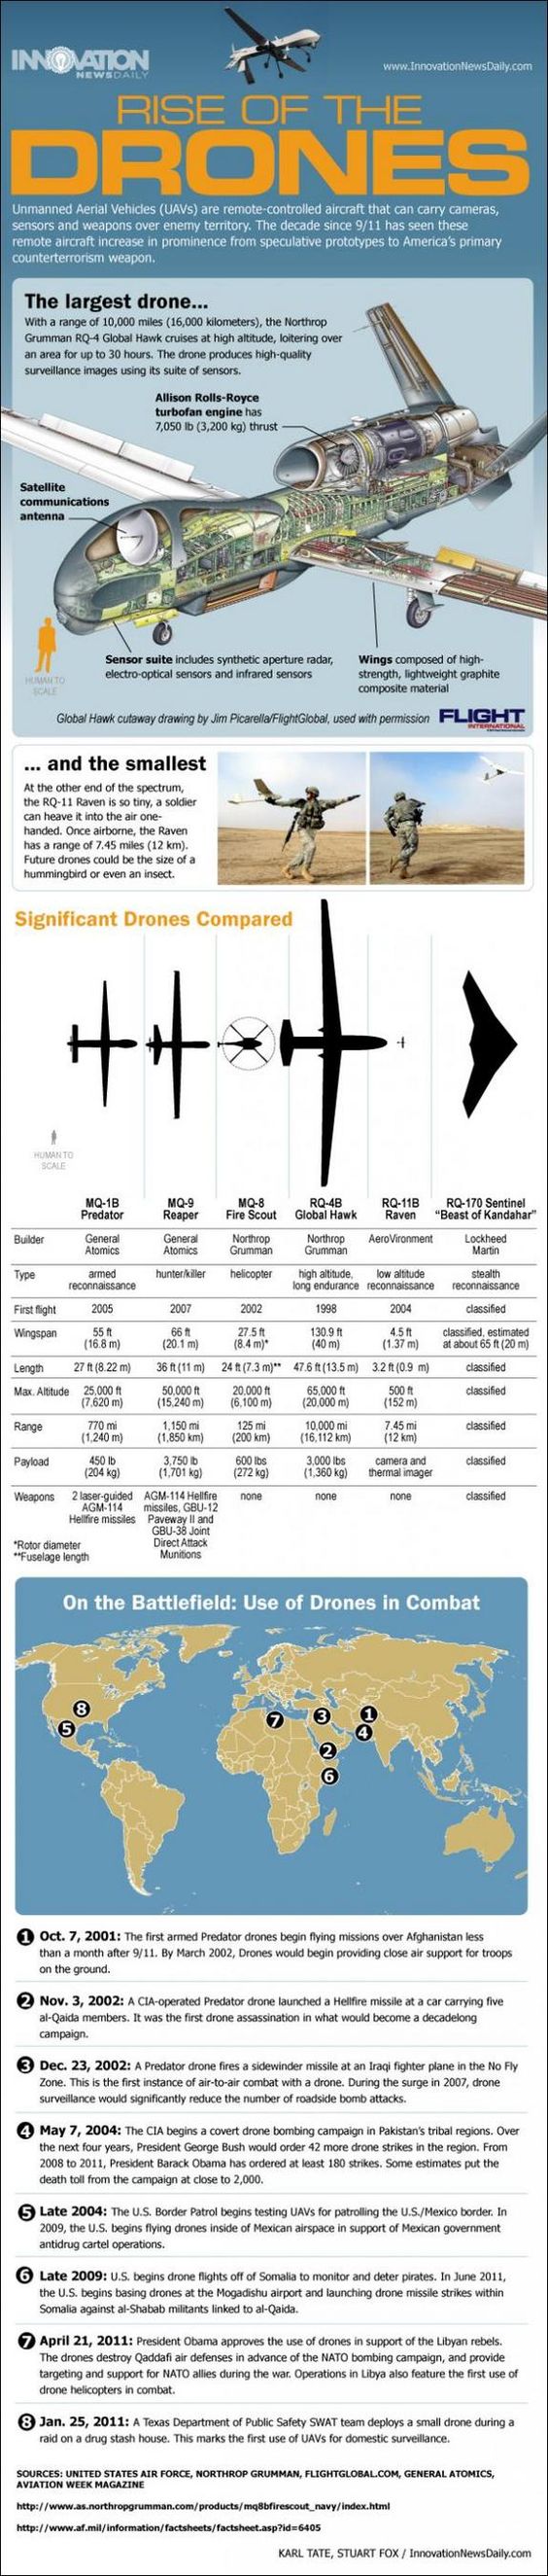
Drone infographic
This aerospace and drone infographic showcases the rise of UAVs, or Unmanned Aerial Vehicles. In addition to presenting the largest drone ever built, it also included details on wingspan, maximum altitude, range – and yes, weapons. Plus, you can learn how they use drones in wartime.
Whether you prefer learning about earth science or the age of dinosaurs, or the rise of the robots, we hope these science infographics intrigue you! They are great resources for students and teachers – so make sure you use these science infographics in your classroom!
Looking for science infographic templates to customize?
With science infographic templates, you can simplify complex scientific concepts without spending too much time.
Here are a few examples of templates that you can edit and customize from Easelly’s collection of science infographic templates.
Microbiology infographic template
DNA infographic template
You can make scientific knowledge accessible through simple yet effective data visualization in your infographics. Customize fonts, colors, icons, and backgrounds. Watch the short tutorial below to learn you can customize infographic templates using Easelly’s simple infographic maker tool.
Before you know it, your infographic is ready to keep your class engaged and fascinated with the wonders of science!
Finally, if you’re truly pressed for time to make infographics from scratch or edit a template, our infographic design team would be happy to help you out!
*Editor’s Note: This blog post was updated on April 27, 2020 for accuracy, new updates, and comprehensiveness. It was originally published on March 21, 2018.