
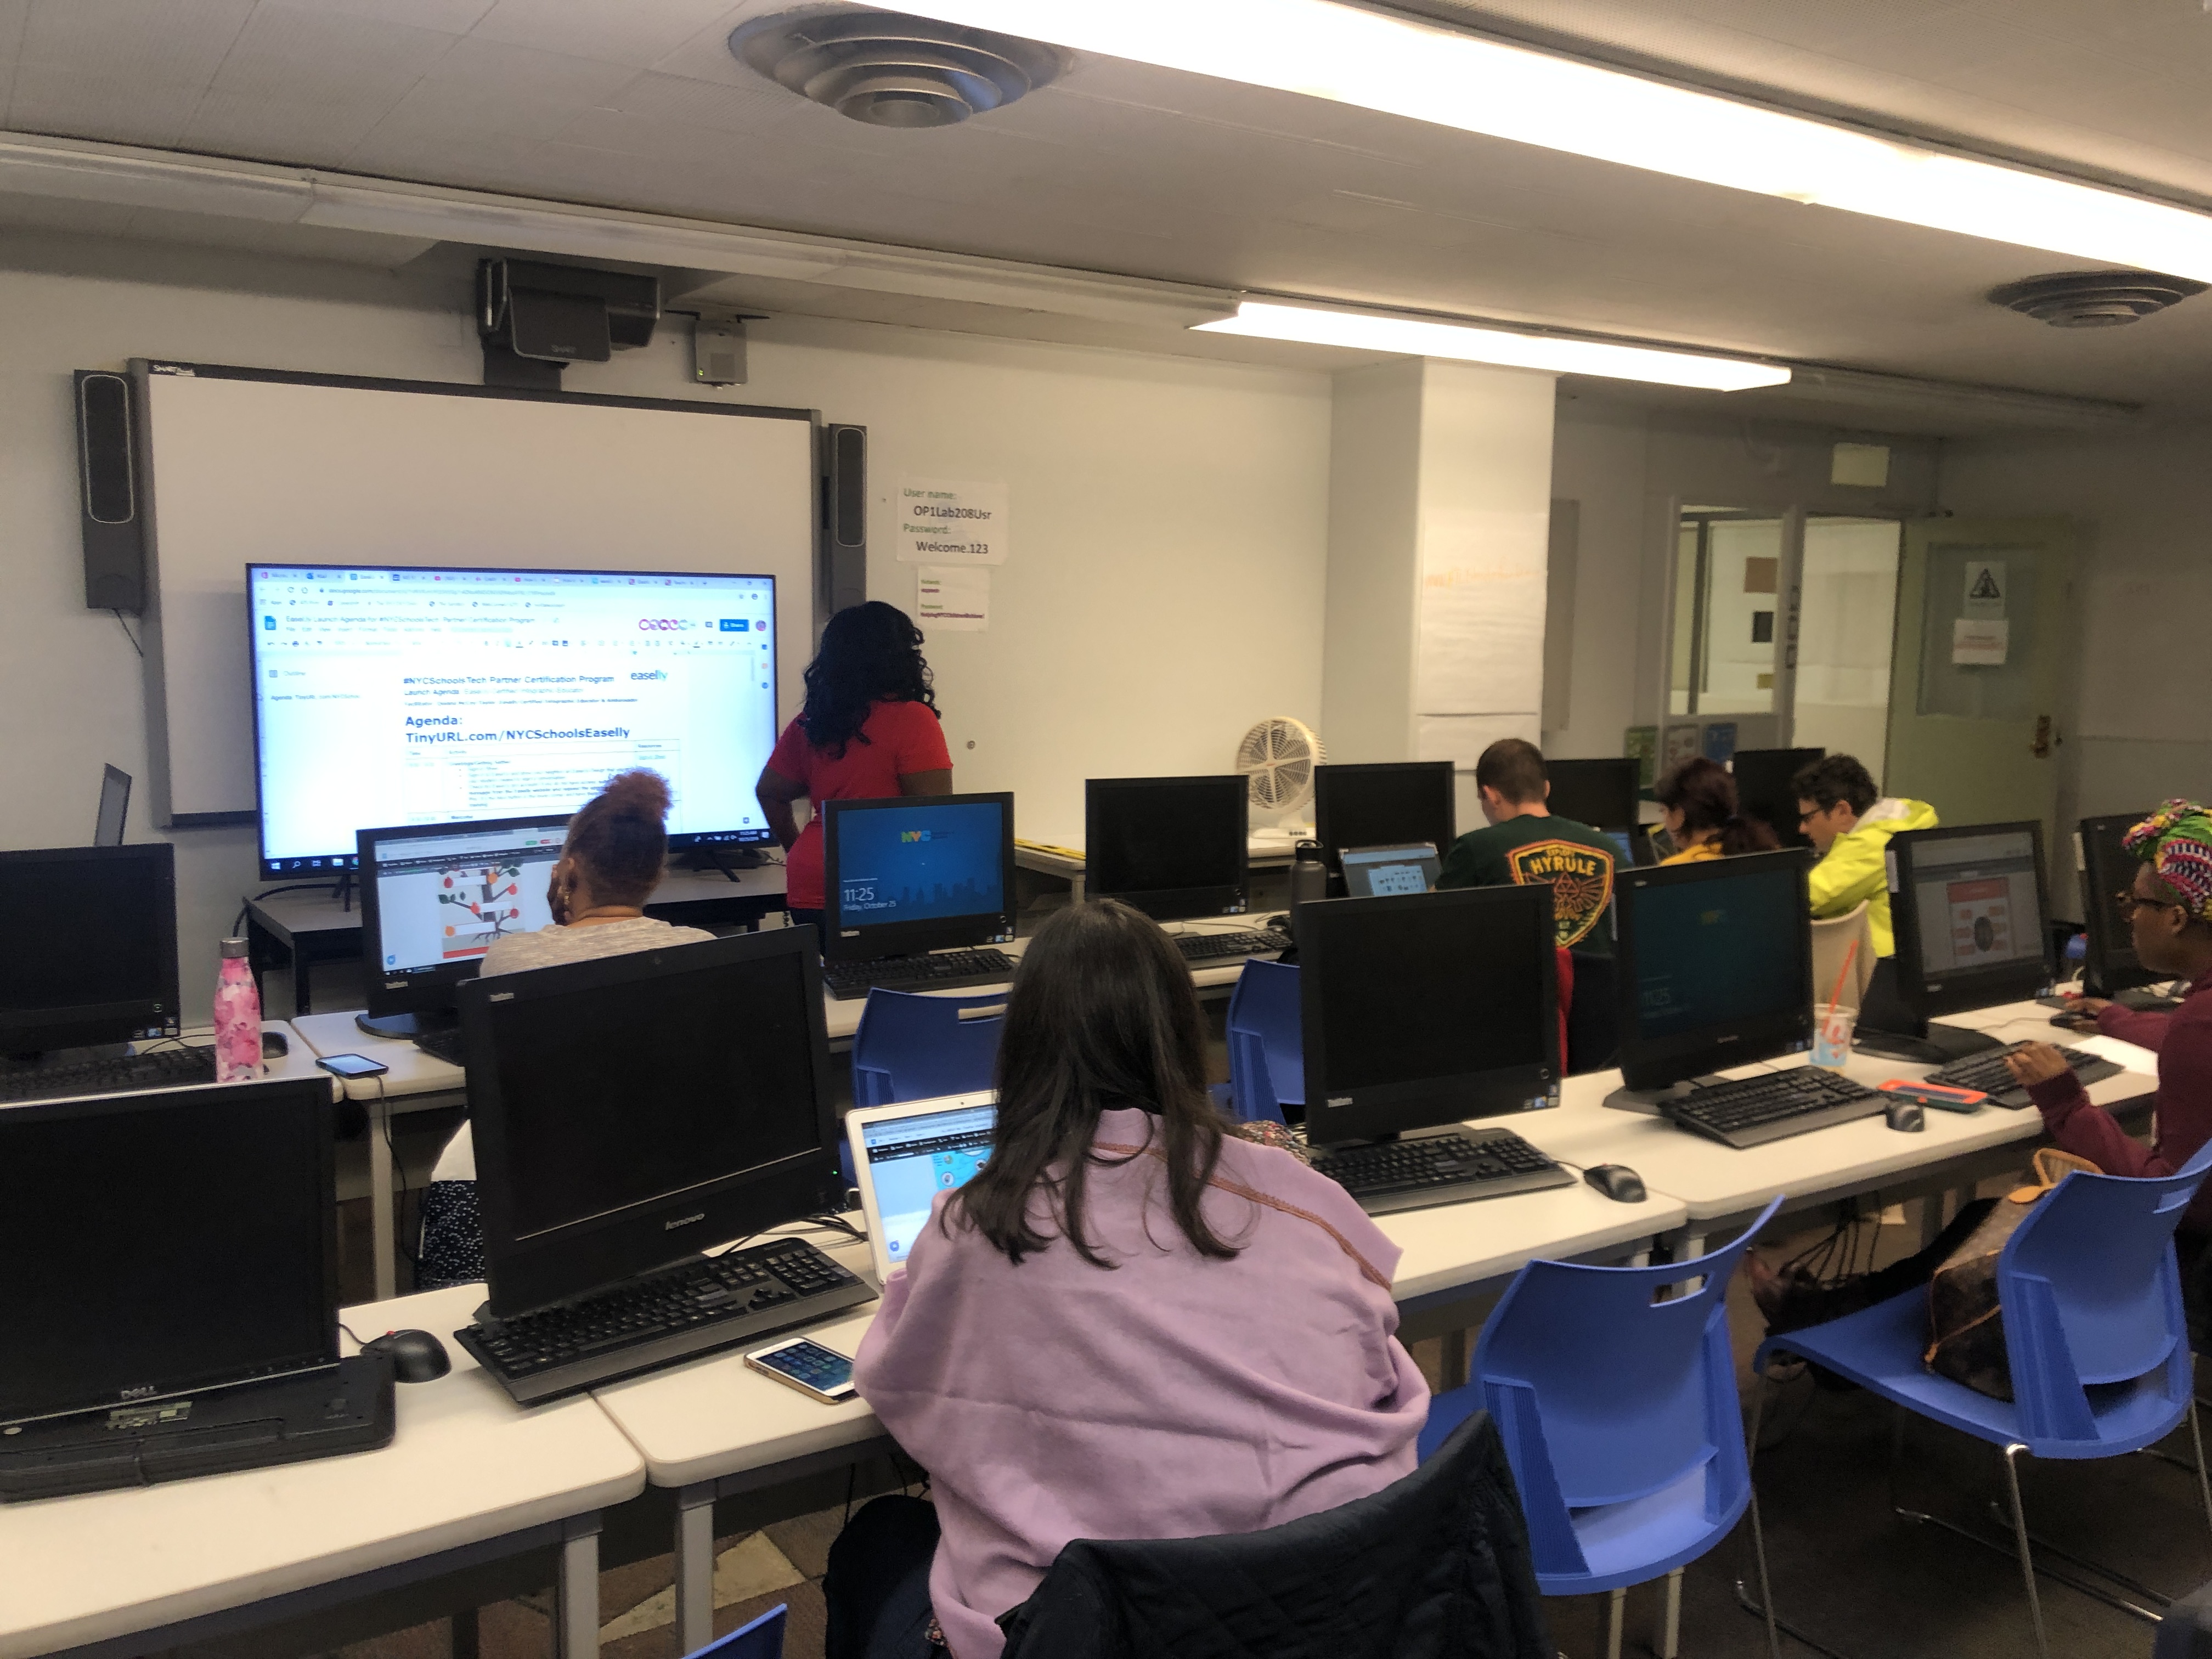
It’s that time of the year again for Easelly’s infographic training sessions with New York City public school teachers!
As part of the NYC Schools Tech Partner Certification Program, the Easelly team recently wrapped up training for our 5th batch of Easelly Certified Infographic Educators last October 25, 2019.
If you’re curious how it went last year, we have all the scoop (and the infographics done by the participating teachers) in this blog post- How NYC Educators are Using Infographics in the Classroom.
Infographics for teaching and learning
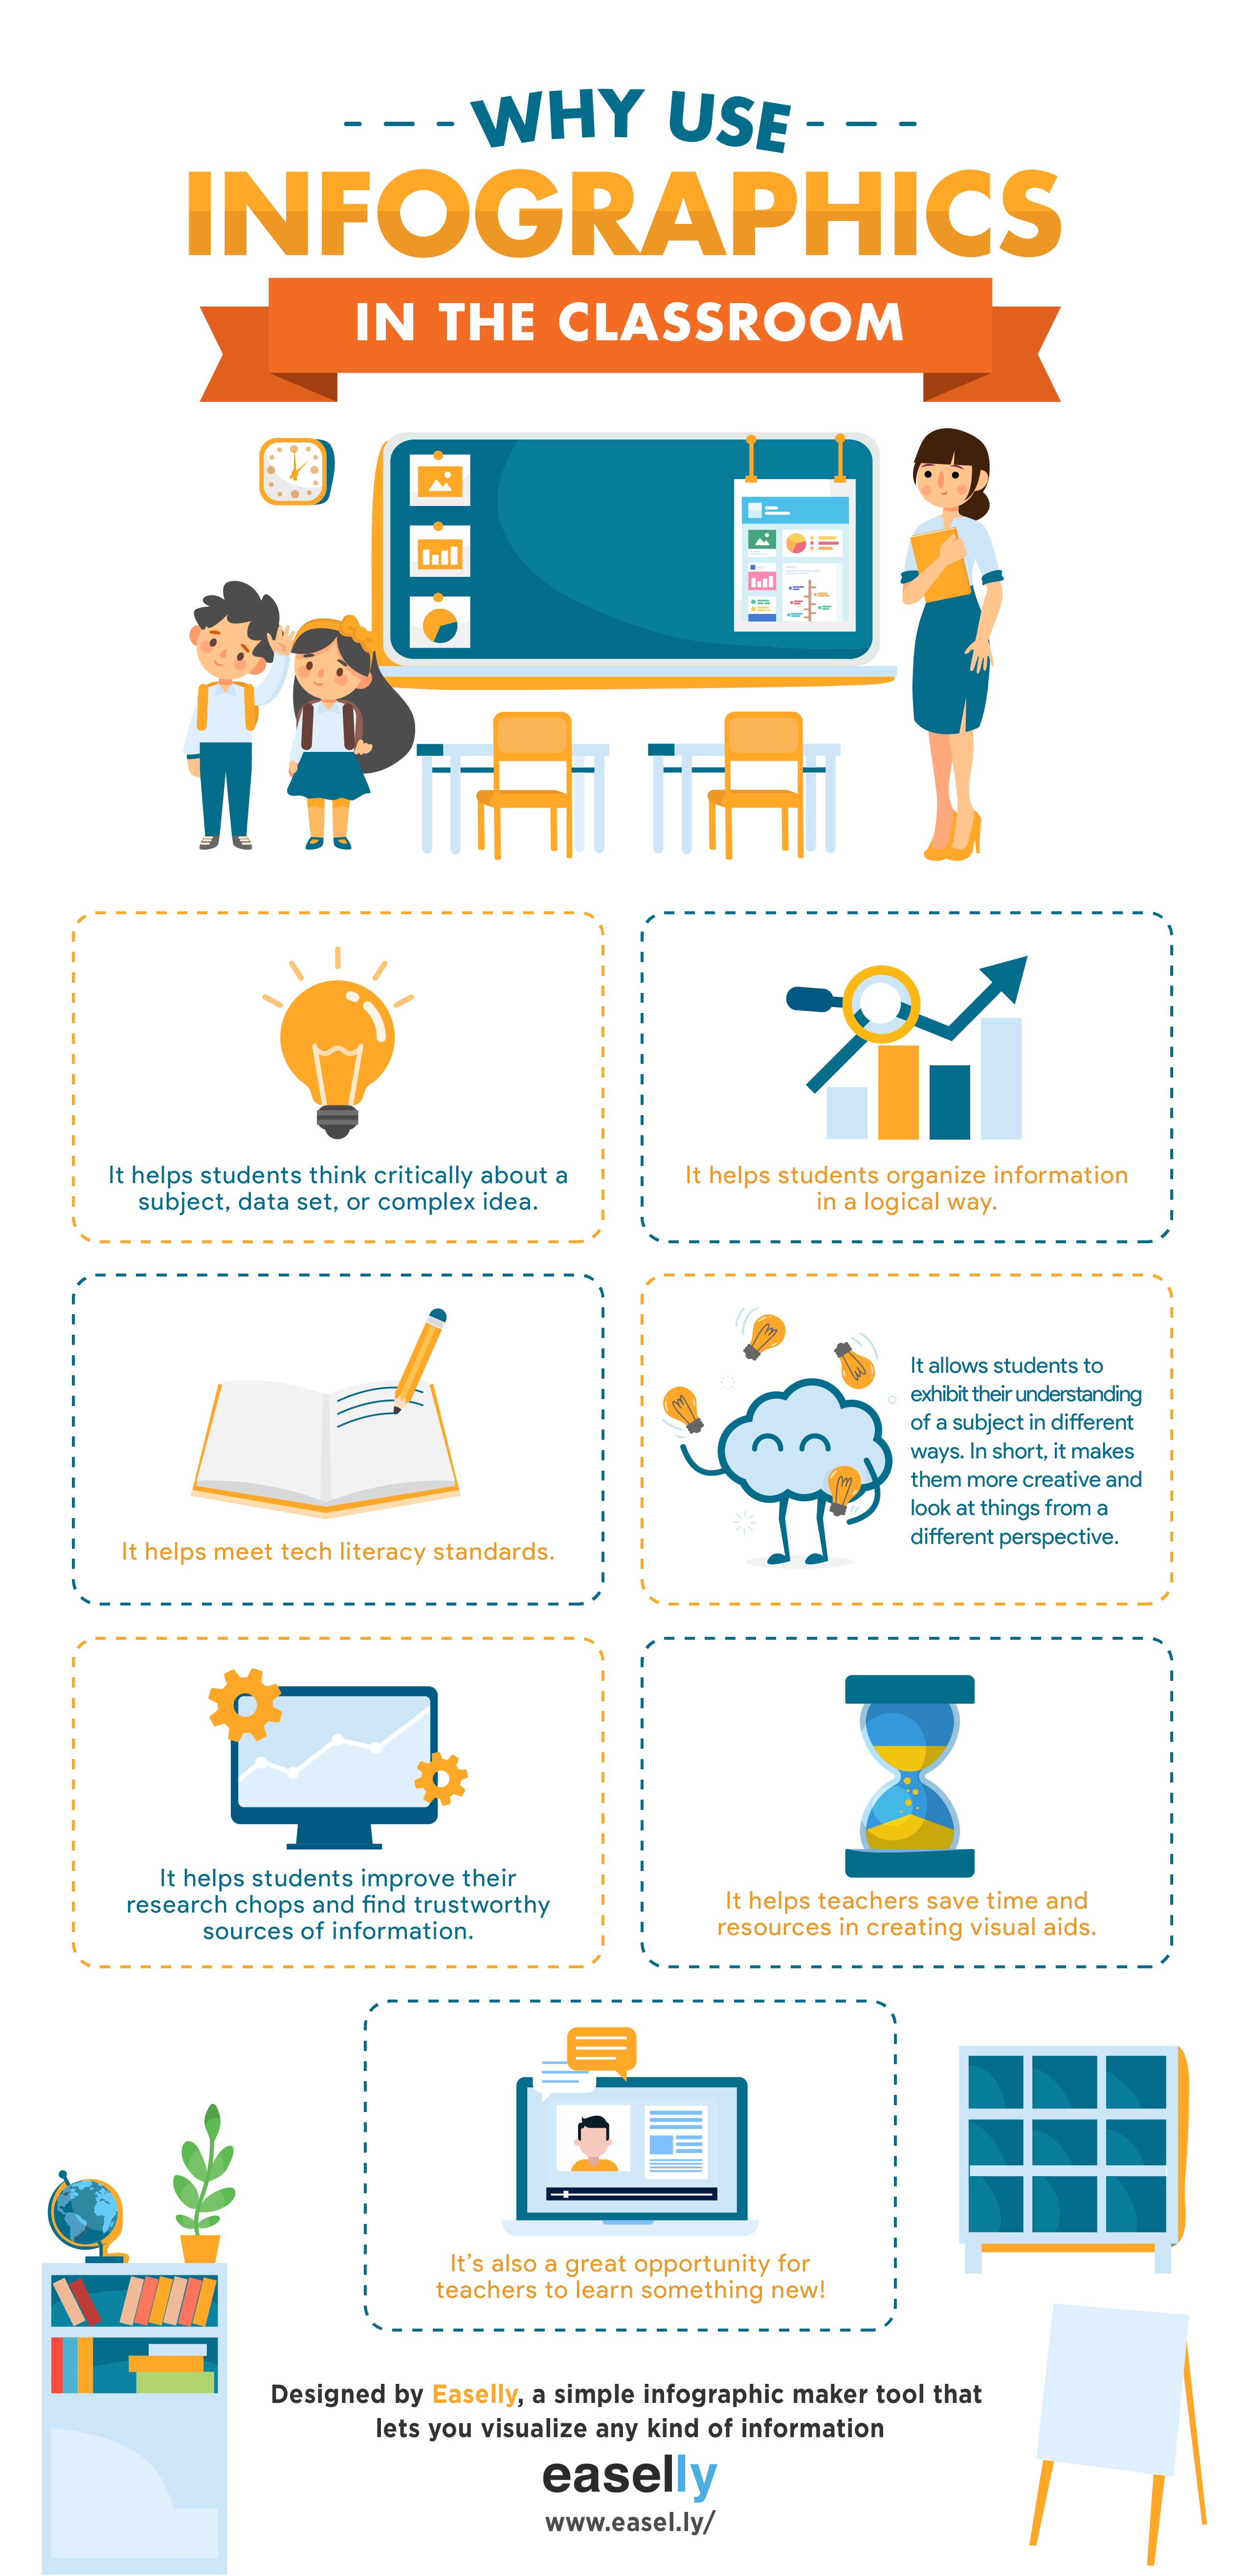
Each year, more and more educators are adopting visual elements into their class syllabus, assignments, and workflows because of its benefits inside the classroom.
For a start, it helps teachers save precious time (and energy!) in creating lesson plans. Meanwhile, students get to improve their research and critical thinking chops.
The infographic below spells out the additional benefits of infographics for teaching and learning.
For this batch of forward-looking educators, we asked them about their plans and best practices on how they are going to incorporate infographics in the classroom as well as professional development.
We’ve also highlighted the infographics they’ve done during the workshop (and the thought process behind it!).
Who would you collaborate with at your school to create infographics with your students?
Michael Russo:
I would share this not only with the STEM department, but the English and Science departments for new ways of effectively engaging their students and data collection within their own units of study.
Barbara Linder:
I would collaborate with 4th or 5th grade teachers to offer students the option of creating an infographic as:
1. a culminating project for reading, writing, social studies, etc. unit
2. a way to demonstrate their understanding of a process (e.g. multiplication, conducting an experiment, writing process)
Rob Cassidy:
I would like to use this for my MLL (Minimum Level of Learning) and LD (Learning Disability) students to make difficult concepts easier. I’m also planning a professional development session for my colleagues to share this new resources.
Marni Levin:
I plan to create several visuals to hang around my classroom to help students visualize things that require multi-step directions. I hope this will eliminate the need for me to repeat myself as much and I can just point to the visual I’ve created instead.
Zeneida Marcelo:
I would like to collaborate with my fifth grade team.
Shellyann Vincent:
I would collaborate with my coordinator and teachers to create the same visuals across the classrooms and in the school.
Alexandra Giordano:
I would collaborate with the English and Social Studies departments. Every year their students must create graphic organizers on an antiquated website which looks awful. This is a great resource for students to gather and organize their research for presentations.
Radwa Ahmed:
I could collaborate with students who can be my assistant in creating infographics and support other students. I’d also like to use Easelly with co-teachers in using infographics in their classroom.
Share some best practices for creating infographics with your students.
Michael Russo:
Choosing the right infographic colors, images and branching a lesson on character limits to this platform. Example: Having students use written responses in a twitter format
Barbara Linder:
- Start with subject matter for which students are experts (e.g. all about me).
- Have students plan out their infographic before creating online (e.g., talk through with a partner, graphic organizer, sketch).
- Provide templates to help students get started and establish scope/focus.
- Share rubric at start of project so students understand expectations.
Marni Levin:
Use the student’s interests to make them have a connection. They might not be able to create the infographics on their own but I can work with them to create helpful visual tools they can reference.
Shellyann Vincent:
The best practices for creating infographics with students are selecting your audience, simple colors, let the visuals do the talking, and focus on one topic.
Alexandra Giordano:
- Teach students how to identify key facts and details to focus their thoughts.
- Graphic design and color theory would greatly aid the students in their infographics designs.
Radwa Ahmed:
- Some best practice is giving student a paper template (infographic outline) first so student can draft how they would create their infographic almost like graphic visualizer in order to map out their ideas.
- Also, I’d like to group students based on comfort level of using Easelly as well as having students assess their knowledge and comfort on creating infographics. The infographics can be used as a culminating project and data to inform instruction.
Share your infographic creation and the thought process behind it.
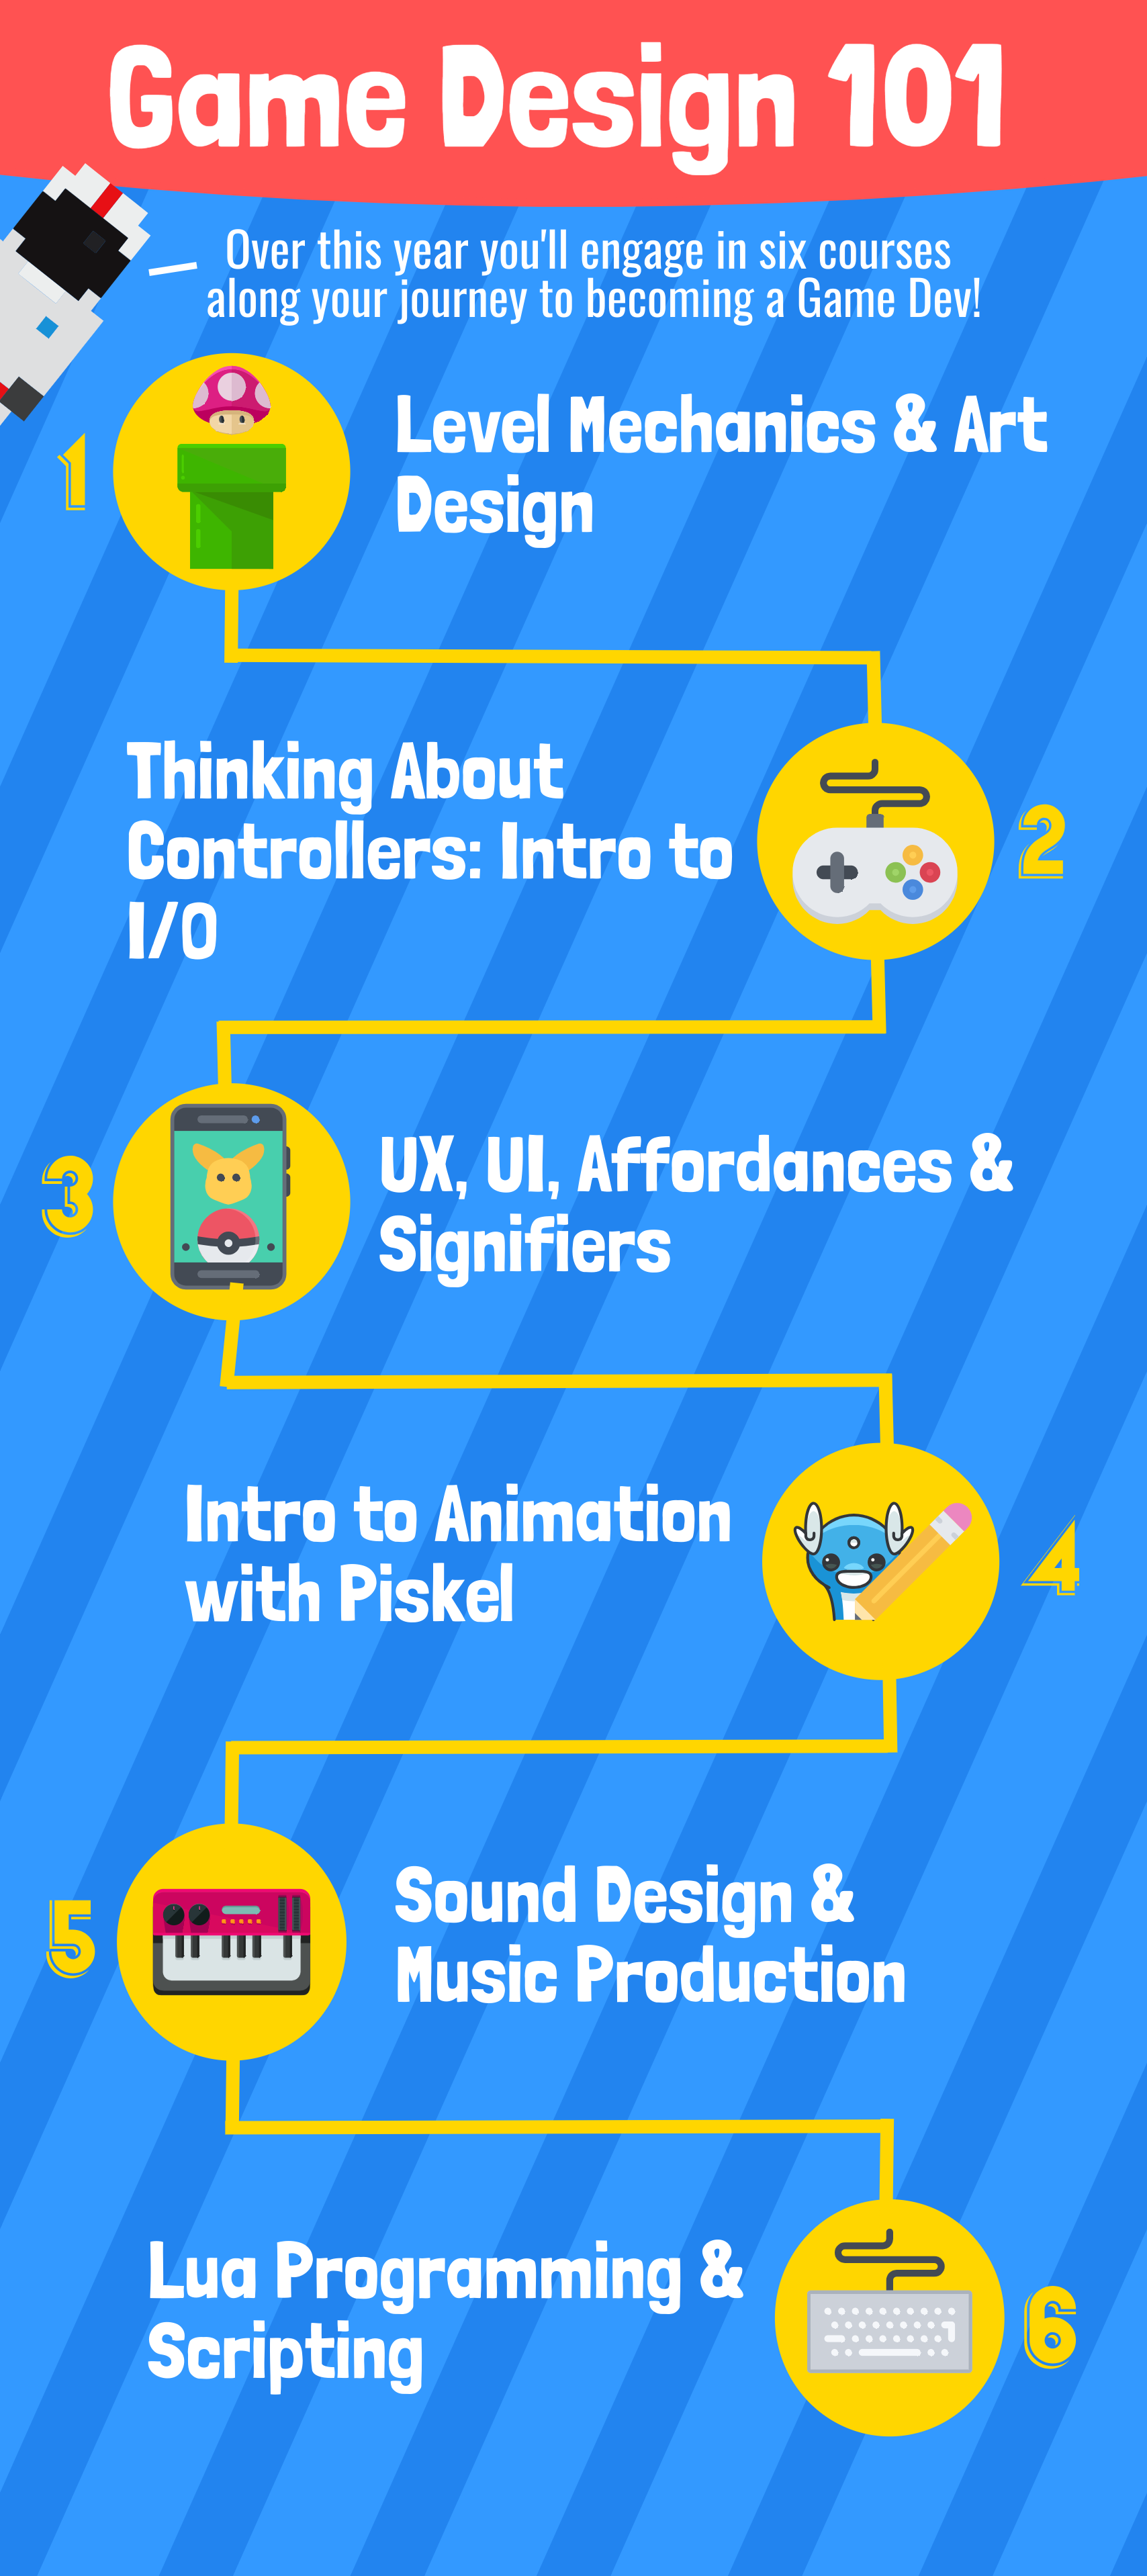
Michael Russo:
I made a quick infographic for explaining the pacing of our 8th grade “Game Design 101” curricula. This can be useful for the beginning of the year as well as a self check for students to know how they are progressing through the year and what stage they are at!
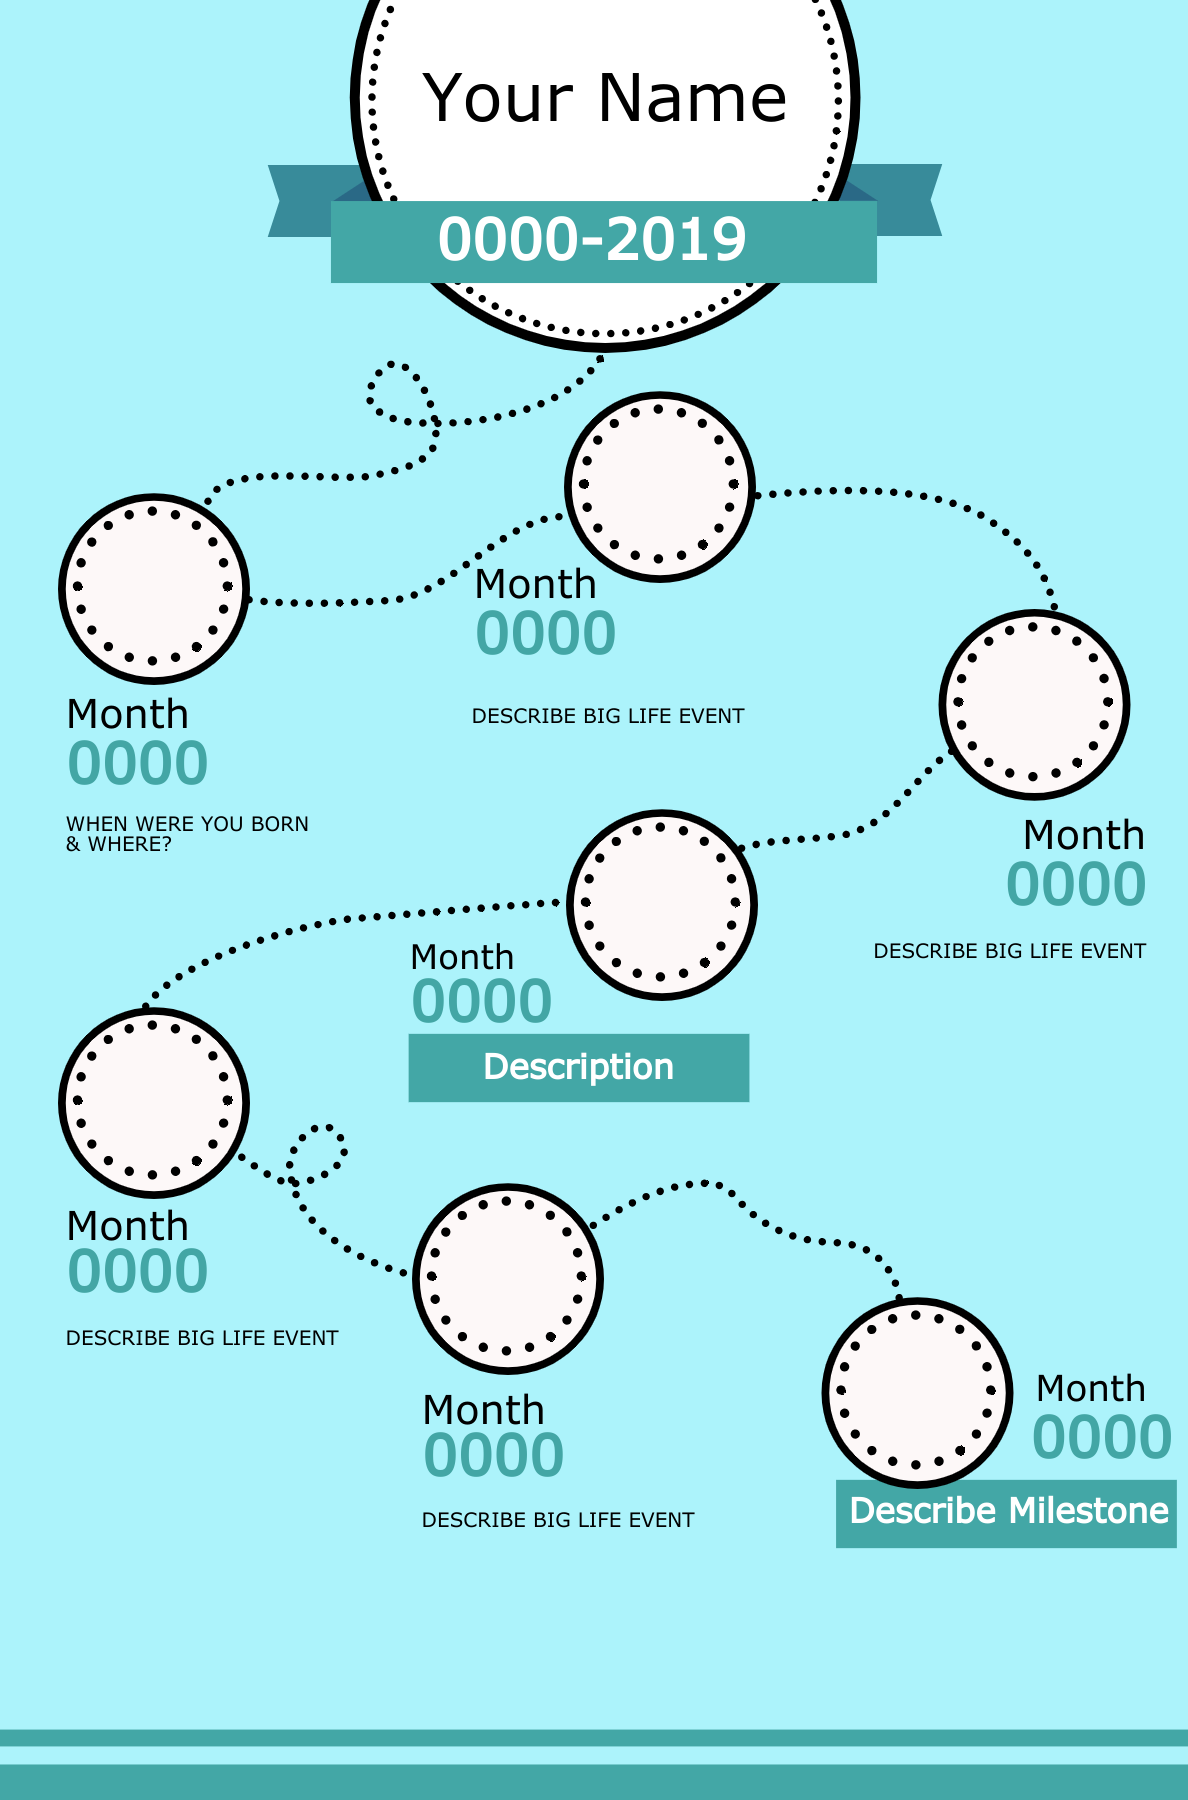
Barbara Linder:
To introduce my students to infographics, I will have them create an All About Me infographic. This is an example of the template. Once students are comfortable with Easelly, I will ask them to pick an academic topic and create an infographic to share what they know.
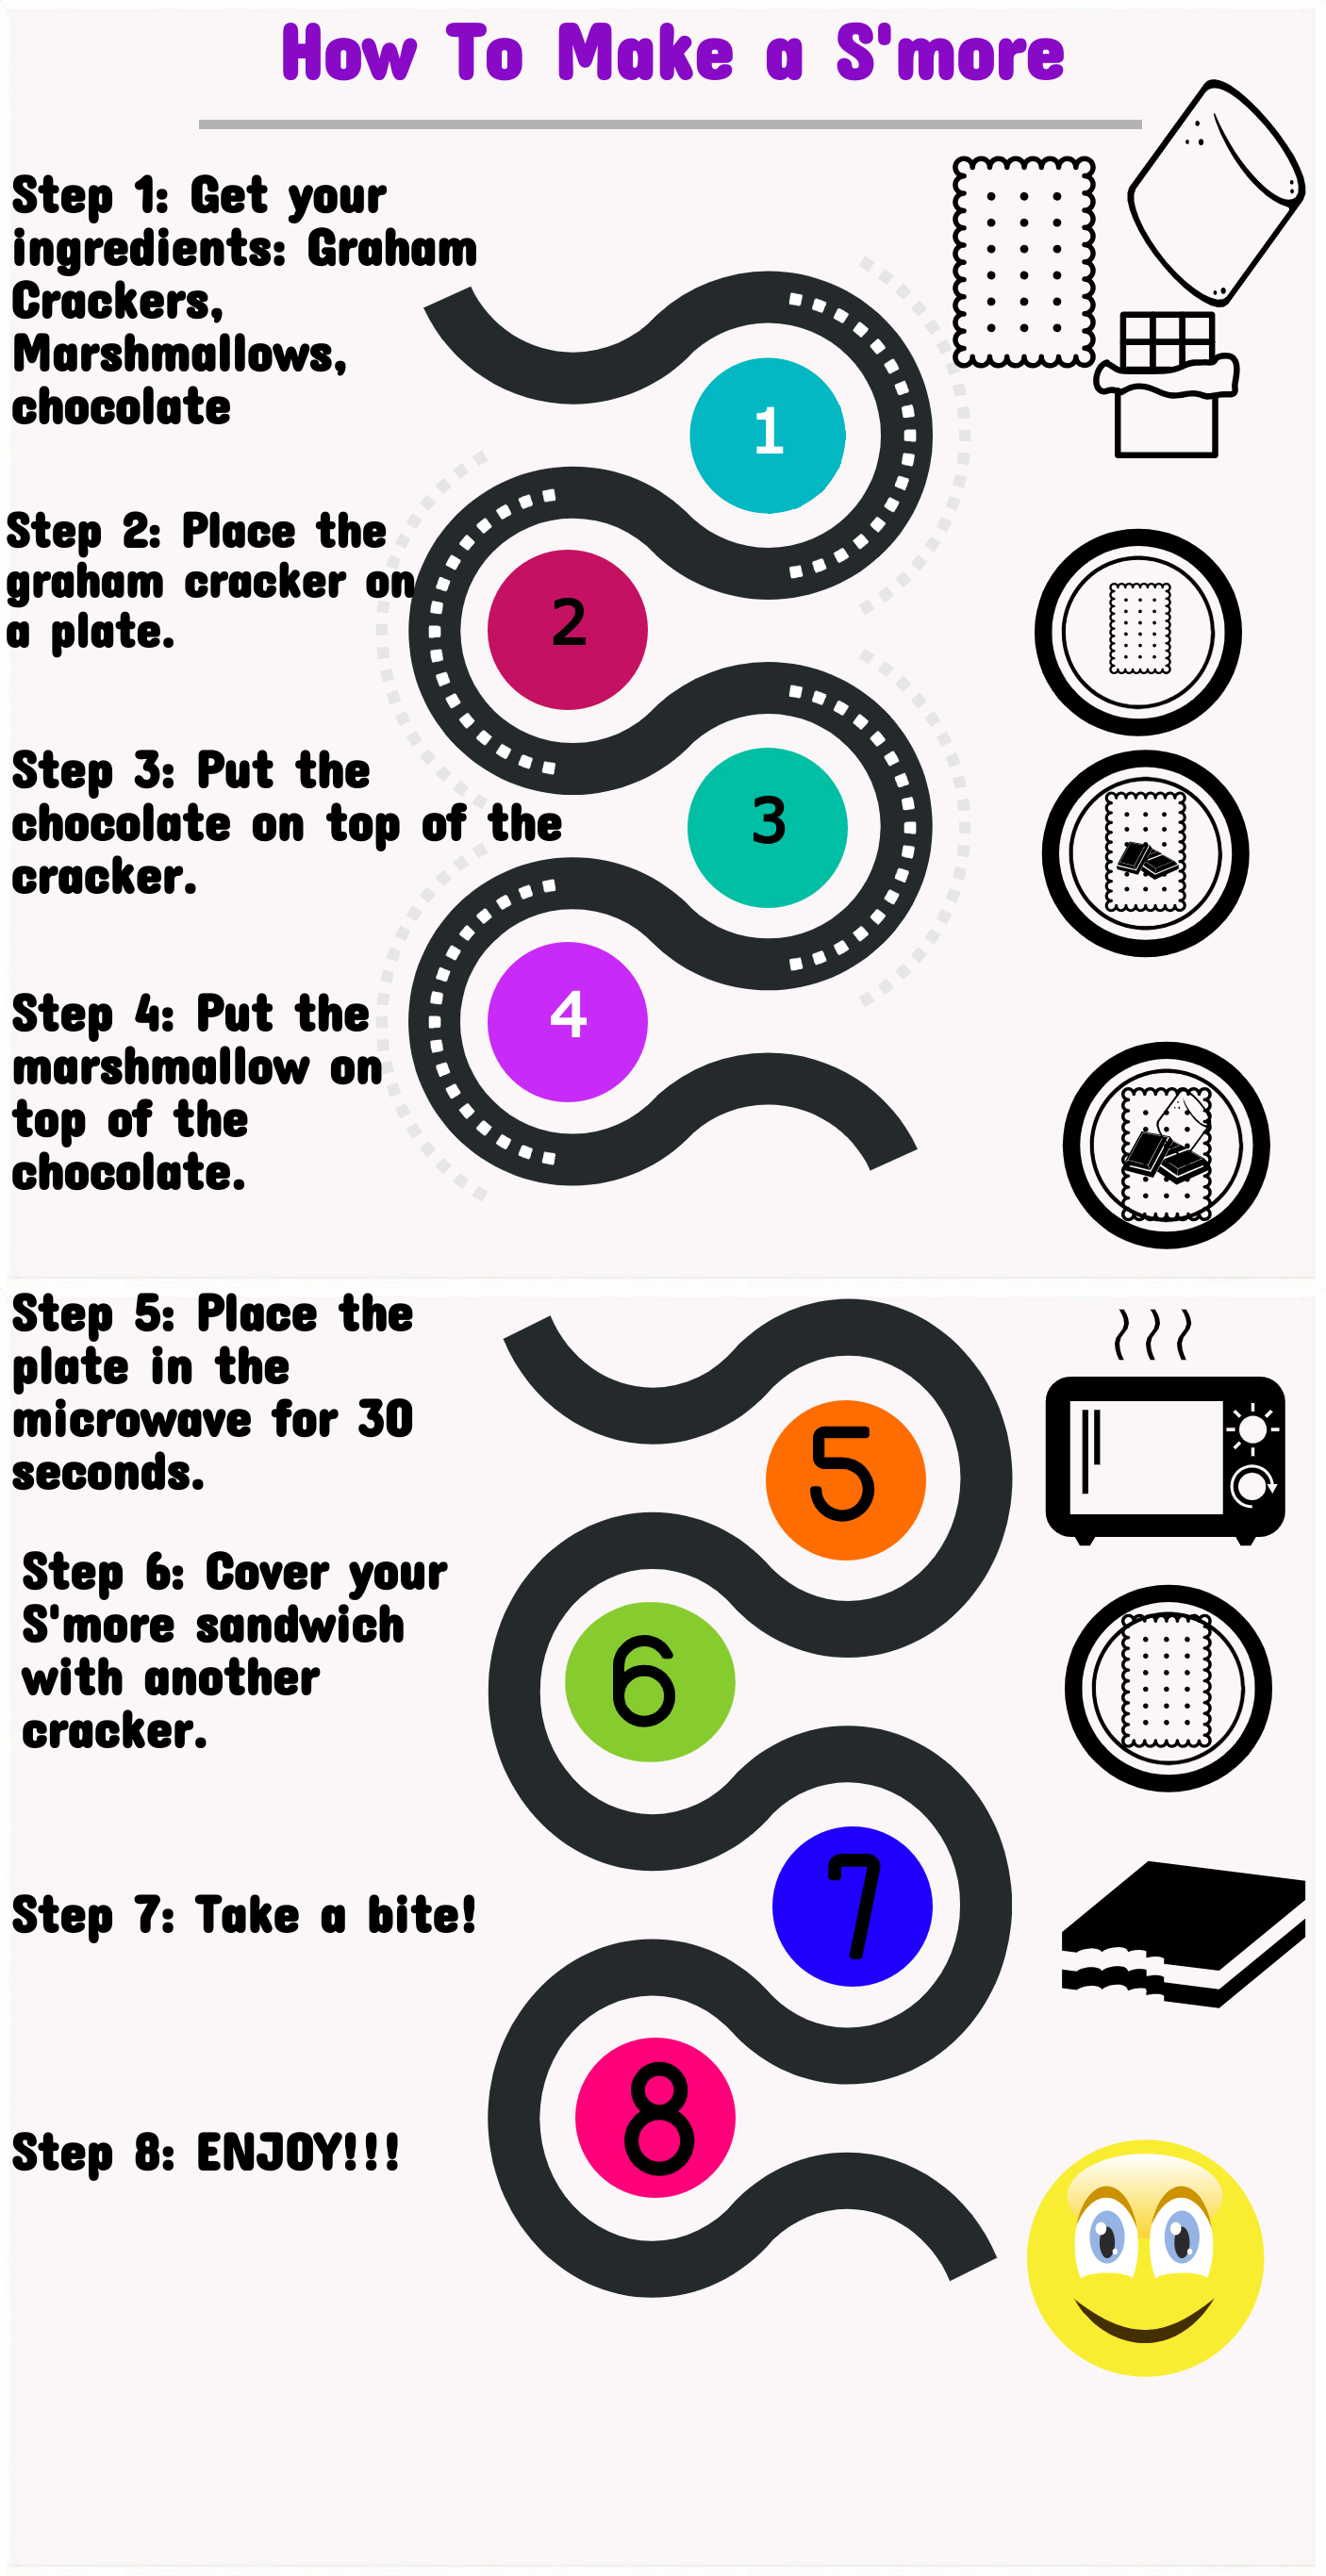
Marni Levin:
I made an infographic on How To Make a S’more! Enjoy!
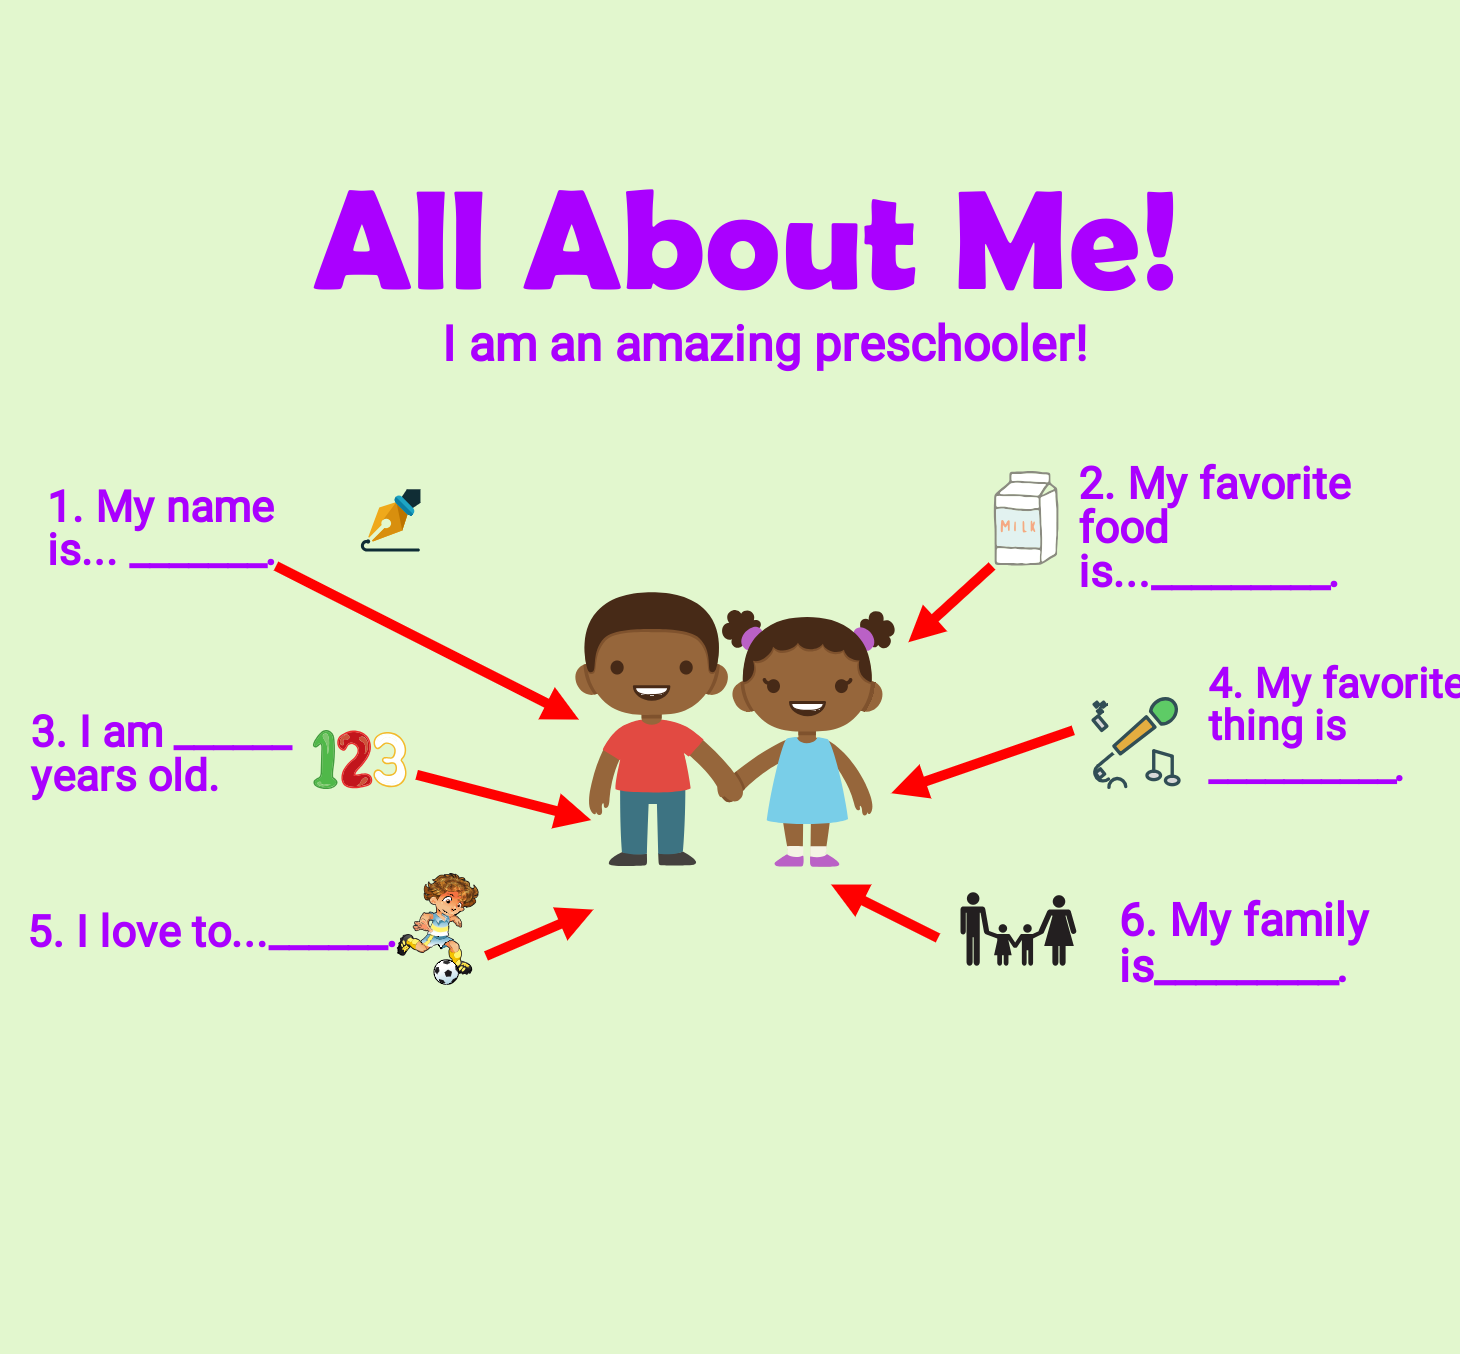
Shellyann Vincent:
I made an interactive All About Me (infographic template) fill in the blanks chart for preschoolers.
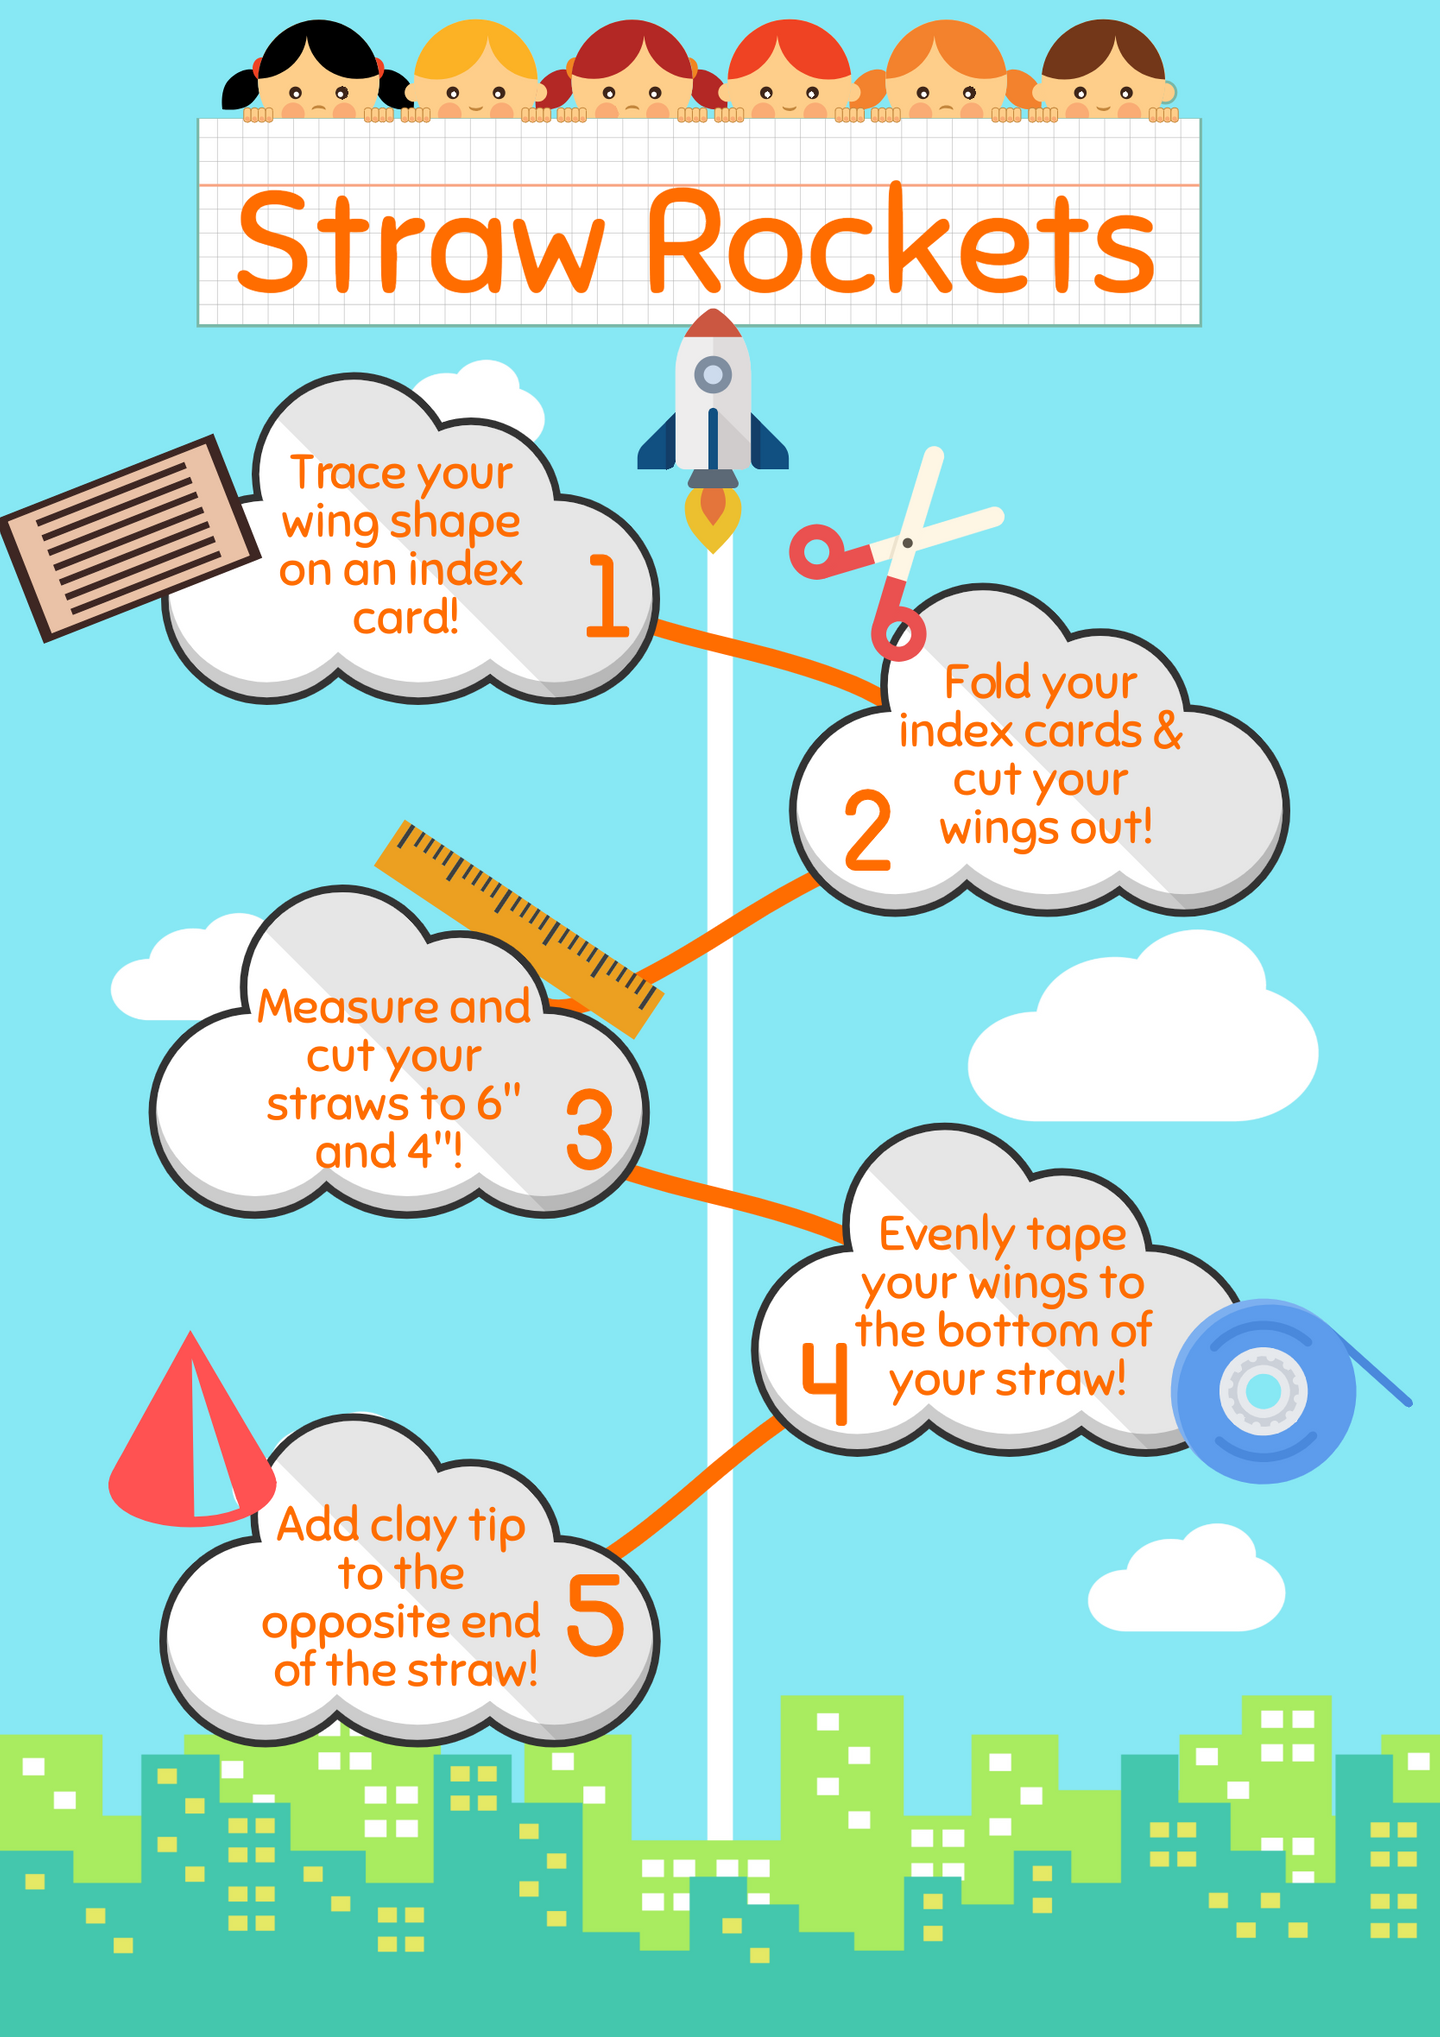
Alexandra Giordano
This infographic serves as a guideline for students to use during our Straw Rocket Activity. It can be used as an aid for students during the building process.
Radwa Ahmed:
This infographic is intended for teachers and staff that need to add a printer to their Mac laptop.

Rob Cassidy:
This is a silly graphic that I made just playing around and familiarizing myself with Easelly. I was inspired by one of the people objects I saw while browsing.
Over to you
Infographics can be used for any subject! Use timeline infographics to explain history or use process infographics in your science class.
If you’re an educator looking to make infographics in your class, here’s a good exercise: make an infographic with your students instead of creating it for them.
If you’re wondering how you can start using infographics in your classroom or media studies class, get the free Infographic Activity Book for Students. Next, check out our infographic design tutorial videos.
Finally, try Easelly for free today! You can also ask our infographic design team to make an infographic for your class if you’re pressed for time.
*Special thanks to Teacher Quiana McCoy-Taylor for helping facilitate the most recent session of the Easelly Certified Infographic Educator Program.