
How many of us avoid doing things because it’s “not the way things are done around here”?
Teachers and educators all over the world may have the best intentions but still end up using and advocating for tools that are already obsolete.
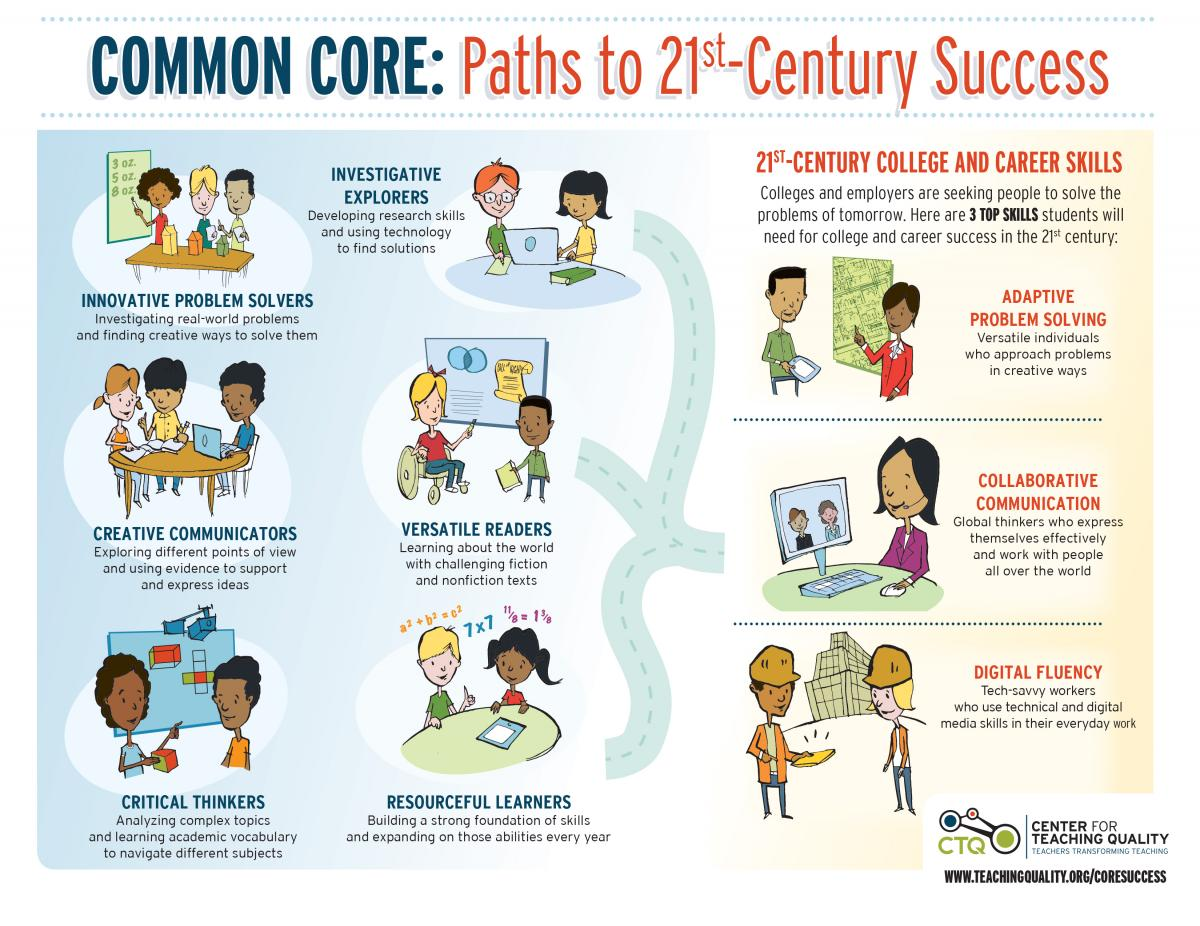
For instance, education no longer looks like it did when we were younger. Modern educators are using textbooks less while moving more towards EdTech or Education Technology. Common Core structures are helping foster an environment where visual communication and representation of information is commonplace.
Why teachers are using infographics in the classroom
EdTech gives way to learning that is more interactive and dynamic. It also saves money and improves the current setup of schools and educational institutions.
In EdTech, visual aids like infographics remain as powerful learning tools. They also drive the point home and make ideas easier to remember for students of various ages.
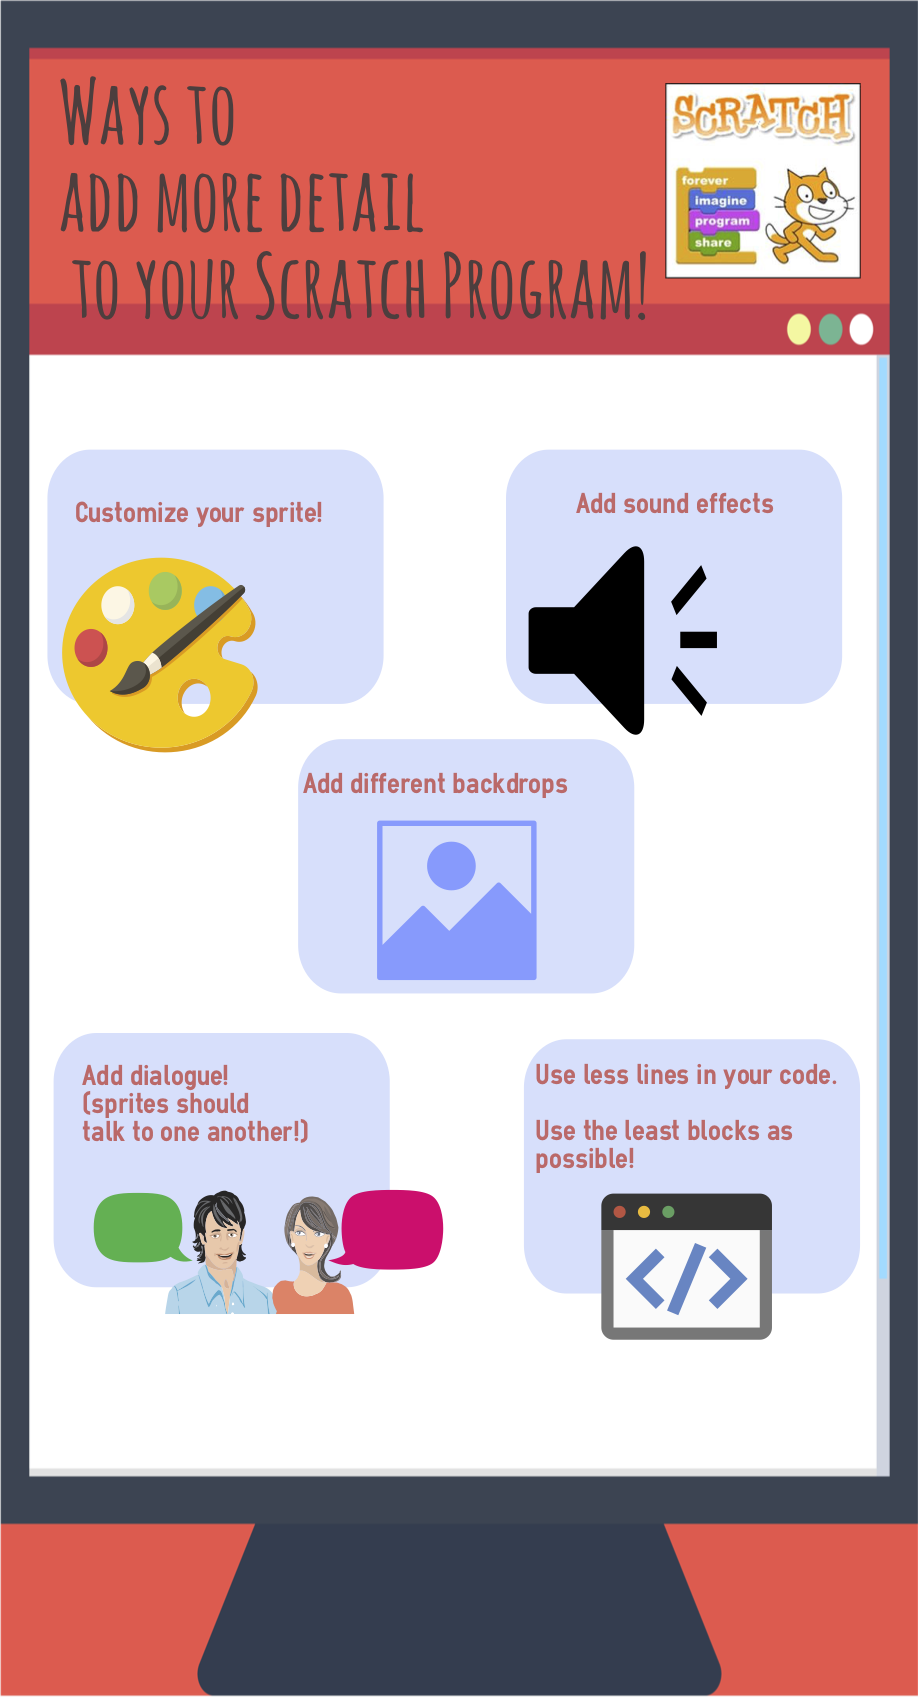
Today, we’re sharing infographics designed by middle school teachers that were part of the NYC EdTech program we ran recently!
You’ll also find a short list of helpful resources that you can use to help create infographics in the classroom with students and fellow forward-thinking educators.
Let’s begin, shall we?
Present information from real-world data gathering and make engaging annual reports
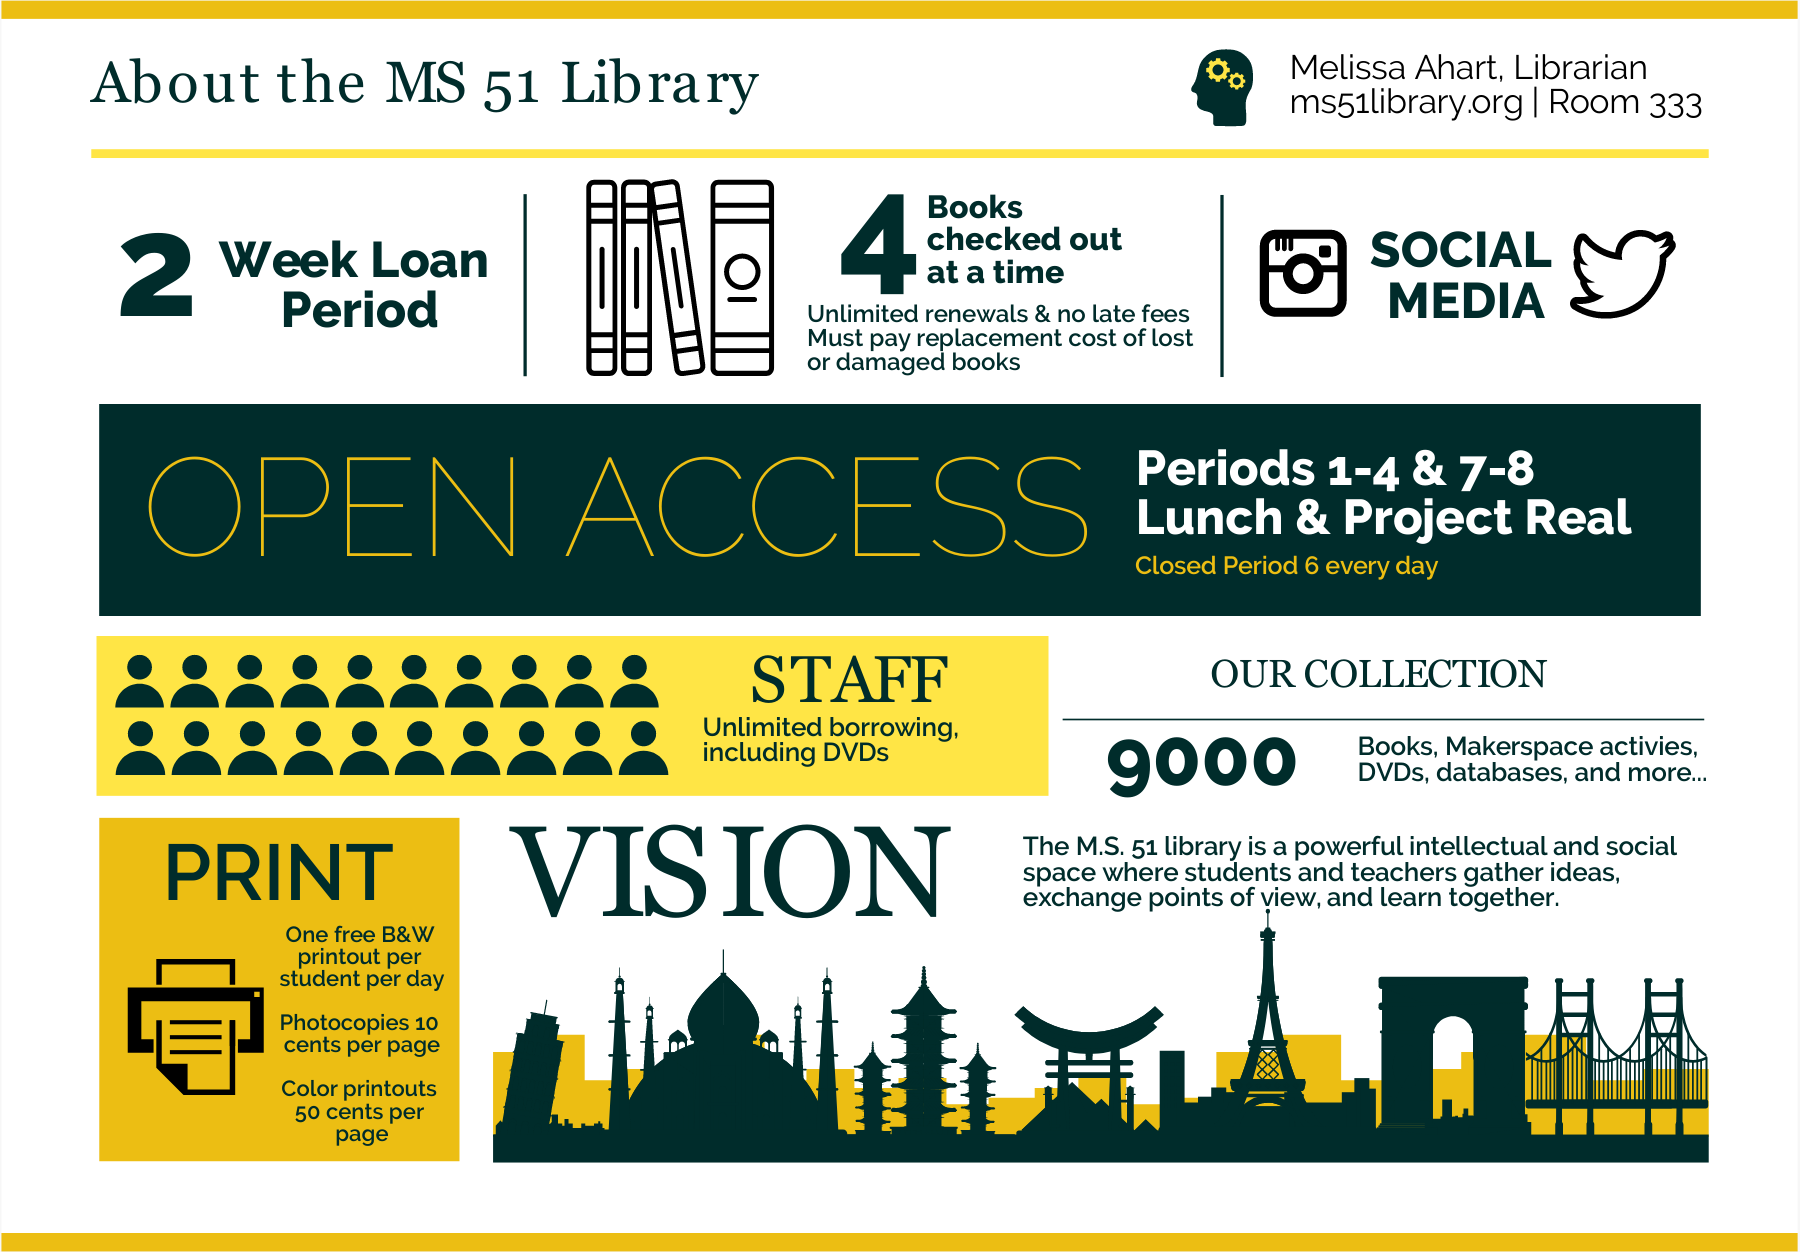
I’m definitely going to make an annual report in infographic form for my admin & staff (and parents) at the end of the year for my library. I might also use them when I give staff PD (professional development) as a summary/take-away for what I’m teaching.
With kids, I’d like to work with math classes on data visualization infographics when they work with statistics or real-world data gathering. – Melissa Ahart
Help students retain information and promote lesson comprehension

I can collaborate with grade team leaders and department heads to implement Easelly into their curriculum.
I would definitely use Easelly as an assessment tool to gain a deeper understanding of what each student understands about a specific topic or lesson. I already have a meeting set up with an educator who is responsible for planning professional developments to teach other teachers on how make their lessons more engaging through visual communication. – Cheriece White
Continuous collaboration with other teachers
I would definitely collaborate with ELA, MATH, and SCIENCE teachers. I try to do a lot of cross-curricular work in my technology classes. Also, I would definitely go over the (infographic) planning process with the students. They would benefit from understanding that all projects start first with a plan and a specific goal in mind.
I would love to first share my infographic with my colleagues. Perhaps I could first start with a small introductory project with their classes and then spur their interest. Once they see how accessible it is, I think they will definitely be more interested in using this tool. – William Kong
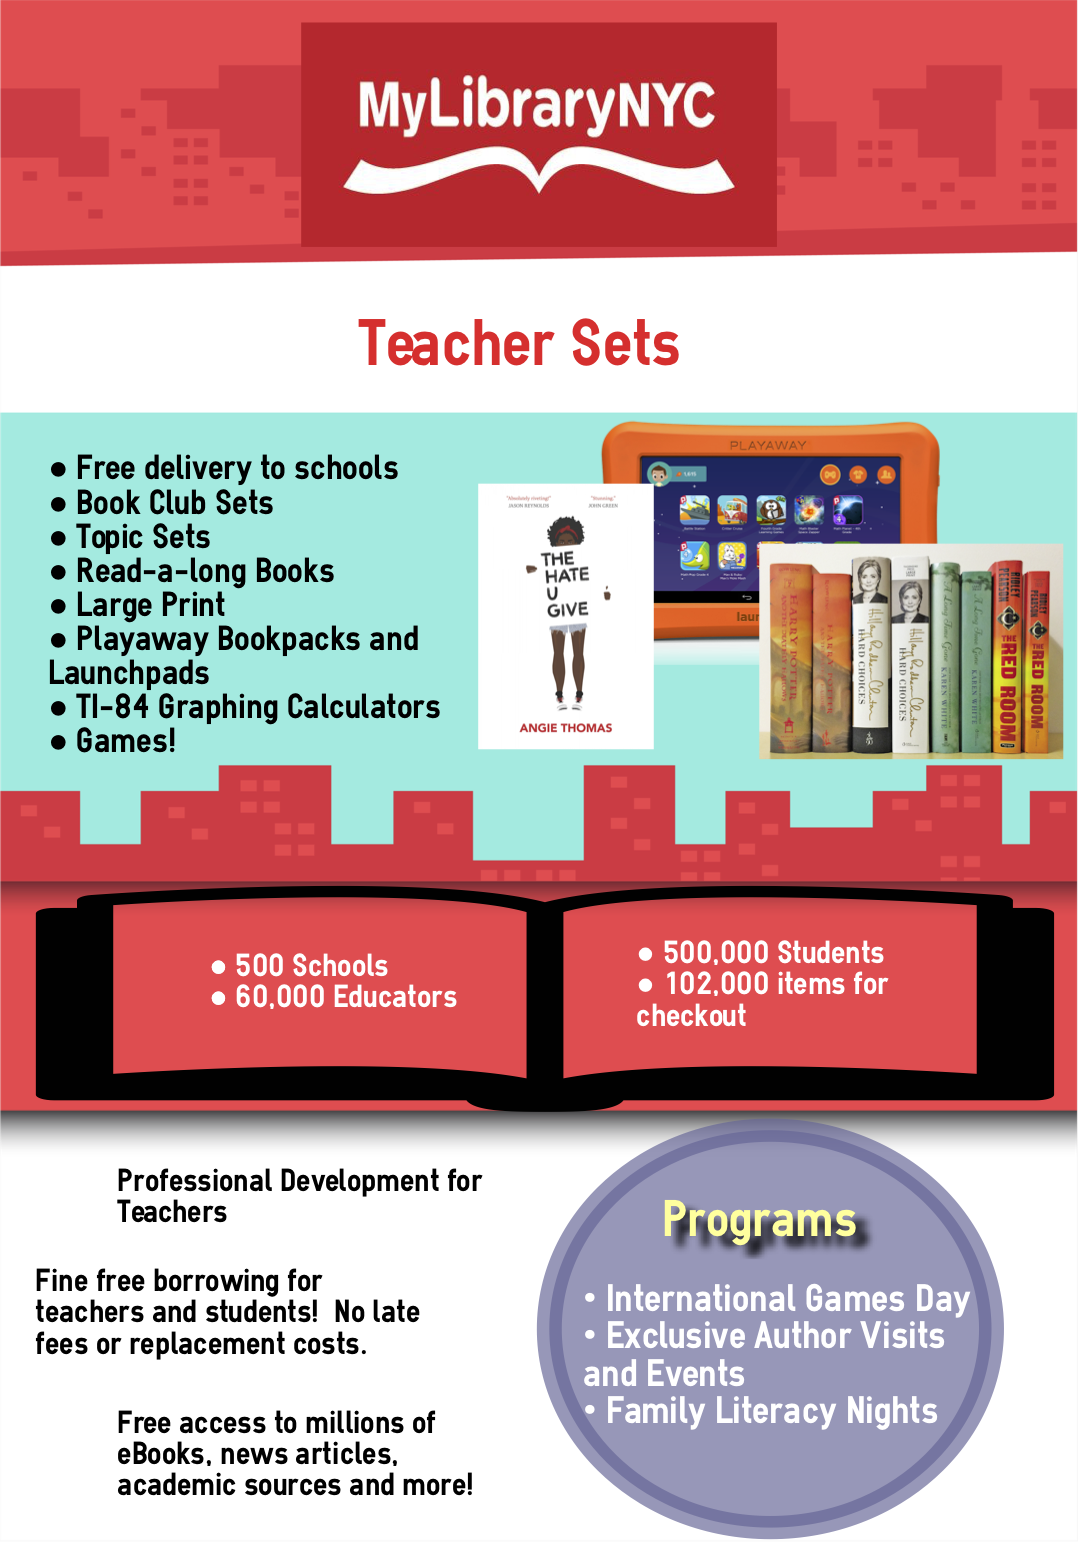
I will share the Infographic Planning Sheet with the educators I work with at PDs. They can adapt the sheet to use in their collaborative instructional practice with students. I will also provide ideas to educators about how they can use the infographics to promote their programming, collection, and best practices. – Leanne E
Ready to reinvement education and promote visual literacy?
There’s a growing consensus around the world that existing educations systems need a serious rehaul. If you’re an educator and you want to join the movement in reimagining school and how knowledge is shared, here are some resources you can use in promoting visual learning in class:
- Watch: How to Make Infographics with Students the Easy Way
- Read: Effective Infographic Design Checklist
- Read: Infographics Can Be Used for Any Subject
- Read: 10 Great Examples of Using Infographics for Education