
Most of the time, detailed descriptions are adequate.
But when you need to communicate ideas and information quickly, process infographic templates will come in handy.
From teaching small business owners how to file taxes online to sharing how a fertility treatment works to hopeful couples, using process infographics is a great way to reduce complexity and delight your audience with a clear, engaging presentation.
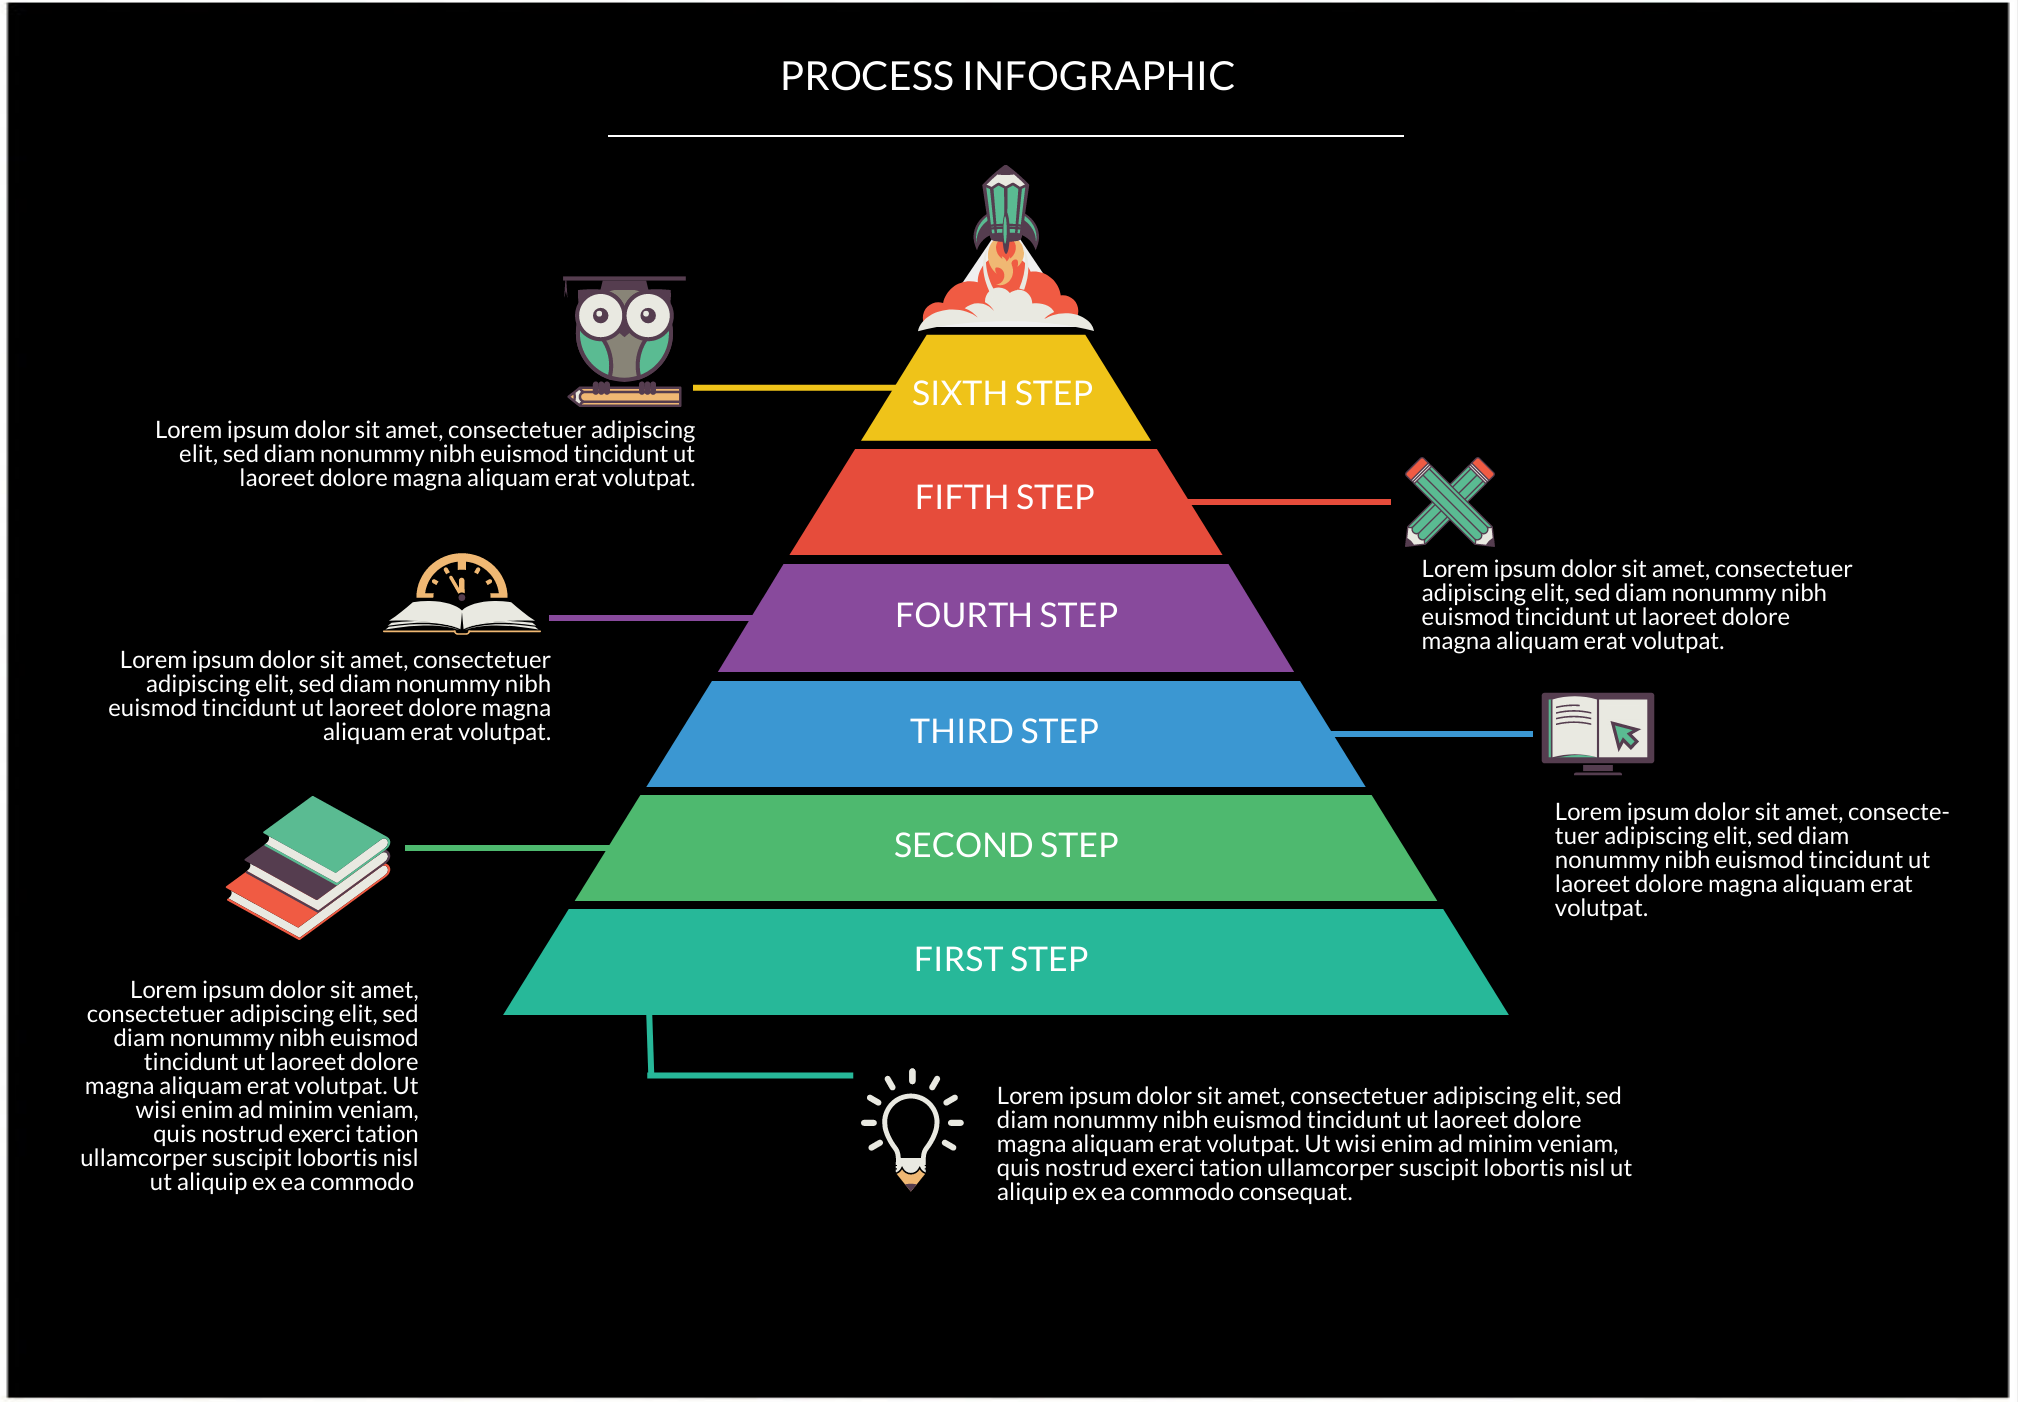
What is a process infographic?
A process infographic is a type of infographic that helps explain steps; it’s somehow similar to the flowchart. They’re also called decision-making infographics because they can influence decisions based on the information you’re presenting.
When to use process infographics?
Use process infographics to simplify and break down a complex process into easy-to-digest steps or pieces of information.
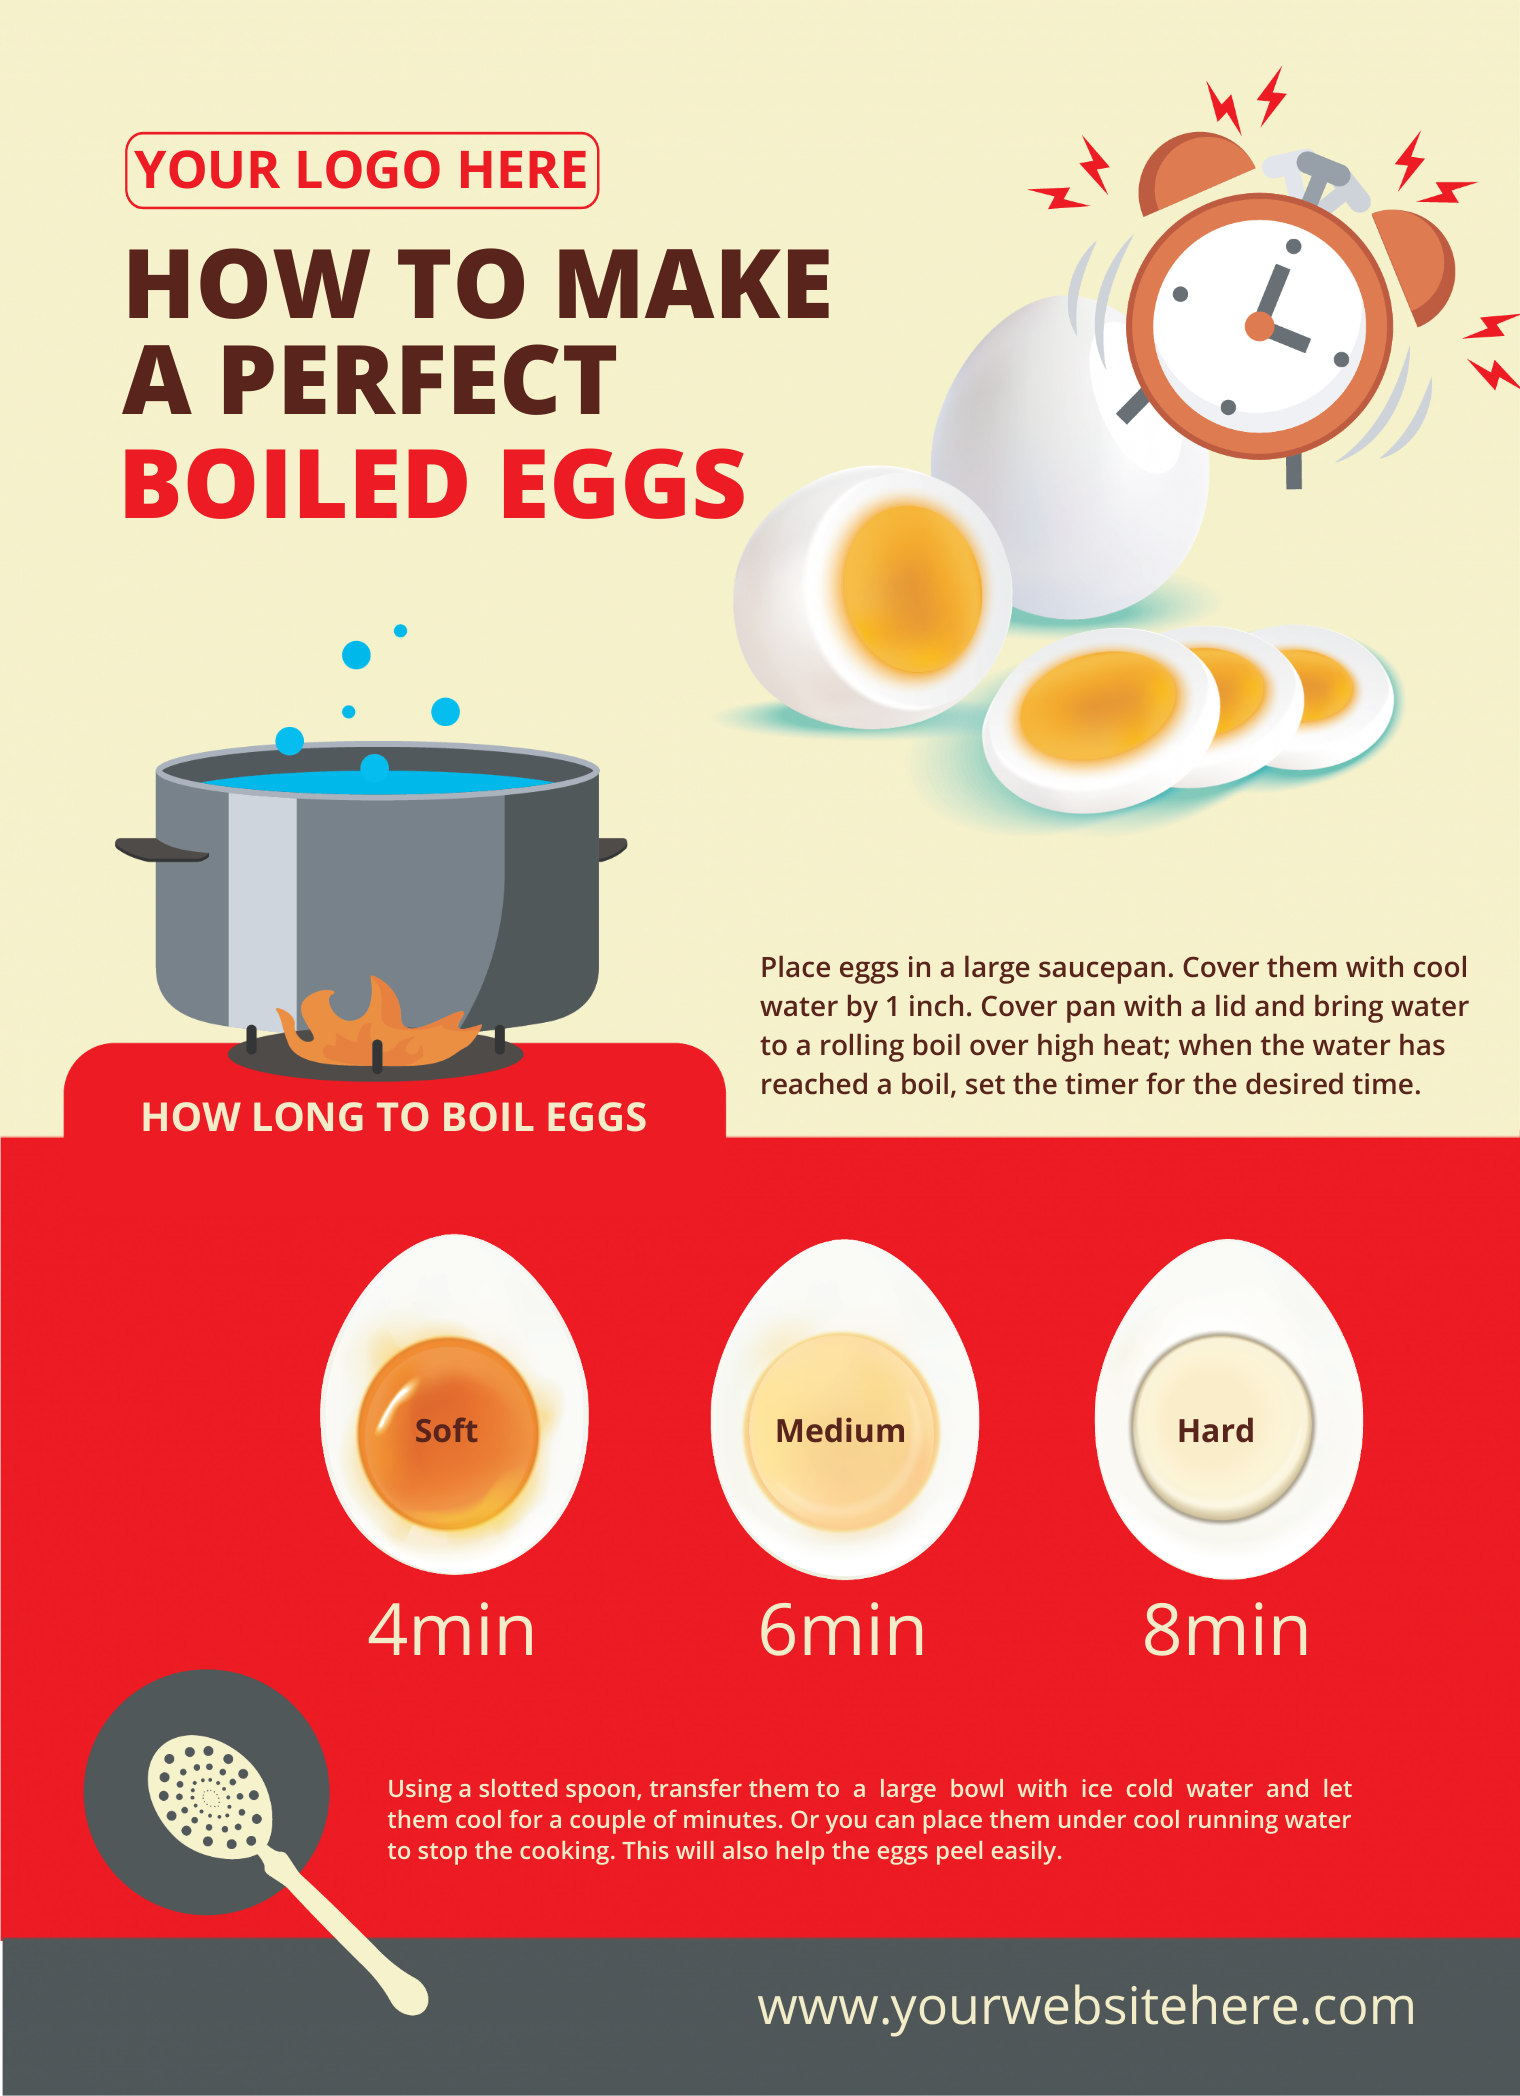
As one of the most common infographic formats, process infographics are ideal for employee trainings, recipes, science lessons, project planning, and process audits.
Process infographic tips and best practices
Make your process infographic more visually appealing and easy to understand with the following best practices.
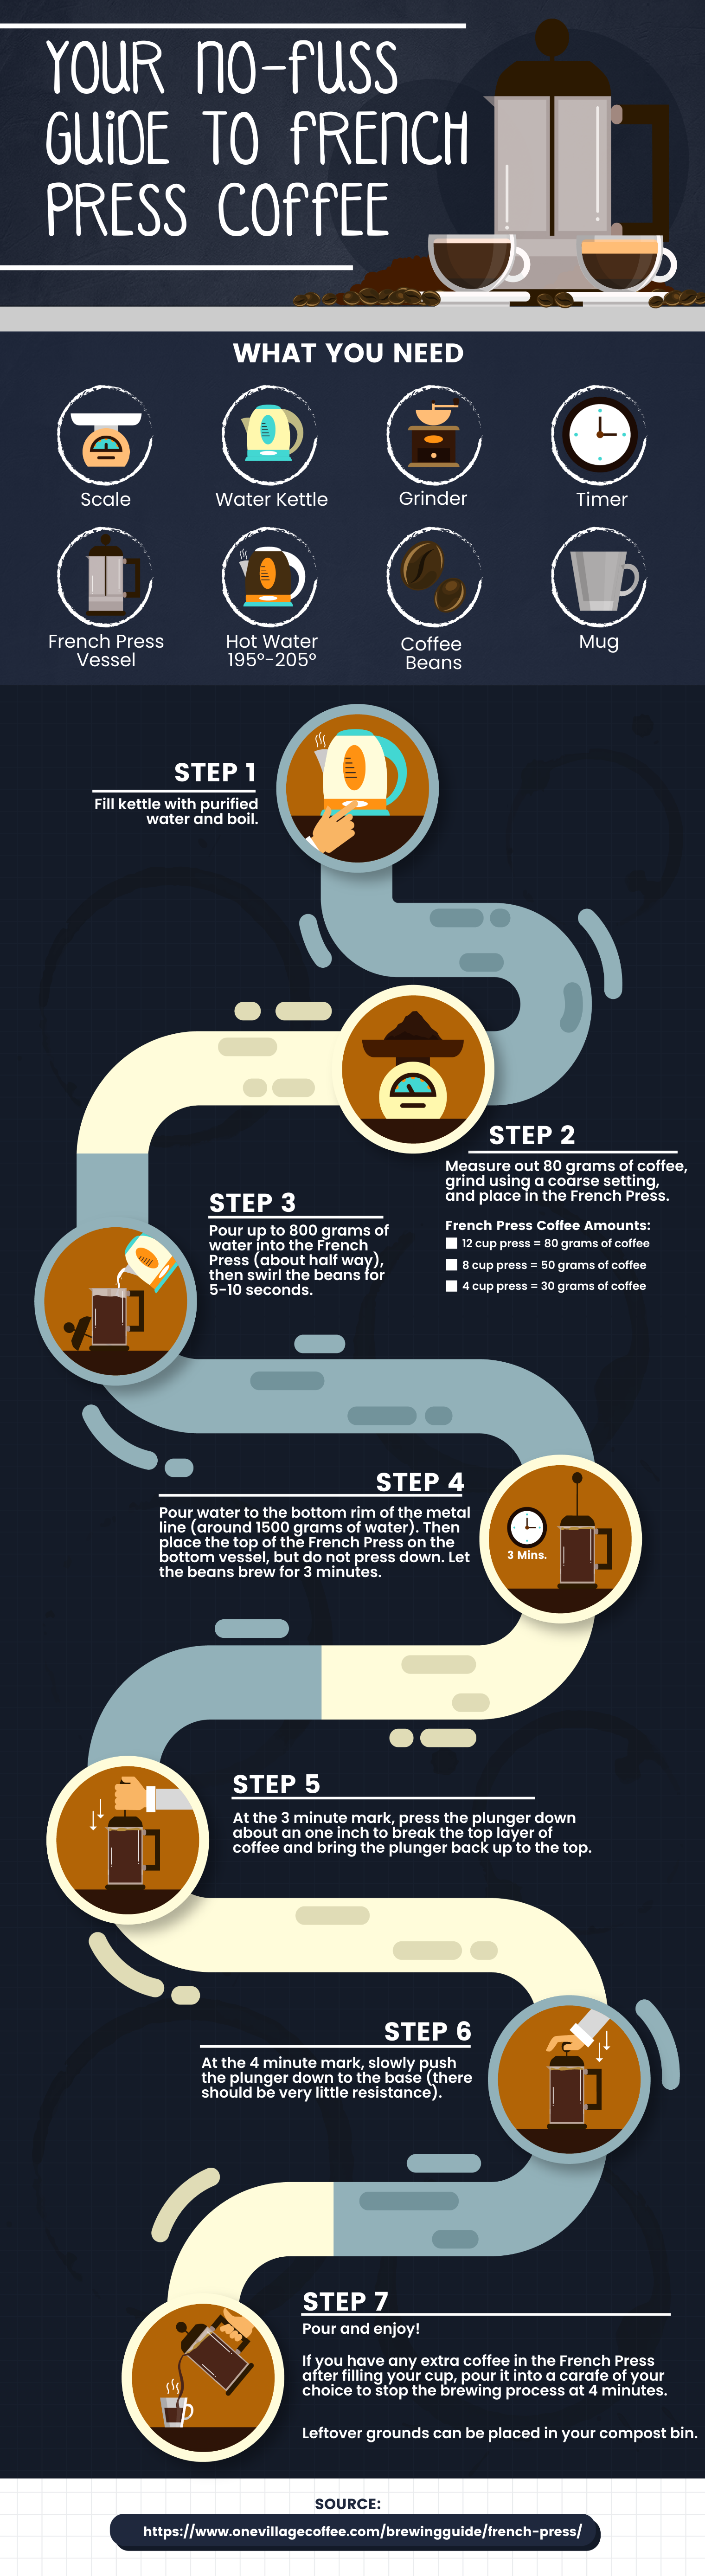
1. Use icons and illustrations to visualize each step in the process.
Images are definitely worth a thousand words. By using visuals, you can say more with less.
2. Assign a color for each phase or step in the process.
Color-coding can help make your process infographic easier to follow.
3. Use arrows or lines to direct readers to the next step.
These visual cues will guide your readers’ eyes and avoid information overload.
4. Highlight cyclical processes with a circular layout.
Don’t forget to point out the start and endpoints of the cycle in your infographic.

5. Add numbers to emphasize each step in the process.
You can combine this approach with the color-coding tip mentioned earlier.

Process infographic templates you can customize in minutes
Keep scrolling for process infographic templates that you can customize, edit, and download using Easelly’s infographic maker tool.
Step-by-step guide on how to carve Halloween pumpkins
Process infographic explaining how ketosis works
Infographic explaining the stages of microbiological research
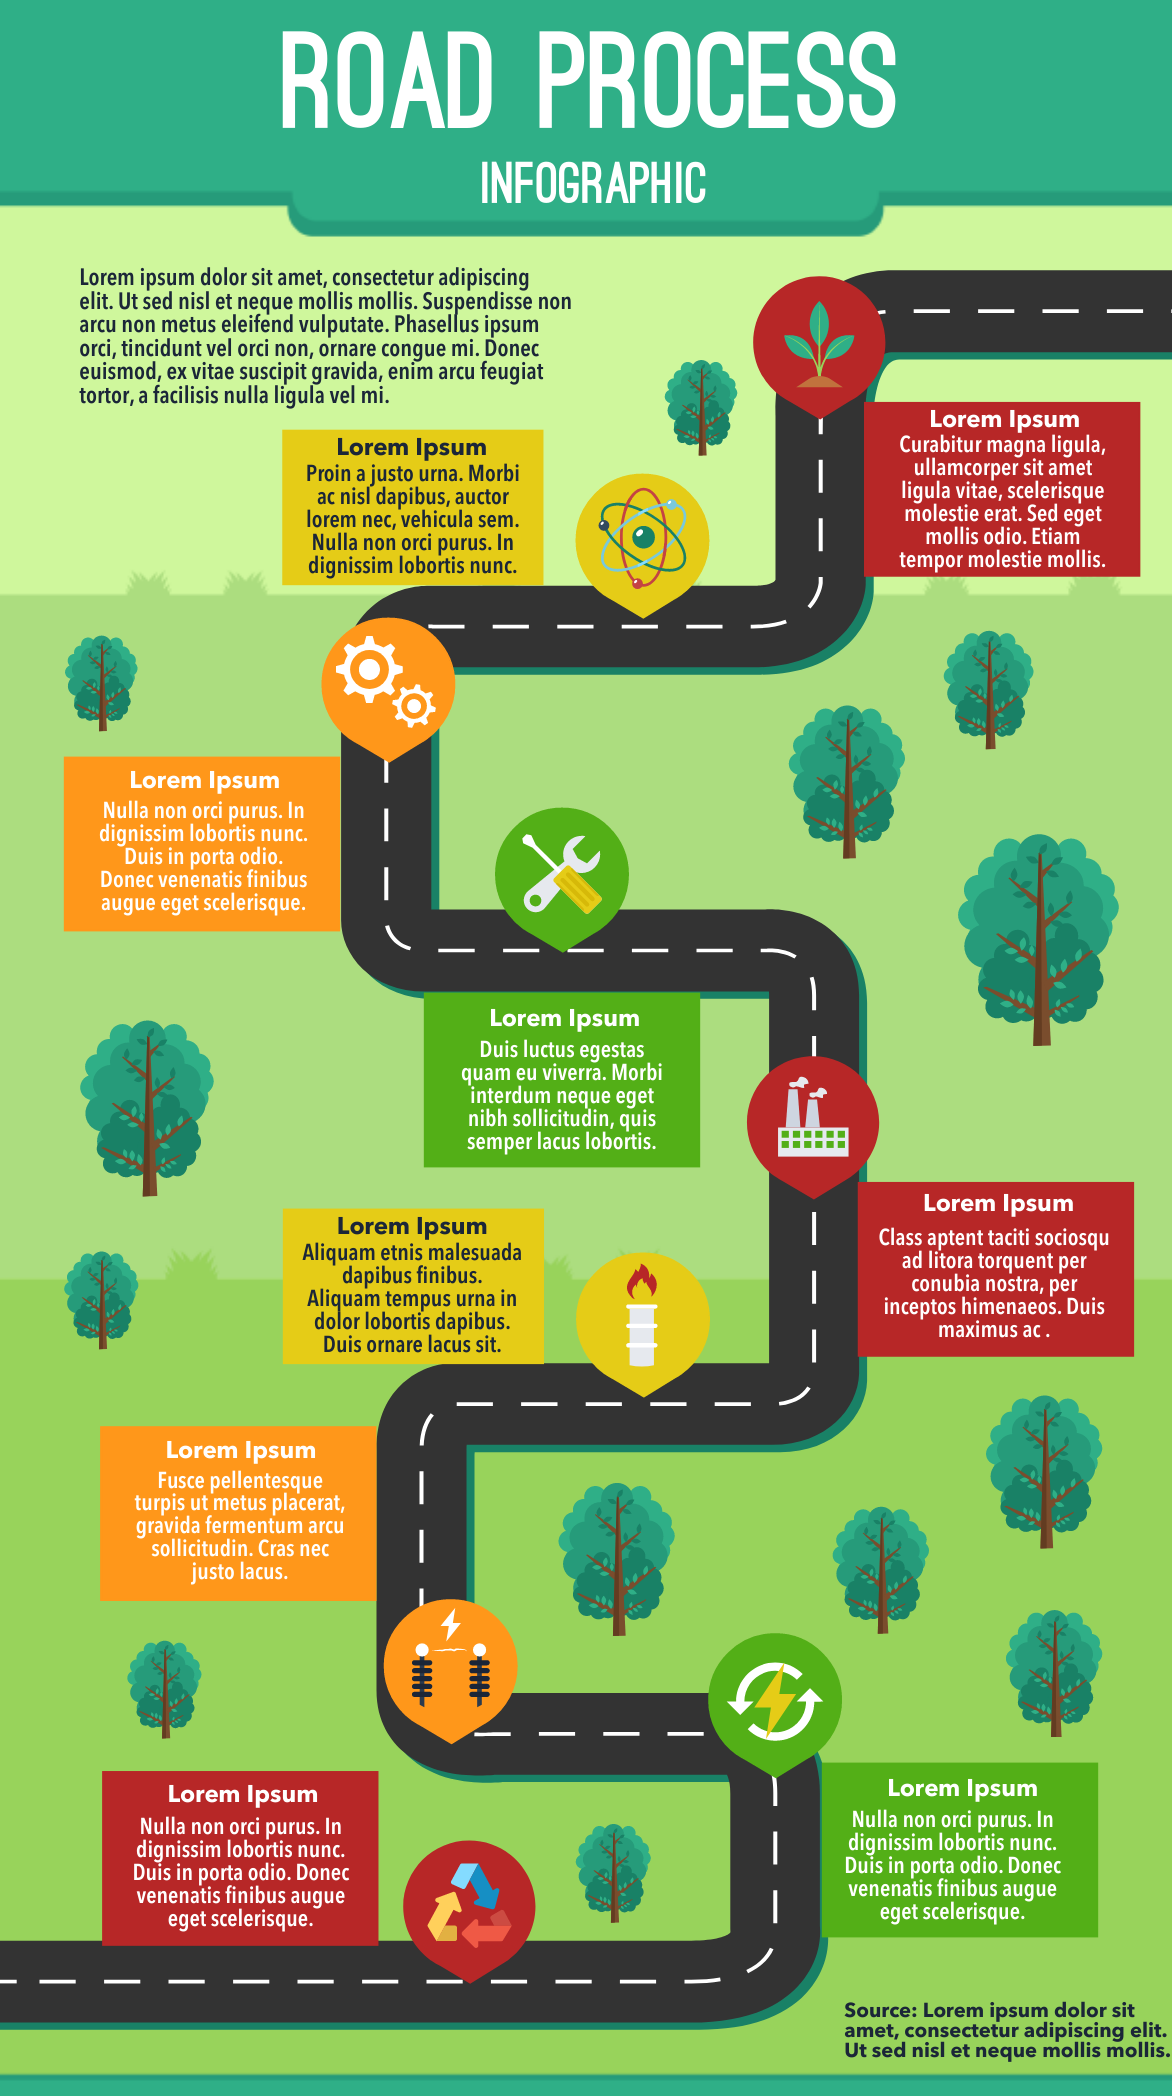
Road process infographic template
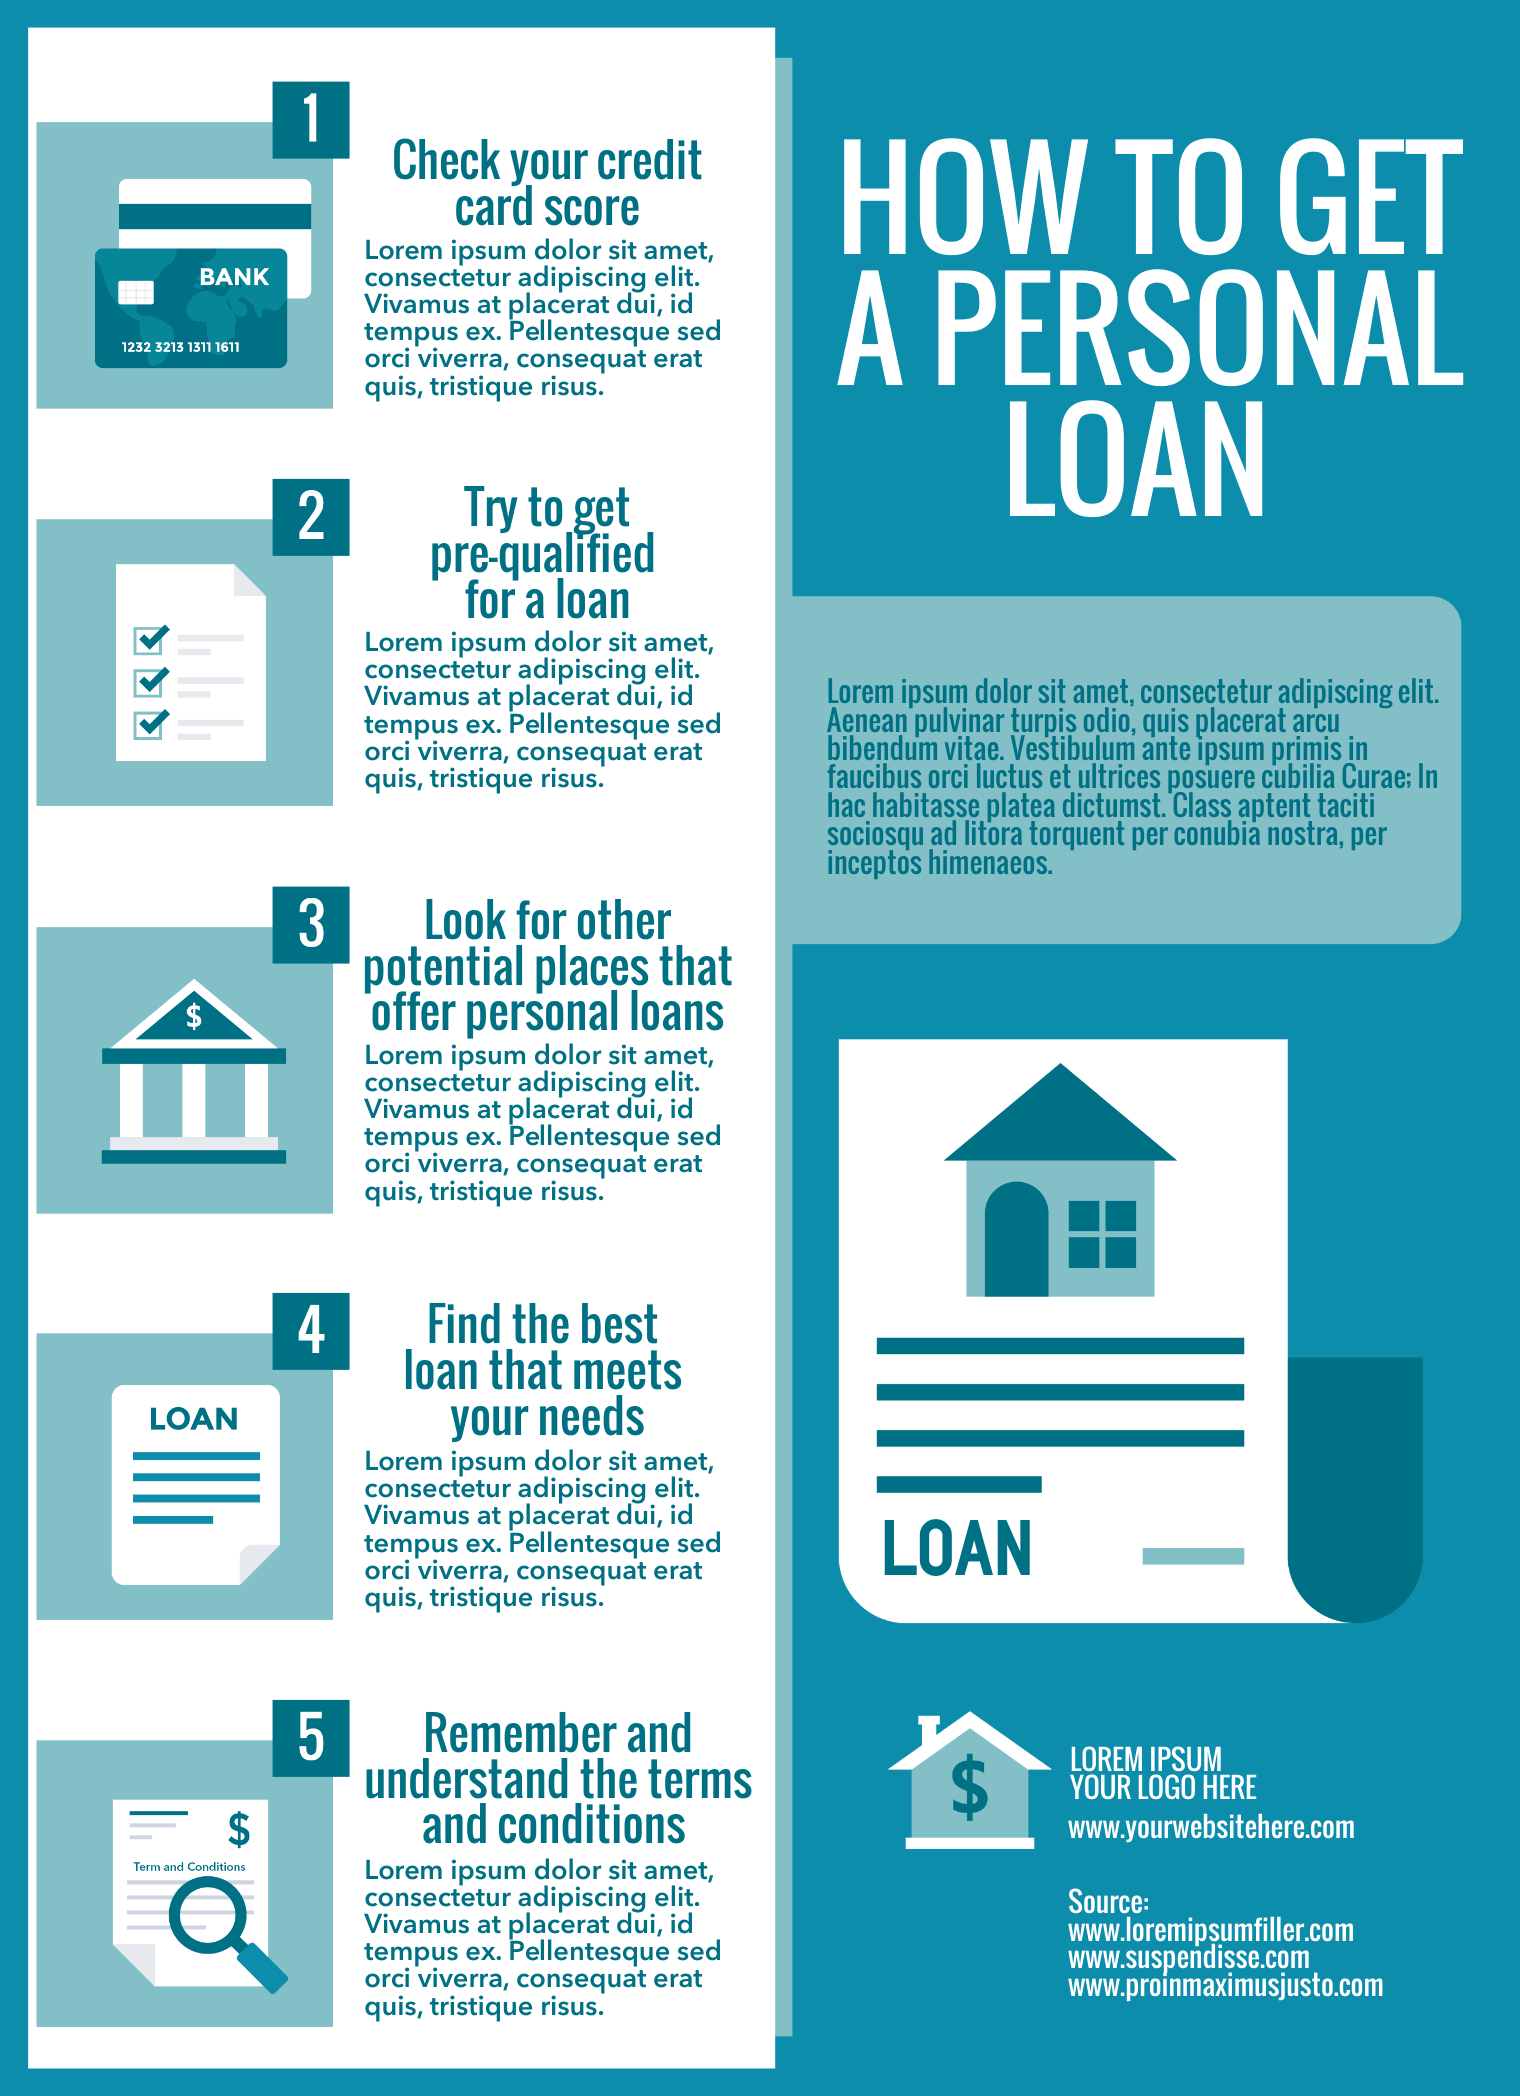
Step-by-step infographic on how to get a personal loan
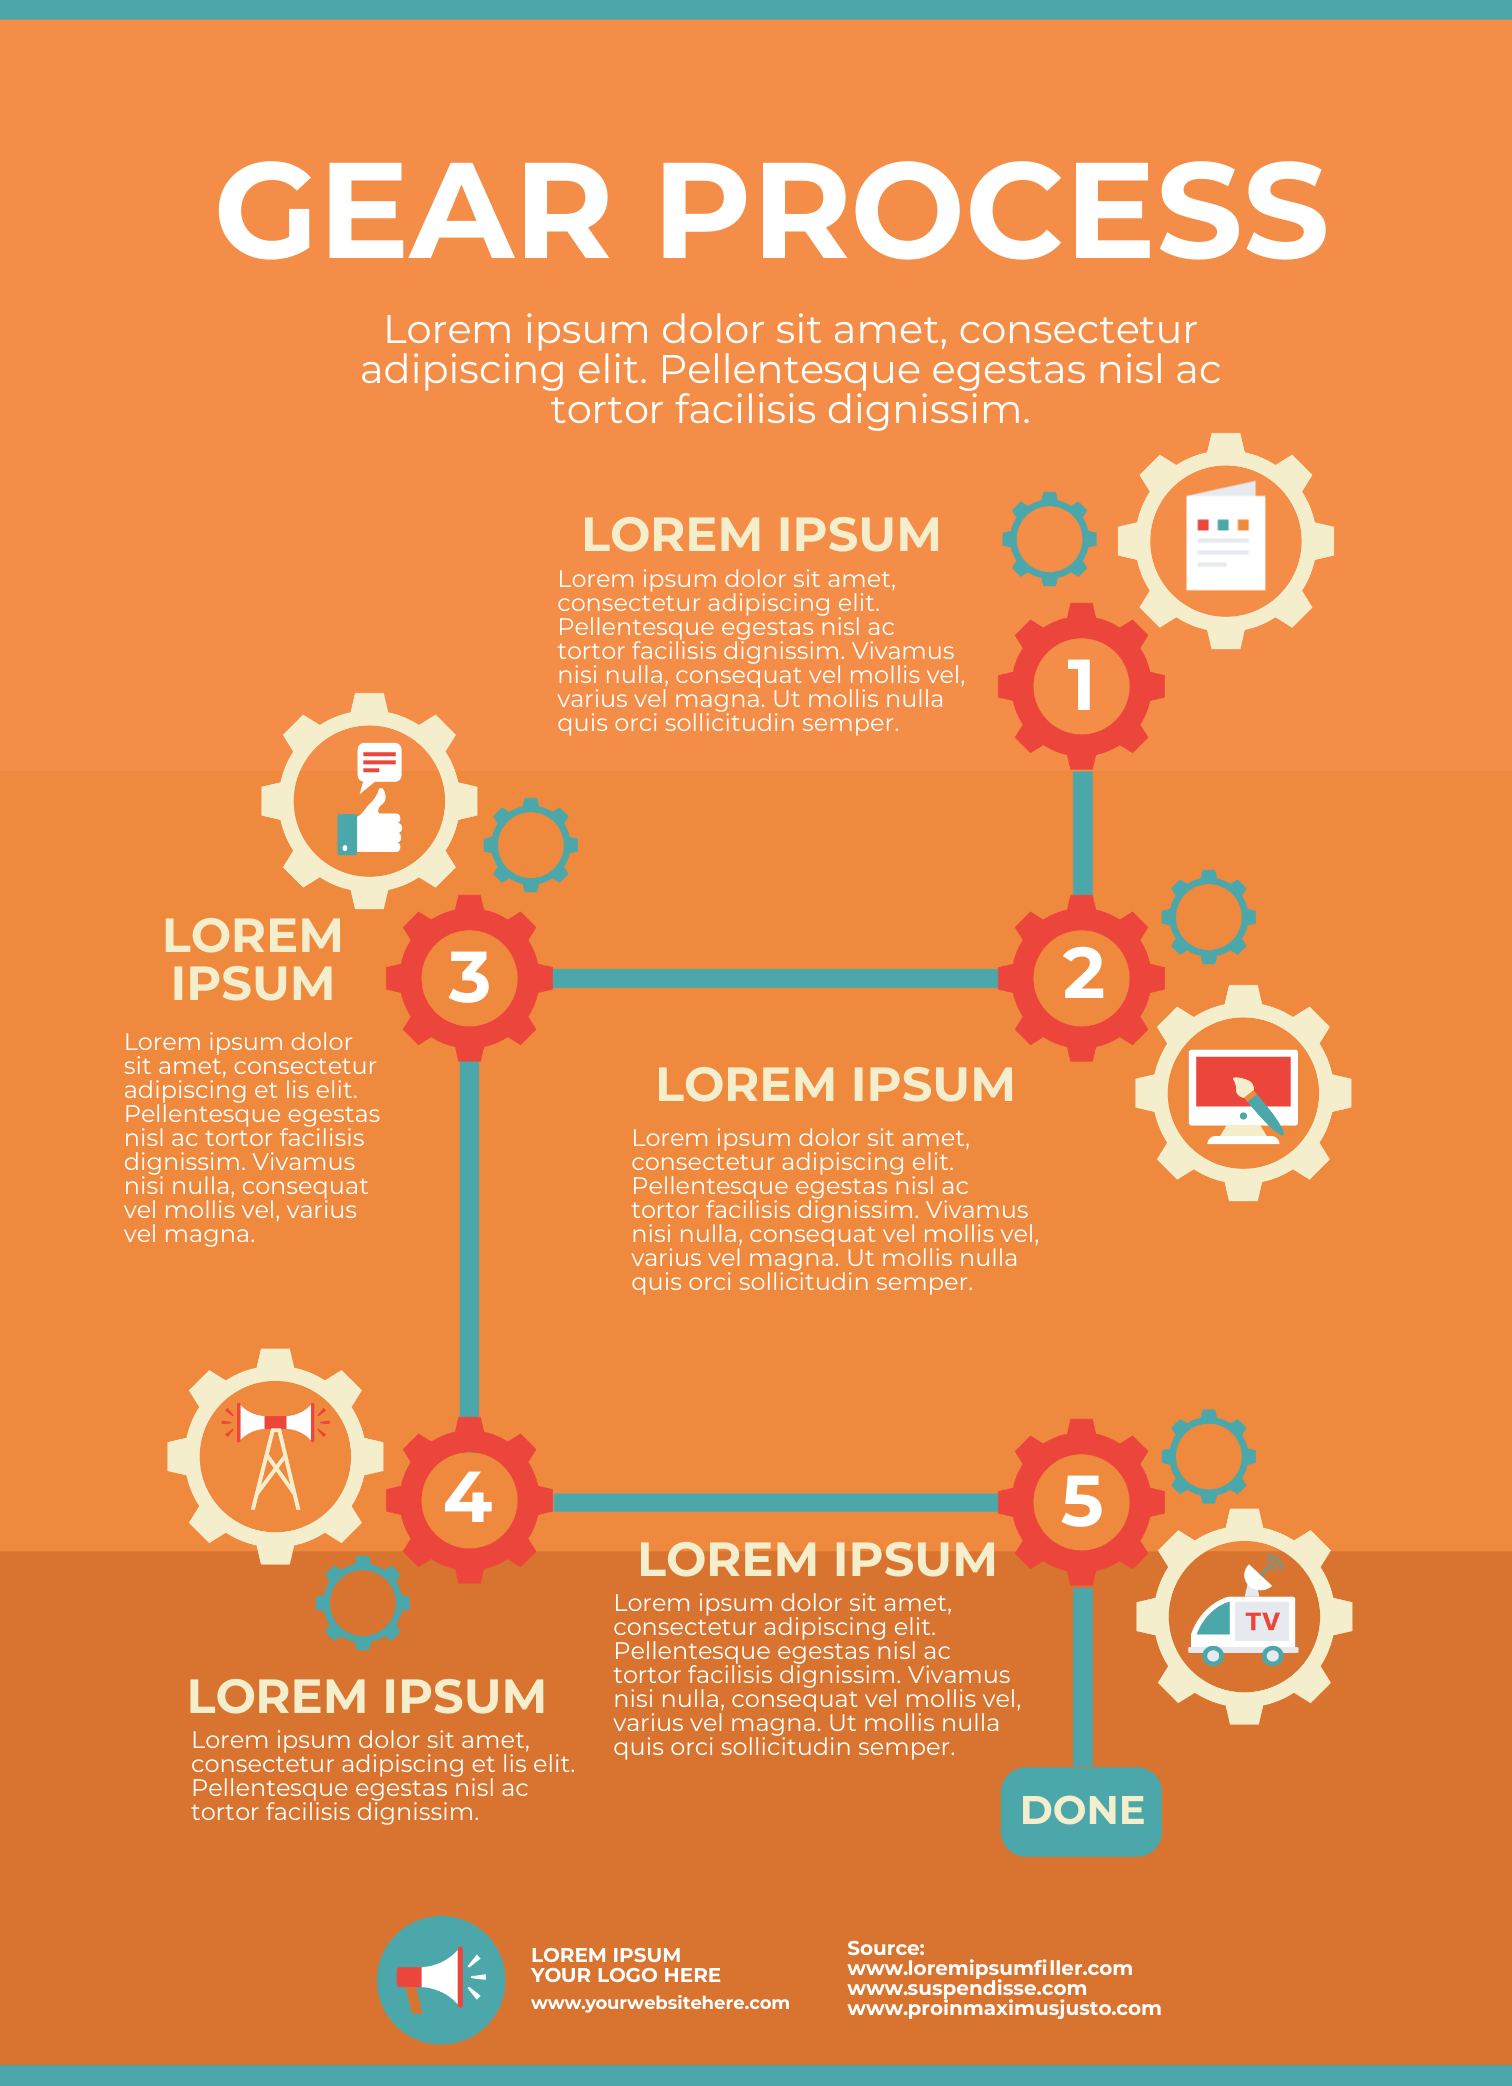
Gear process infographic template
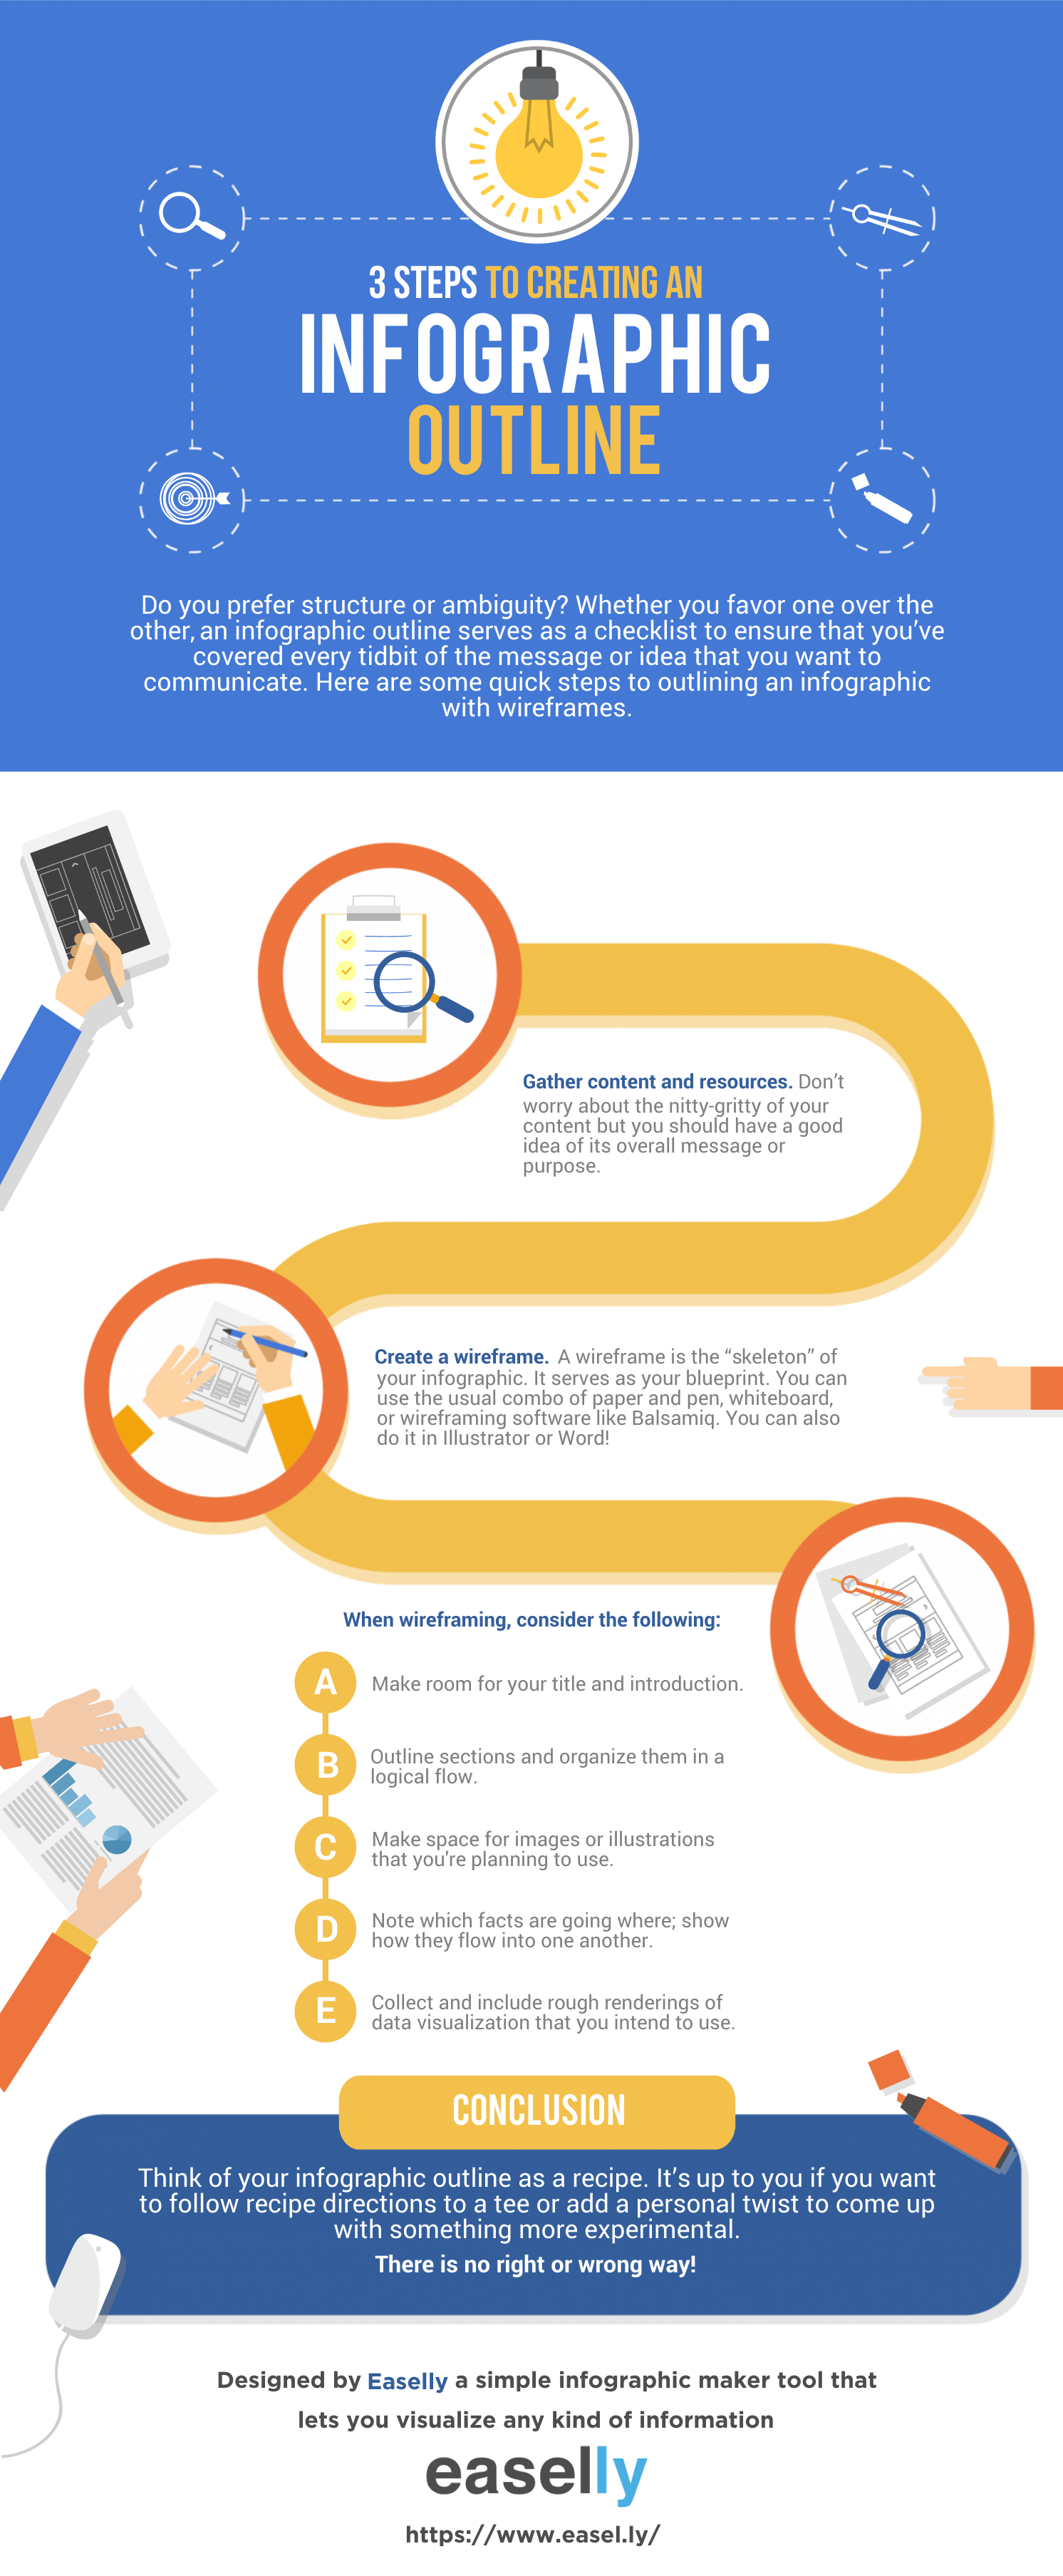
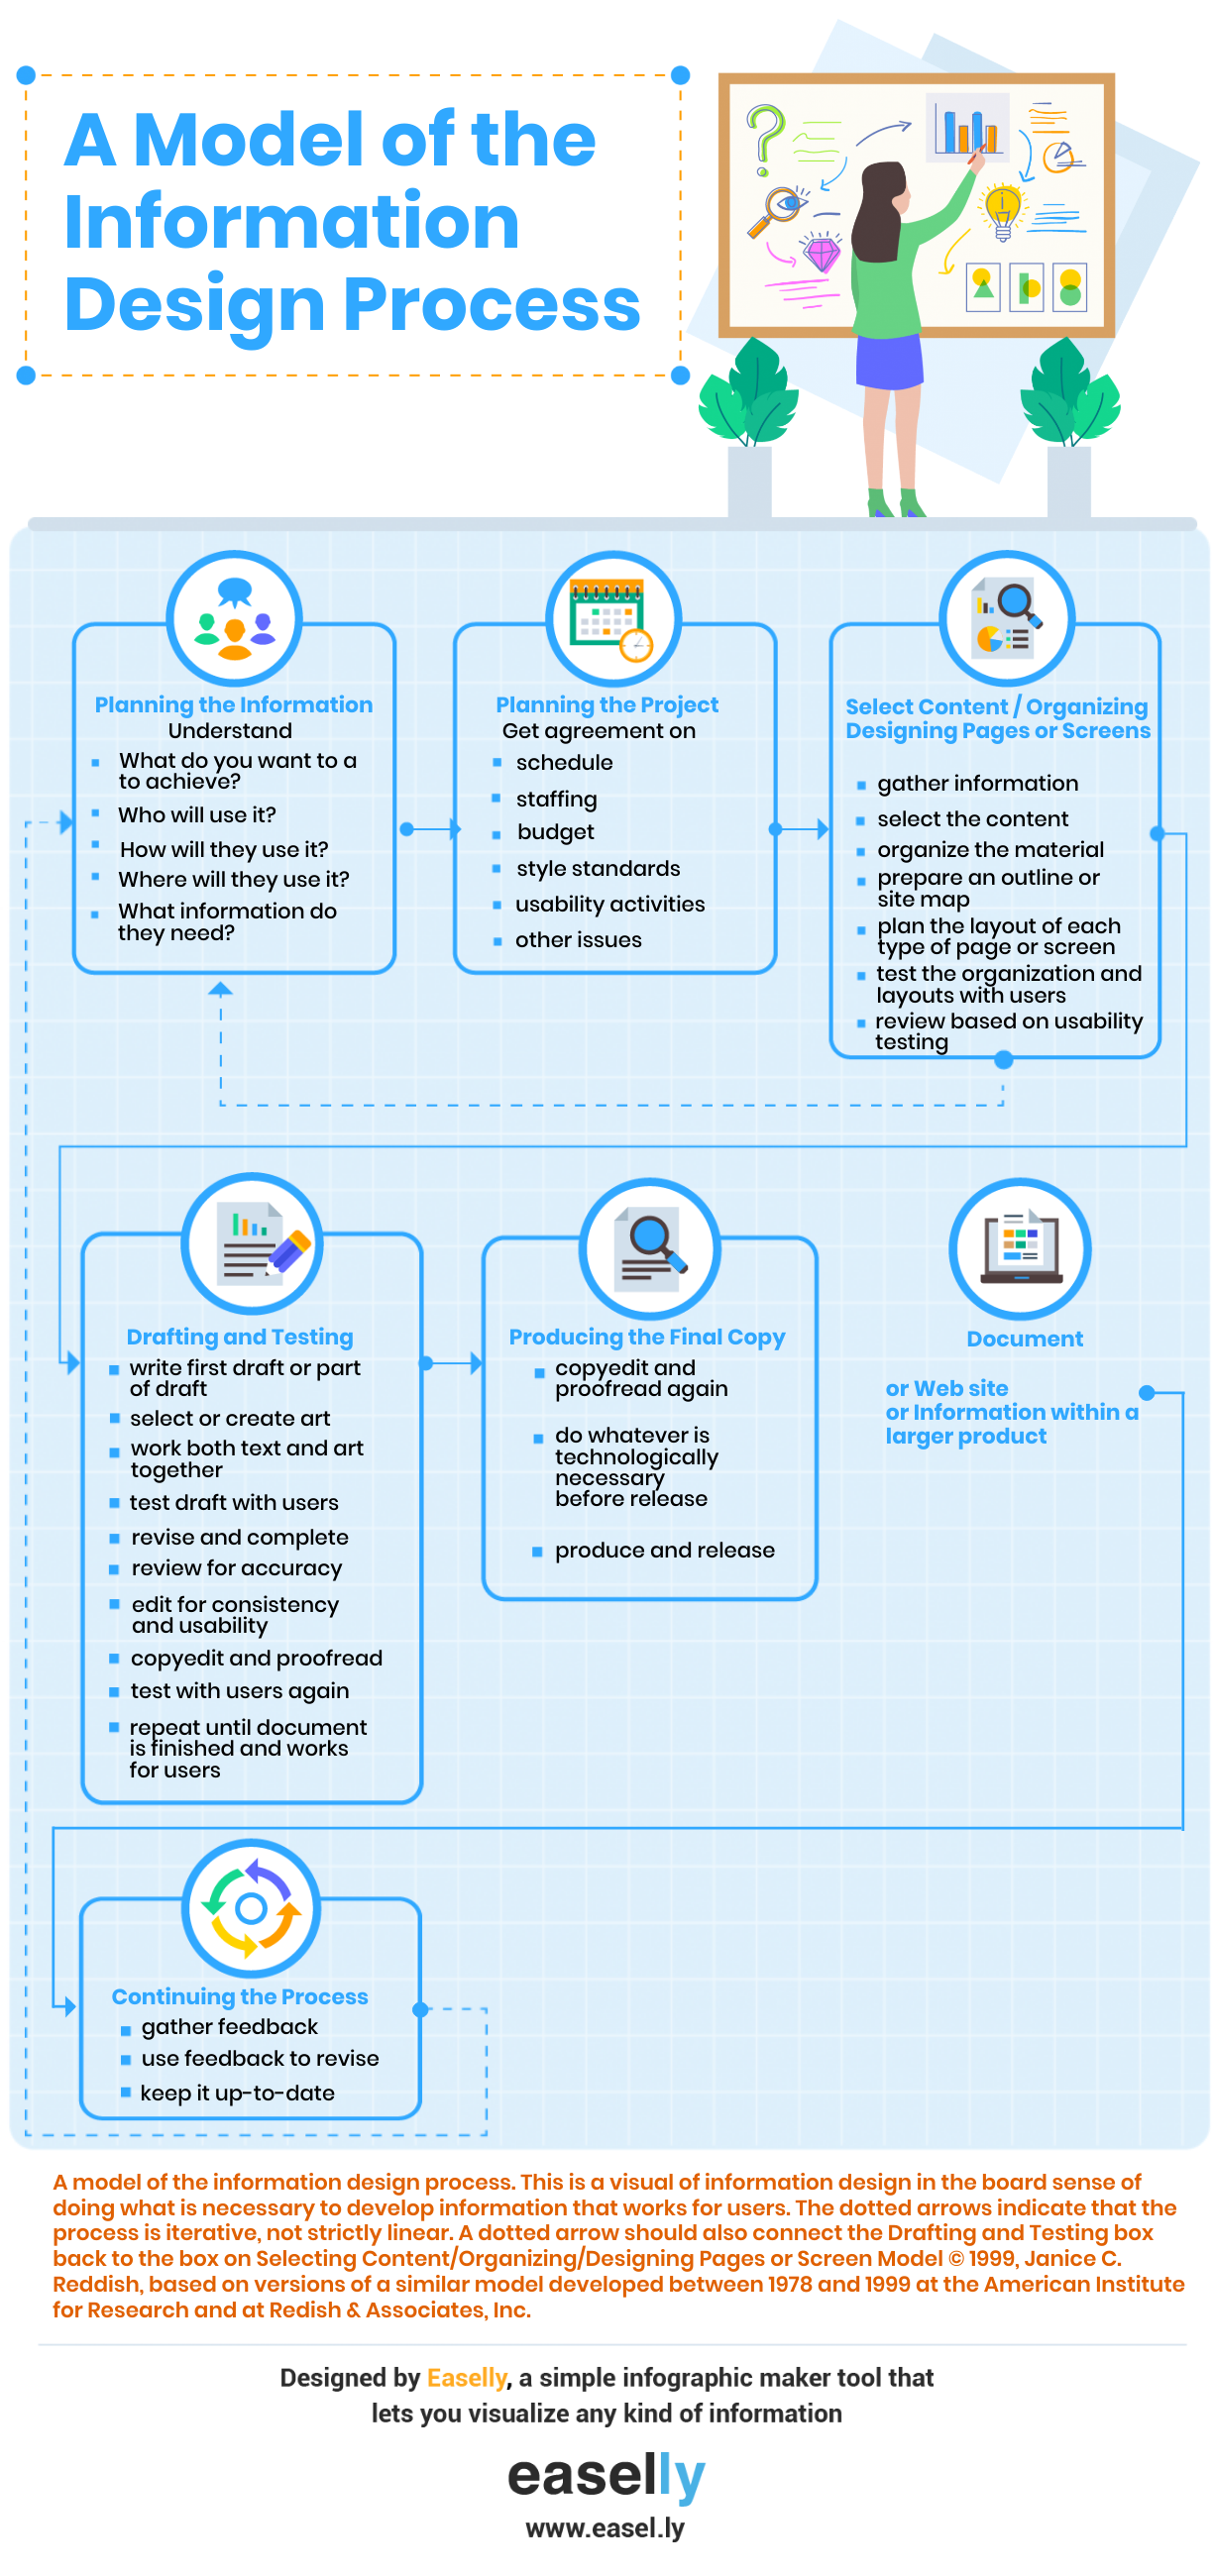
A flowchart about the information design process
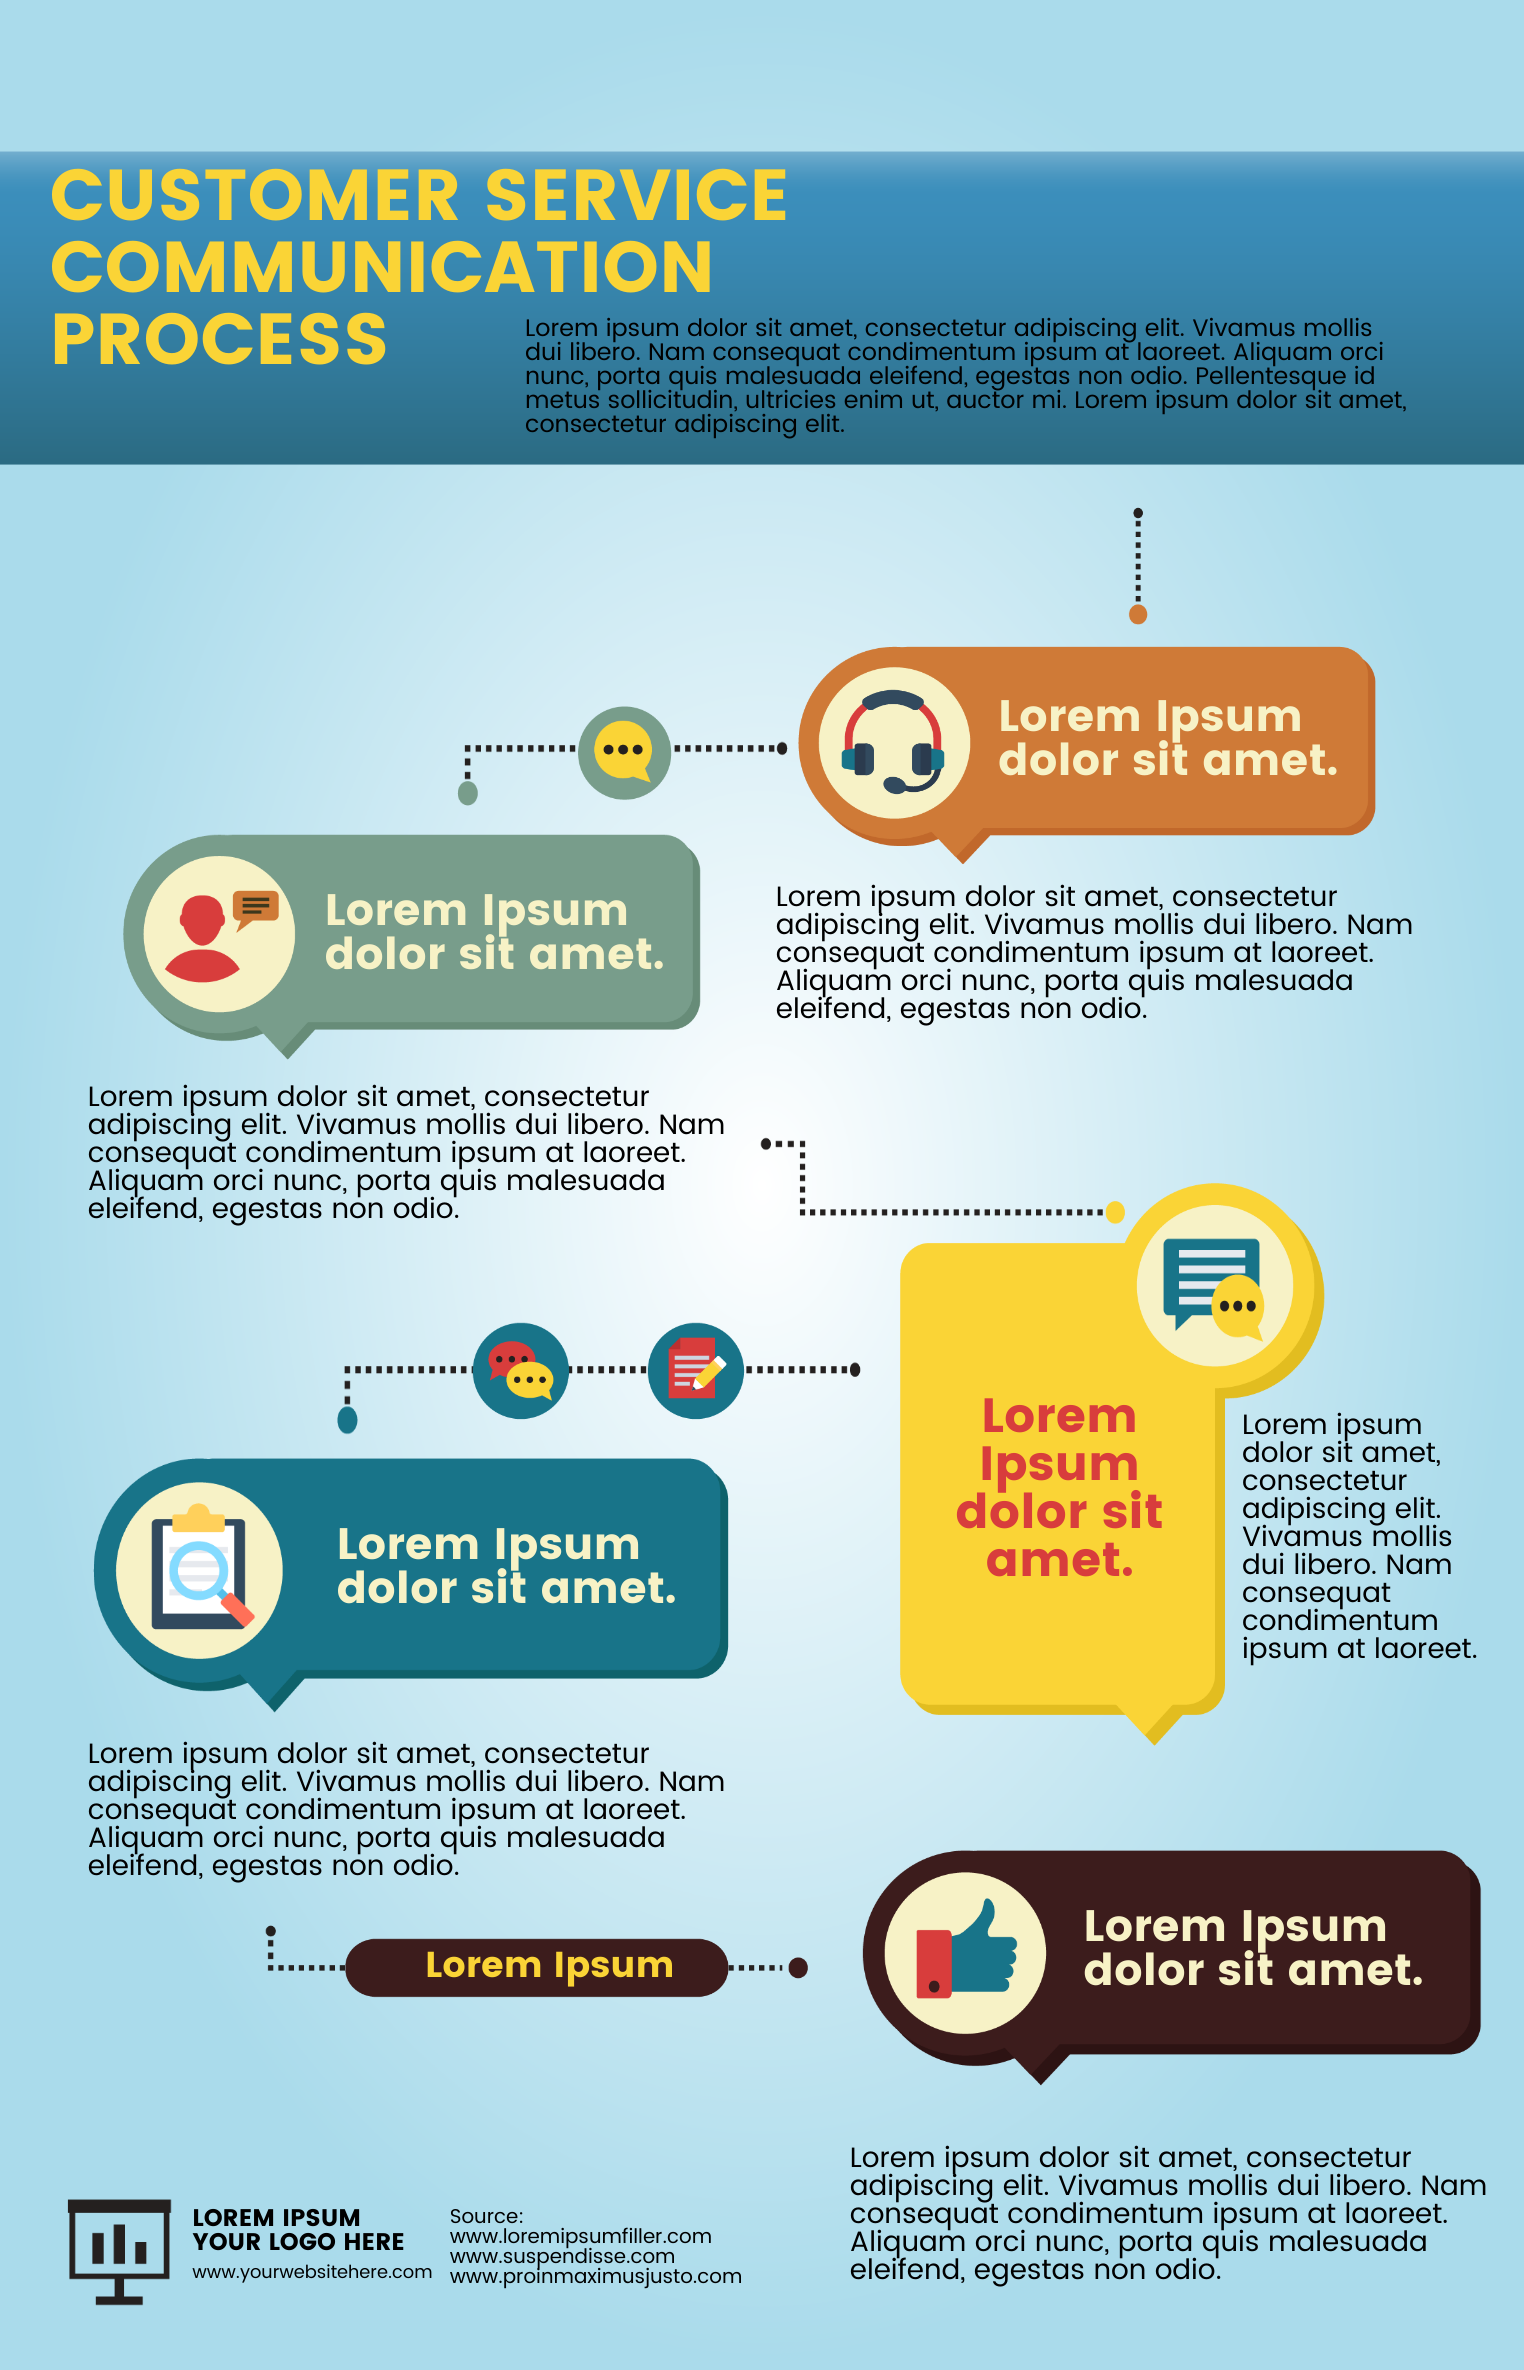
A flowchart explaining the customer service communication process
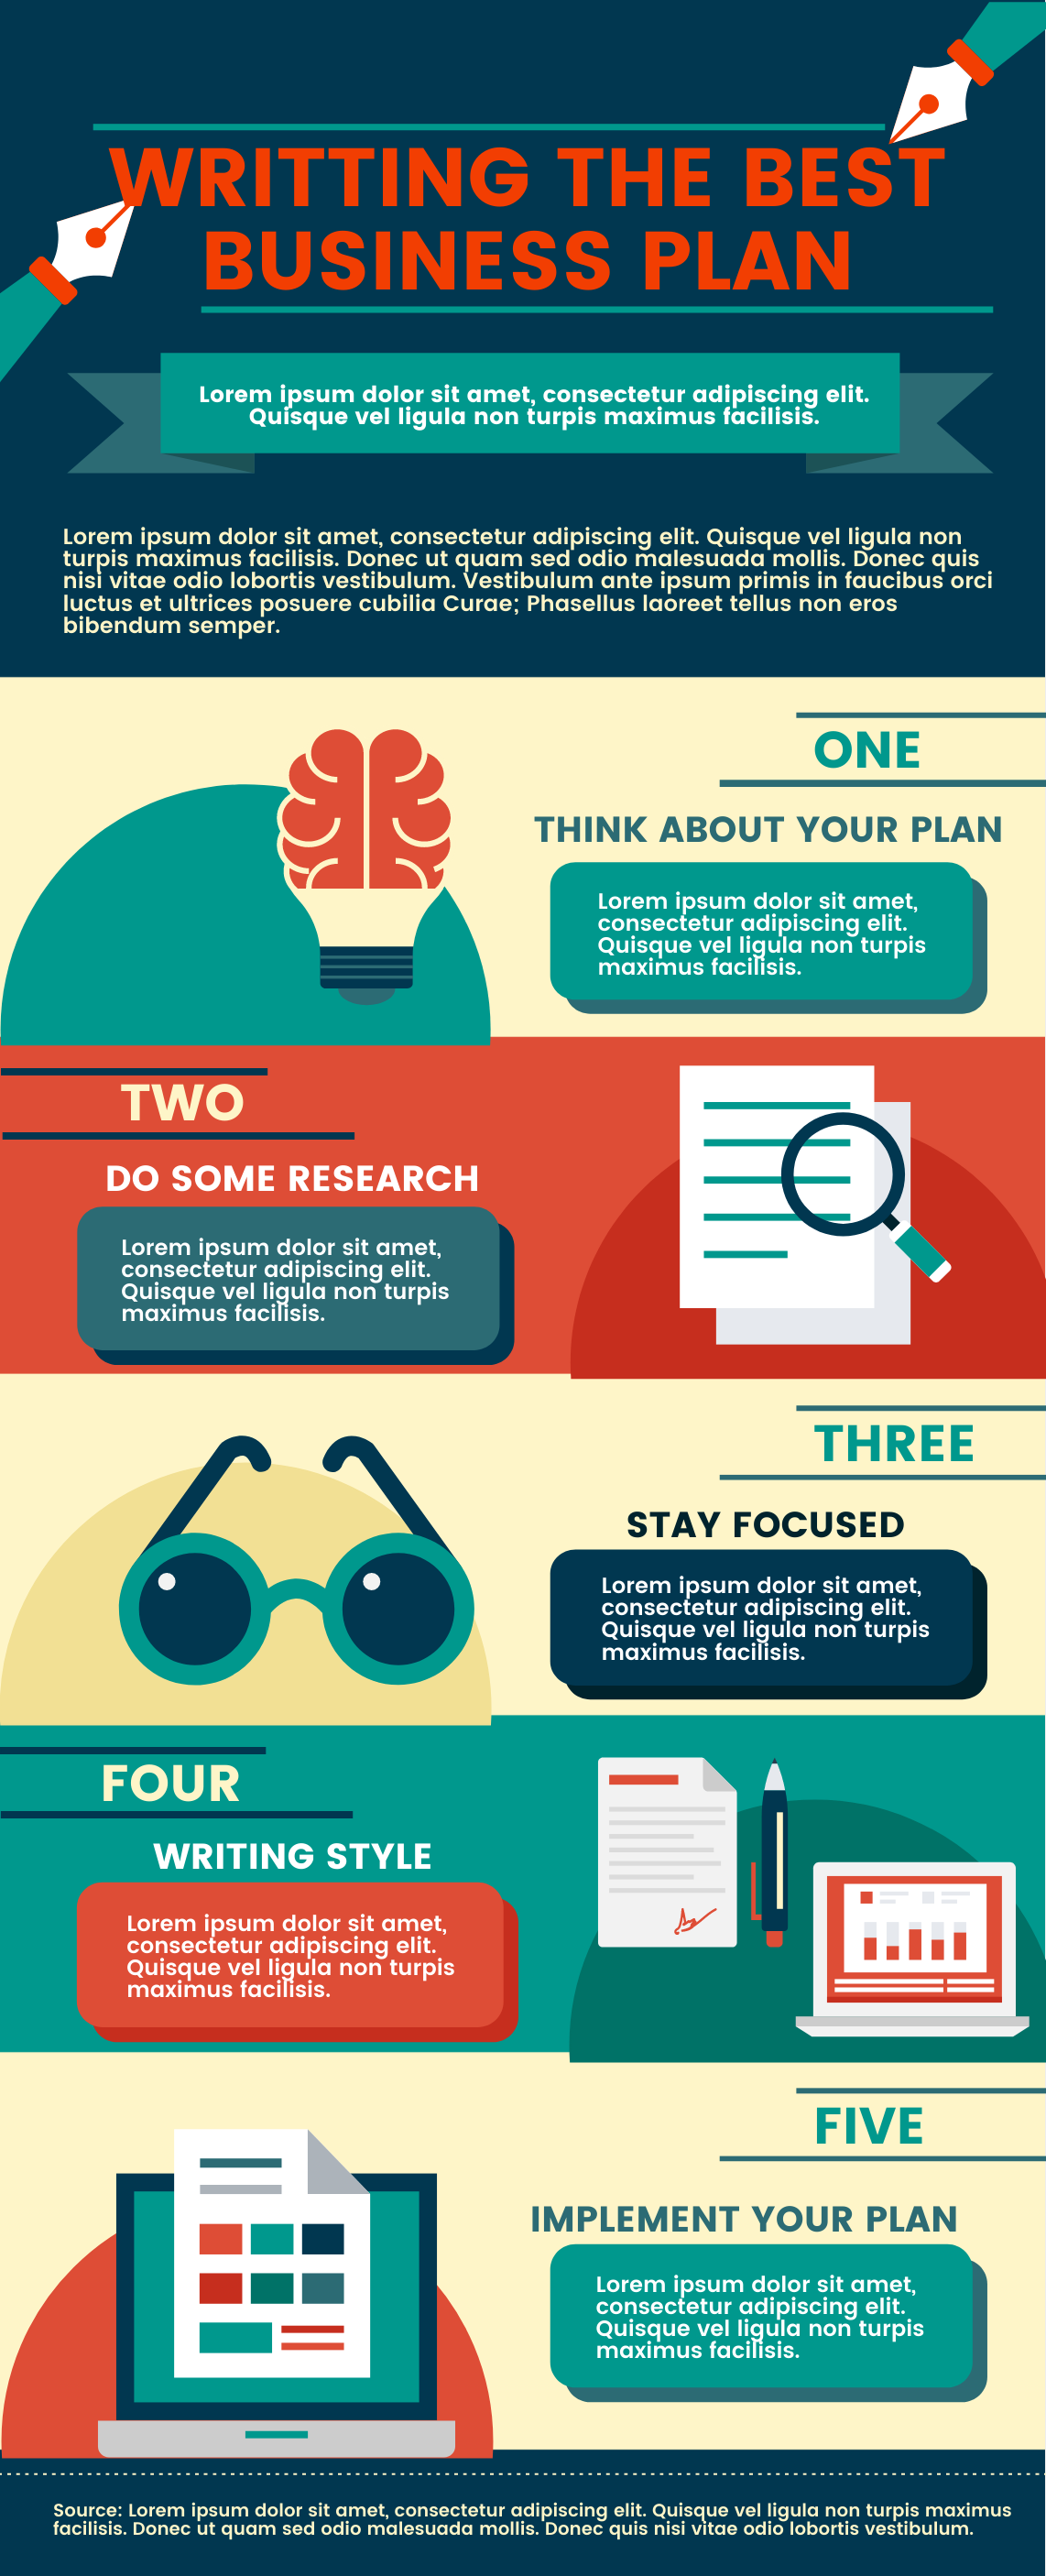
A step-by-step infographic about business plan creation
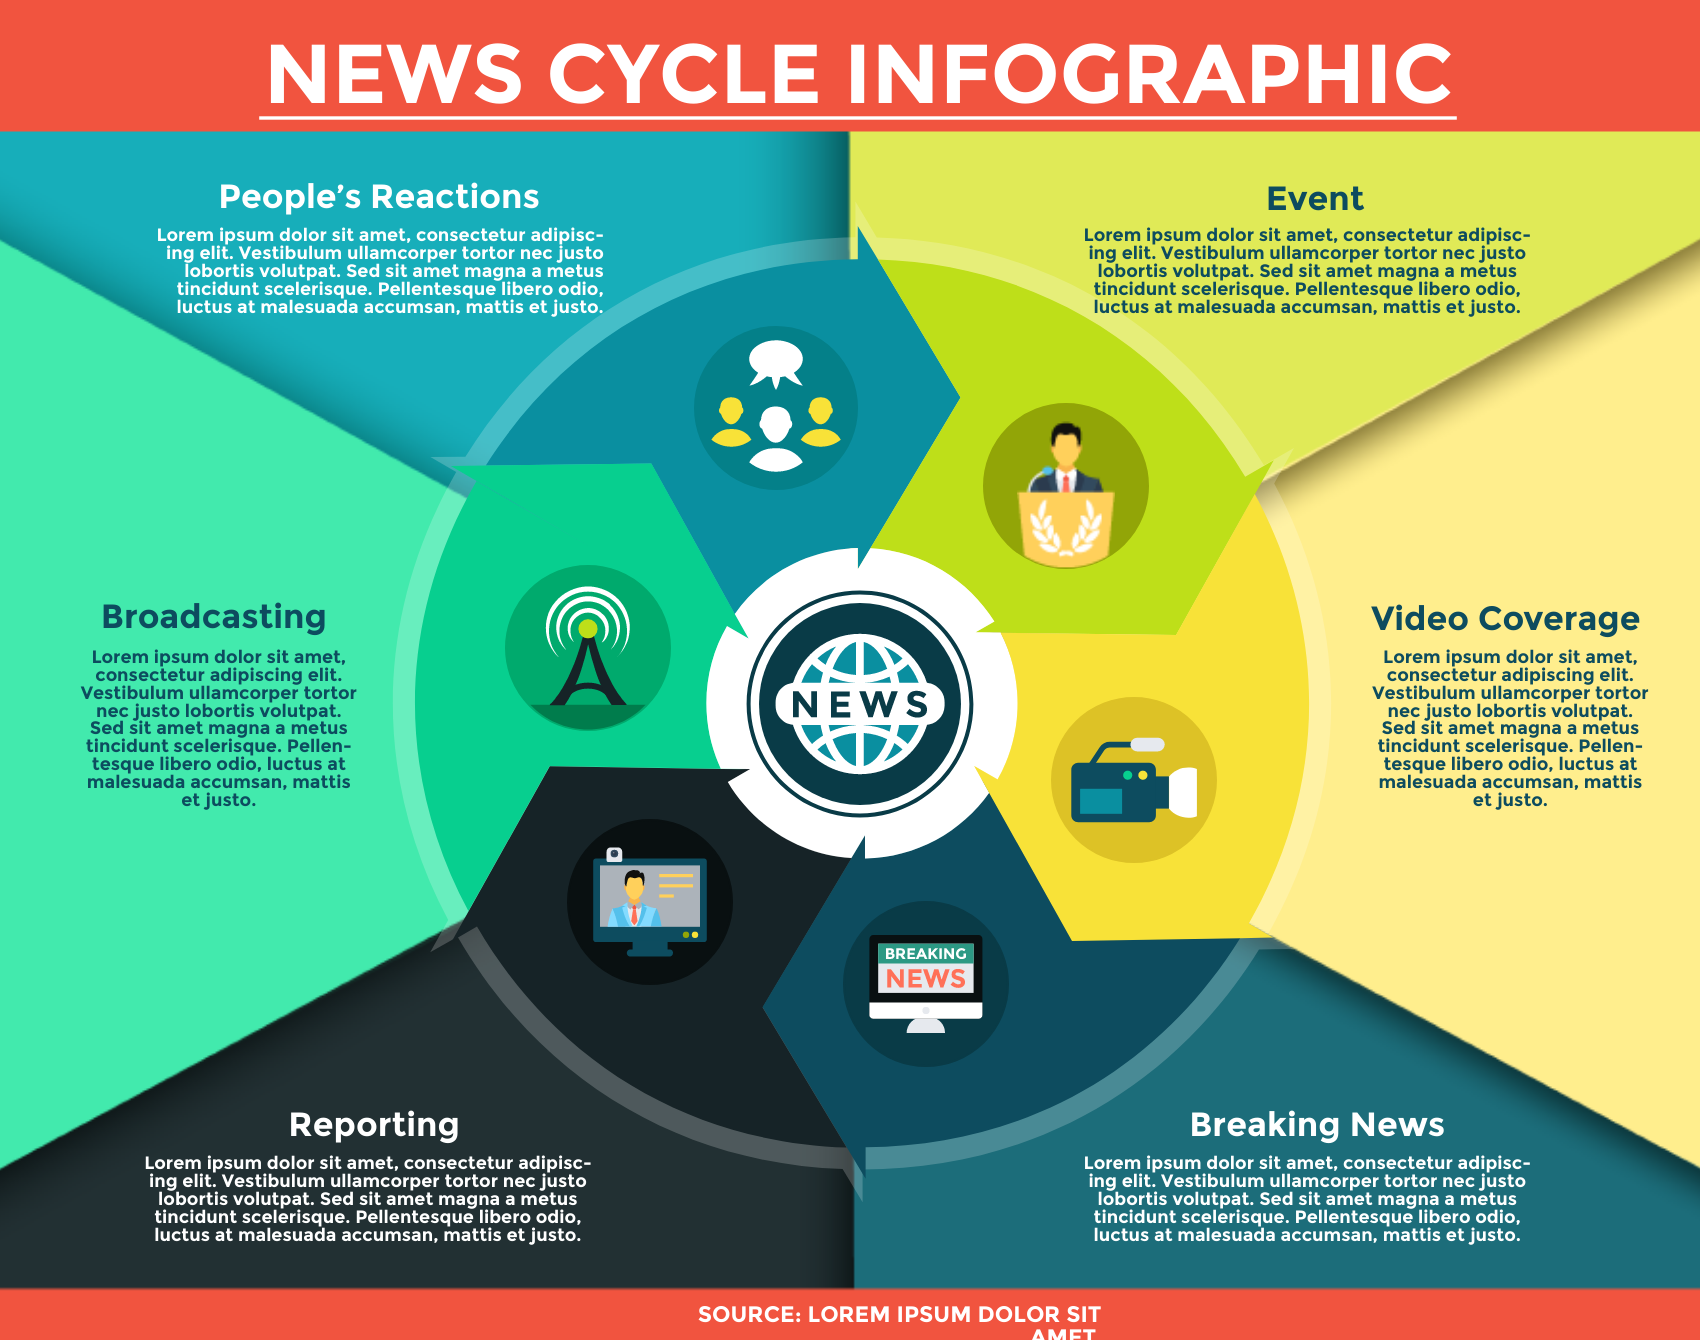
An infographic about the news cycle
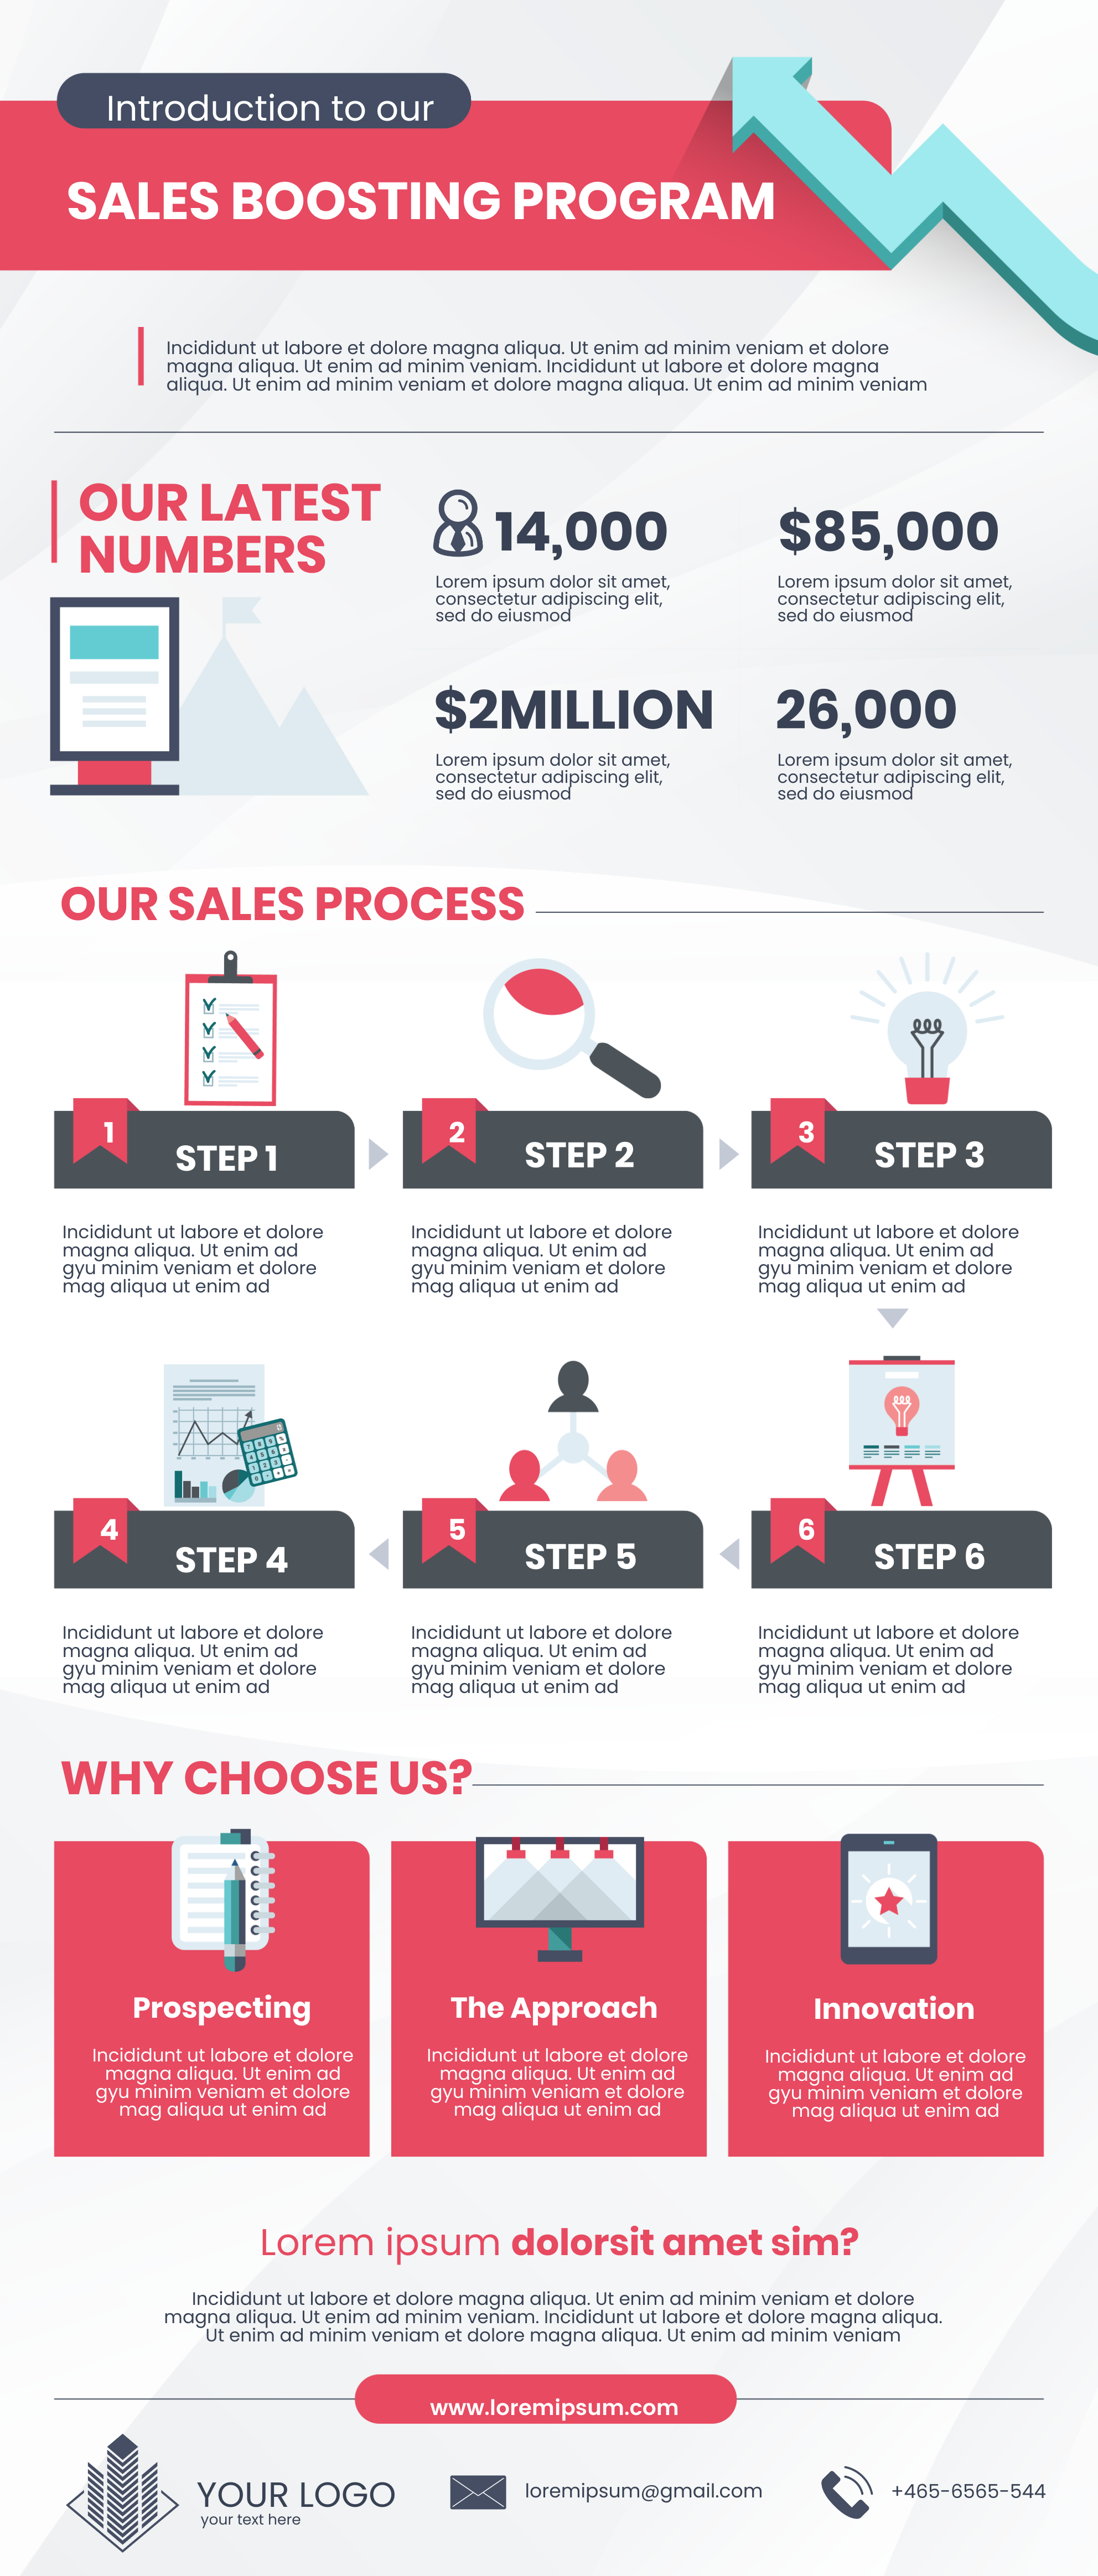
Process infographic about a sales boosting program
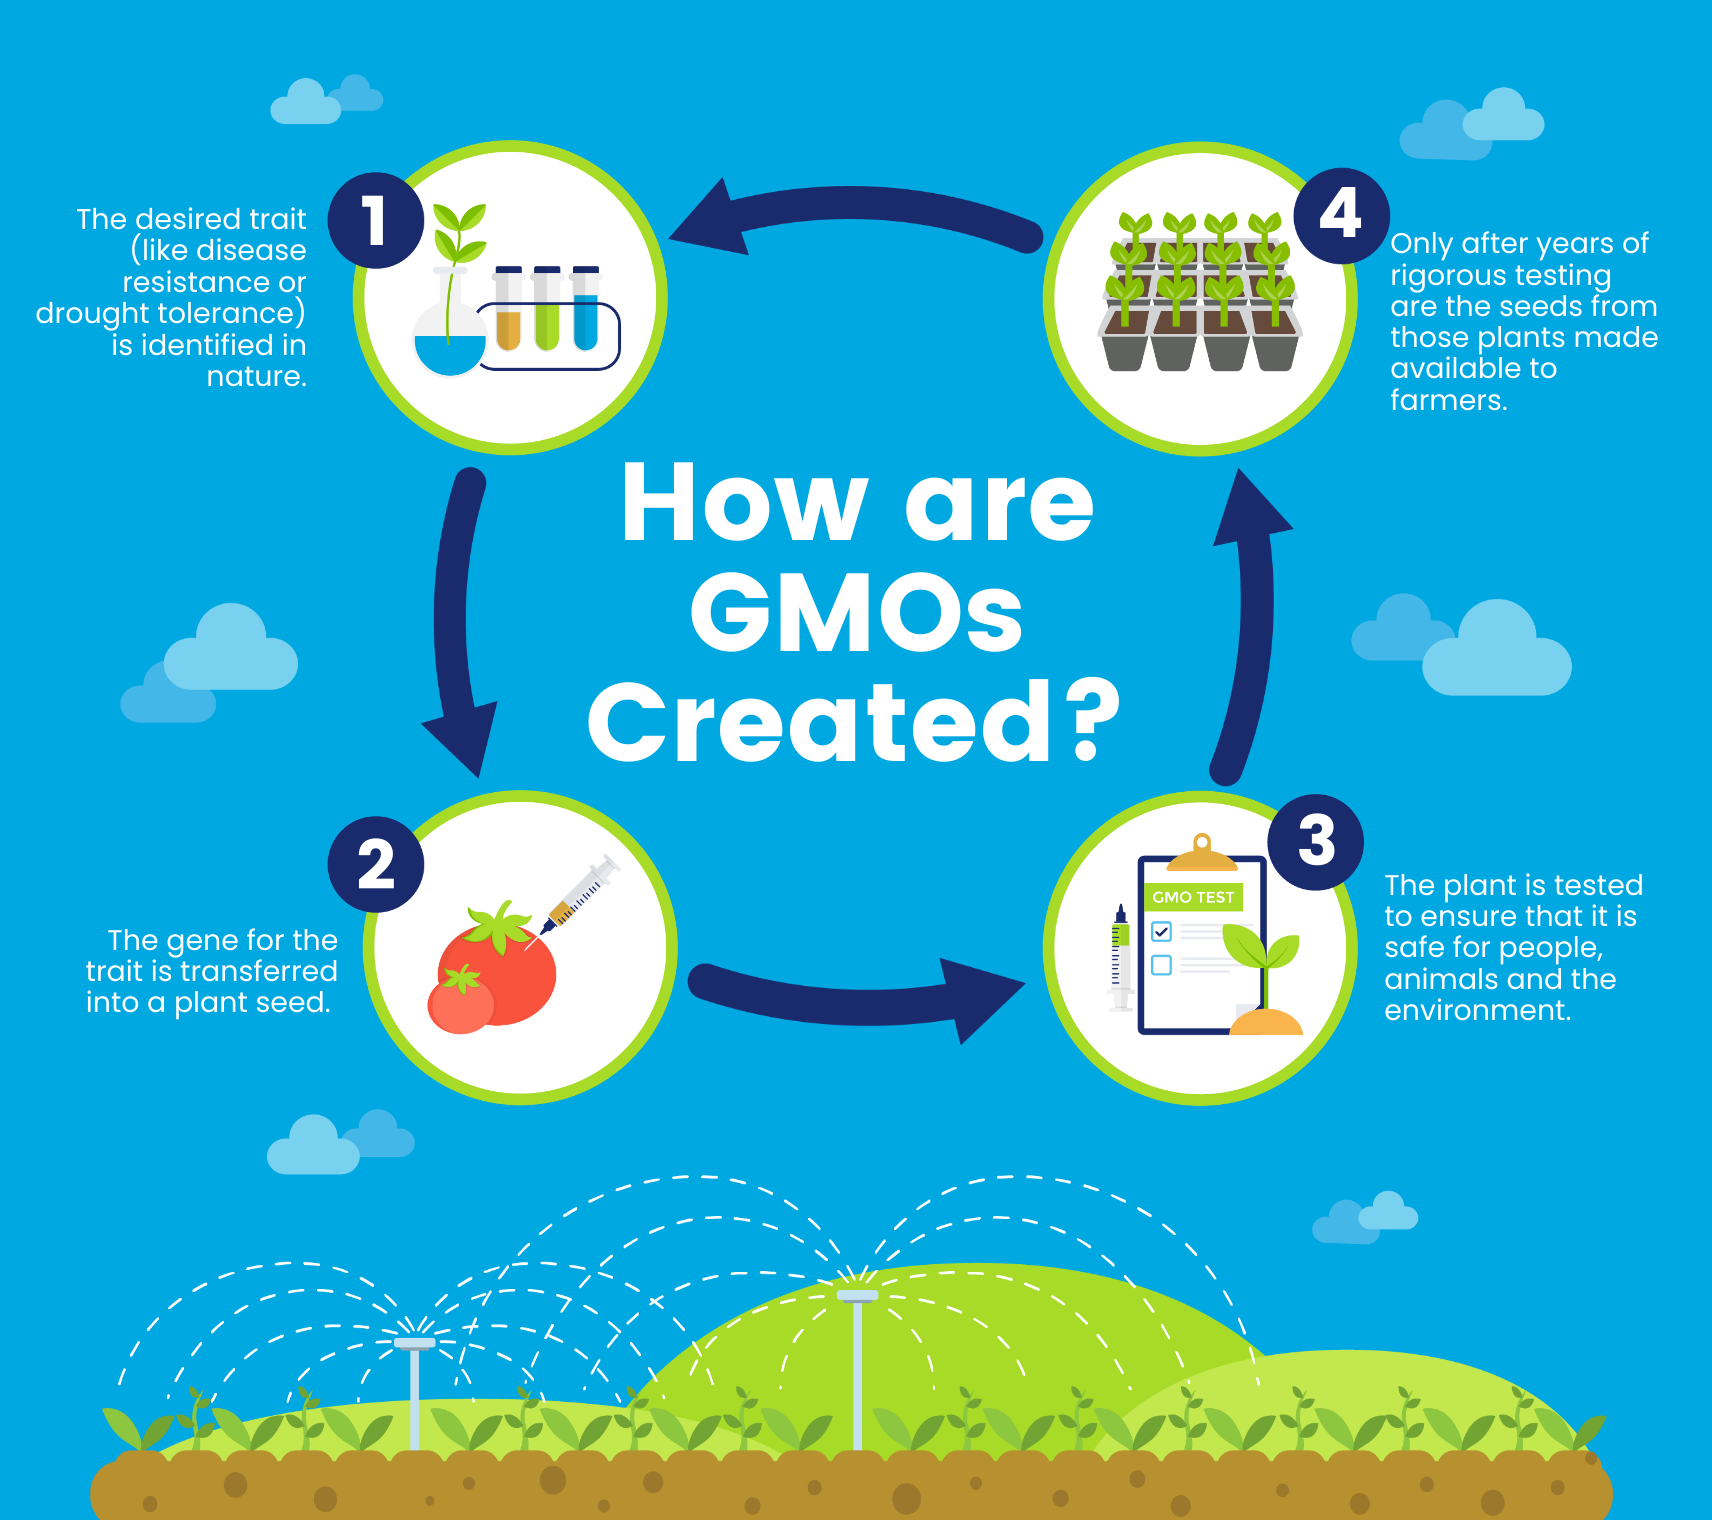
An infographic explaining the GMO creation process
An infographic explaining how to make a keto meal plan

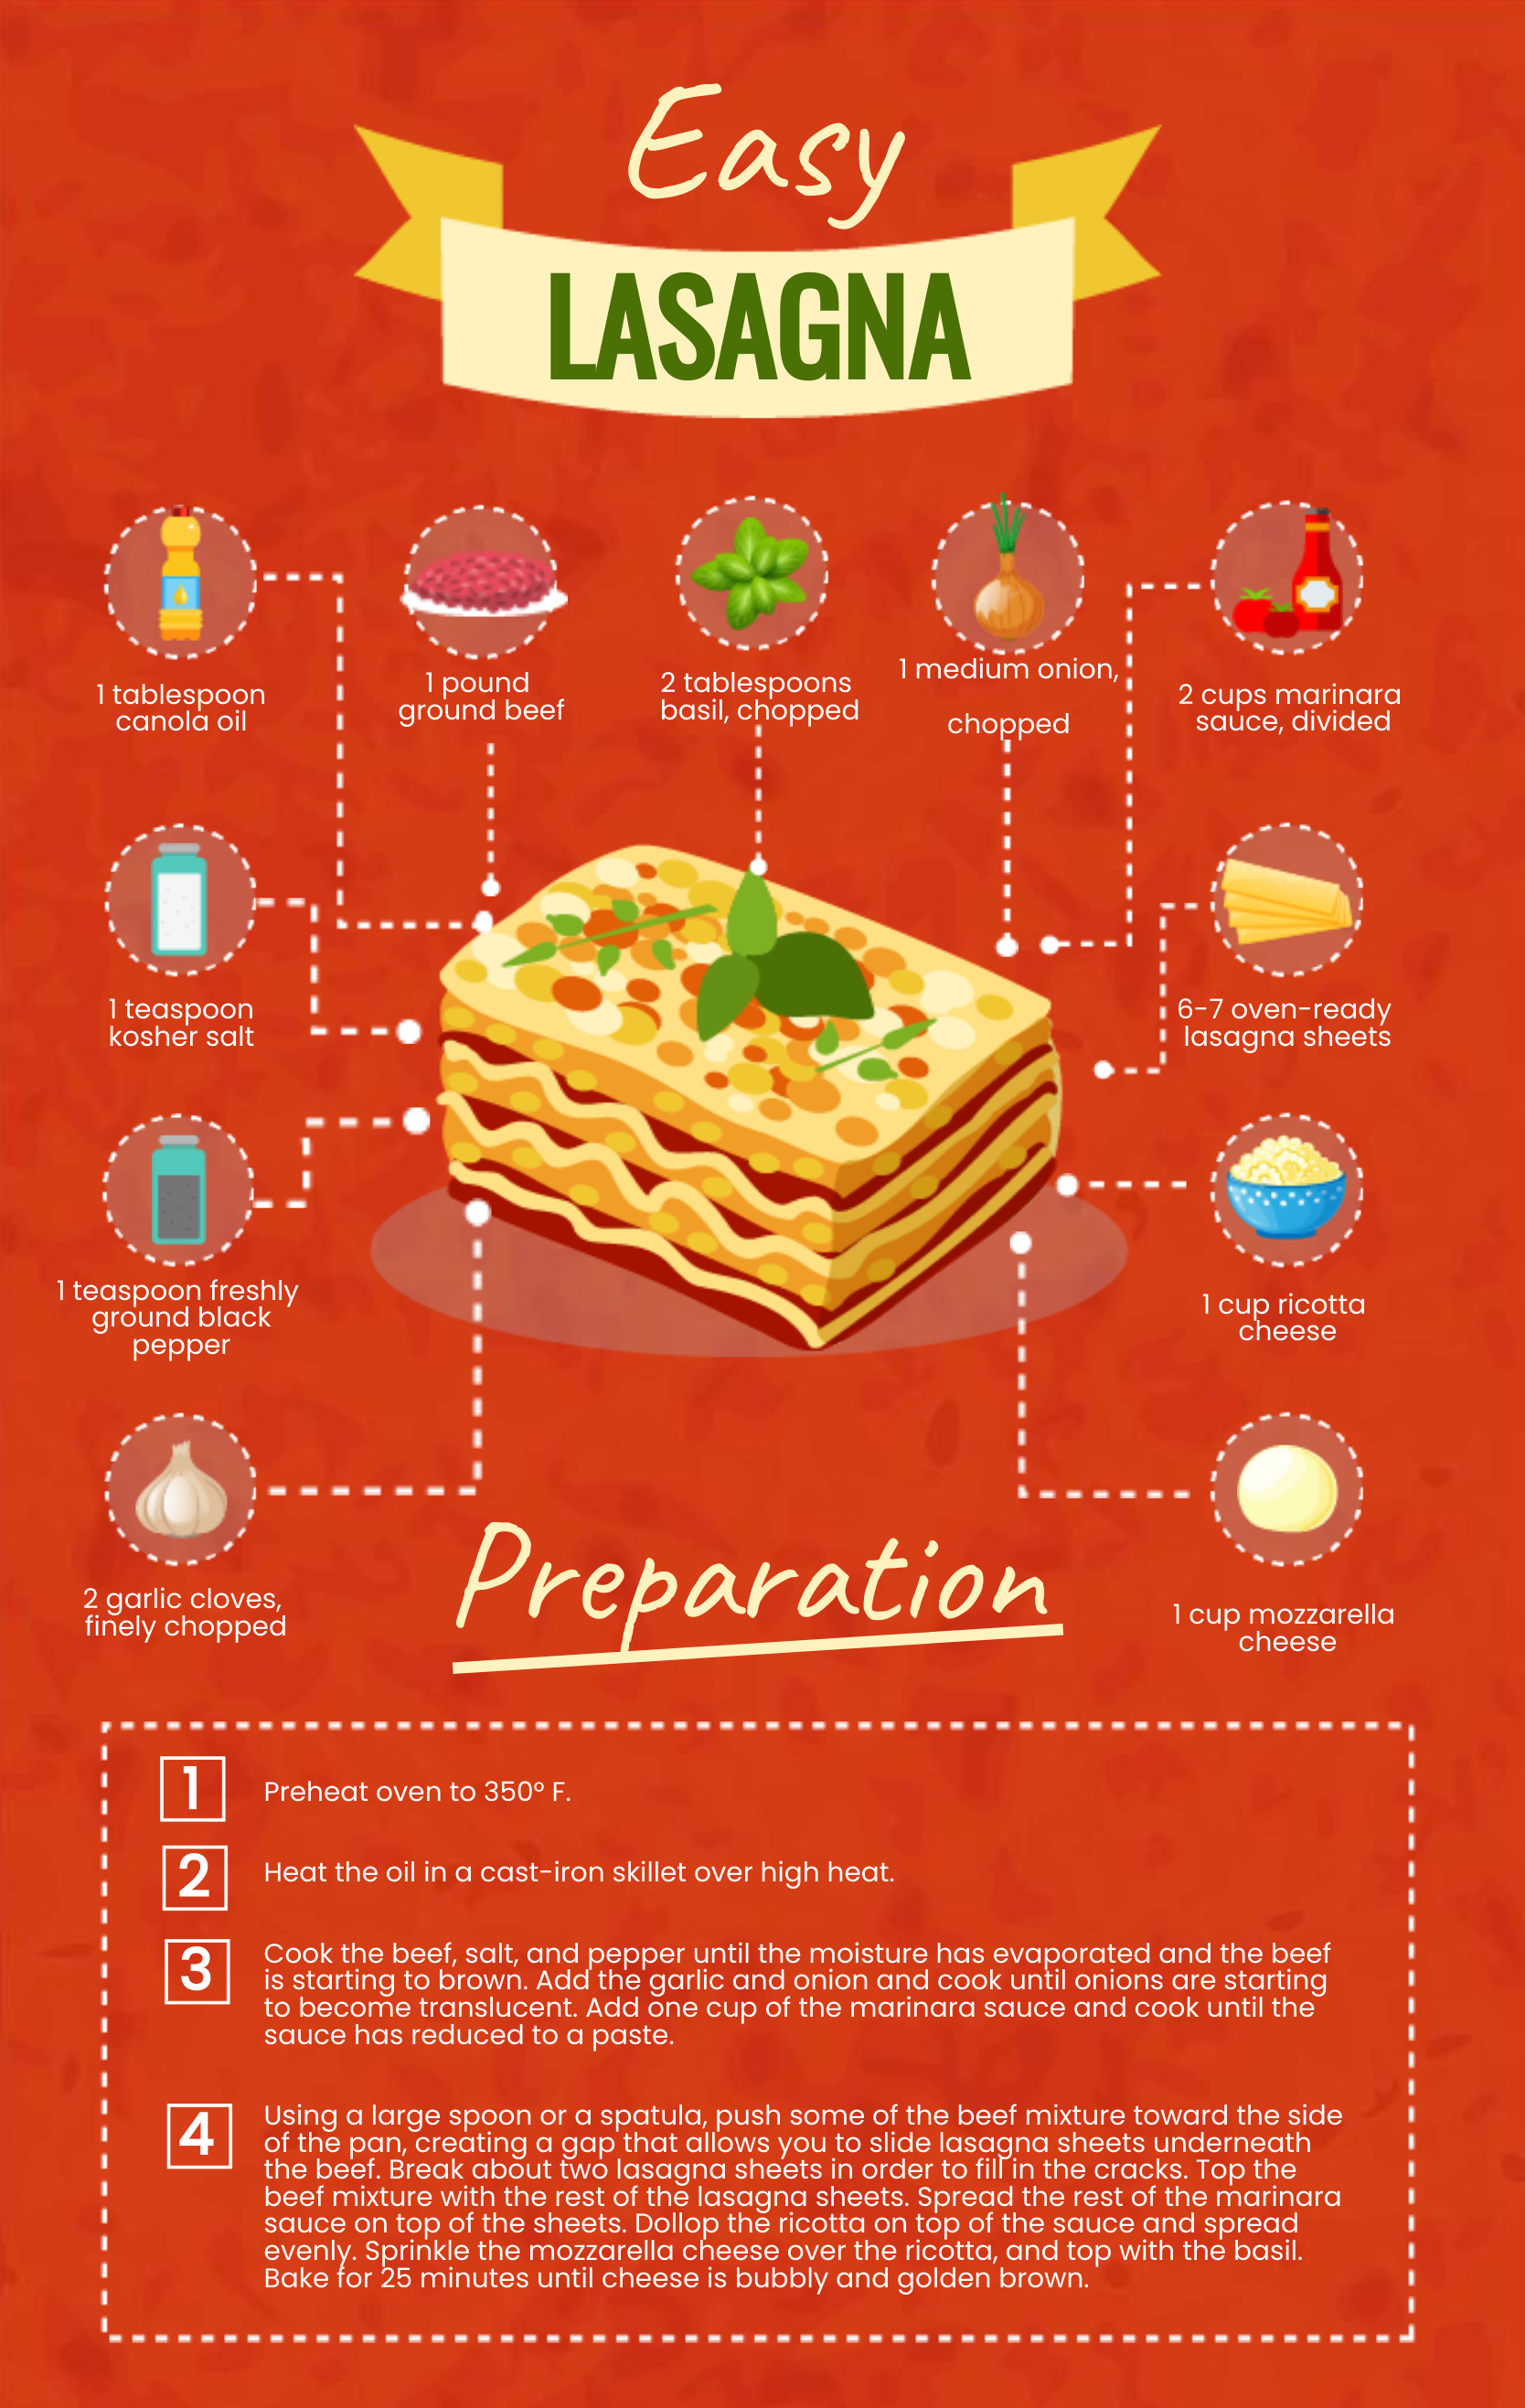
Recipe infographic on how to make lasagna
Getting started with your process infographic
To start your process infographic, pick a template from Easelly’s infographic template collection.
Highlight each step in the process by changing the colors of your subheadings or adjusting font sizes. Next, incorporate images, icons, and charts to make your steps more memorable.
Finally, change your background colors to ensure readability!
The short tutorials below will help you get started:
How to write content for your infographics
How to pick the right infographic color scheme
How to improve your infographic in 5 easy steps
For more infographic design goodness, check our our infographic design channel on YouTube.