Text-only lessons can be too abstract for learners, or the information is difficult to retain. With the inclusion of a quality language learning infographic you can really turn this around.
For this reason, educators use visuals like infographics in the classroom – whether it’s physical or virtual.
Why use a language learning infographic?
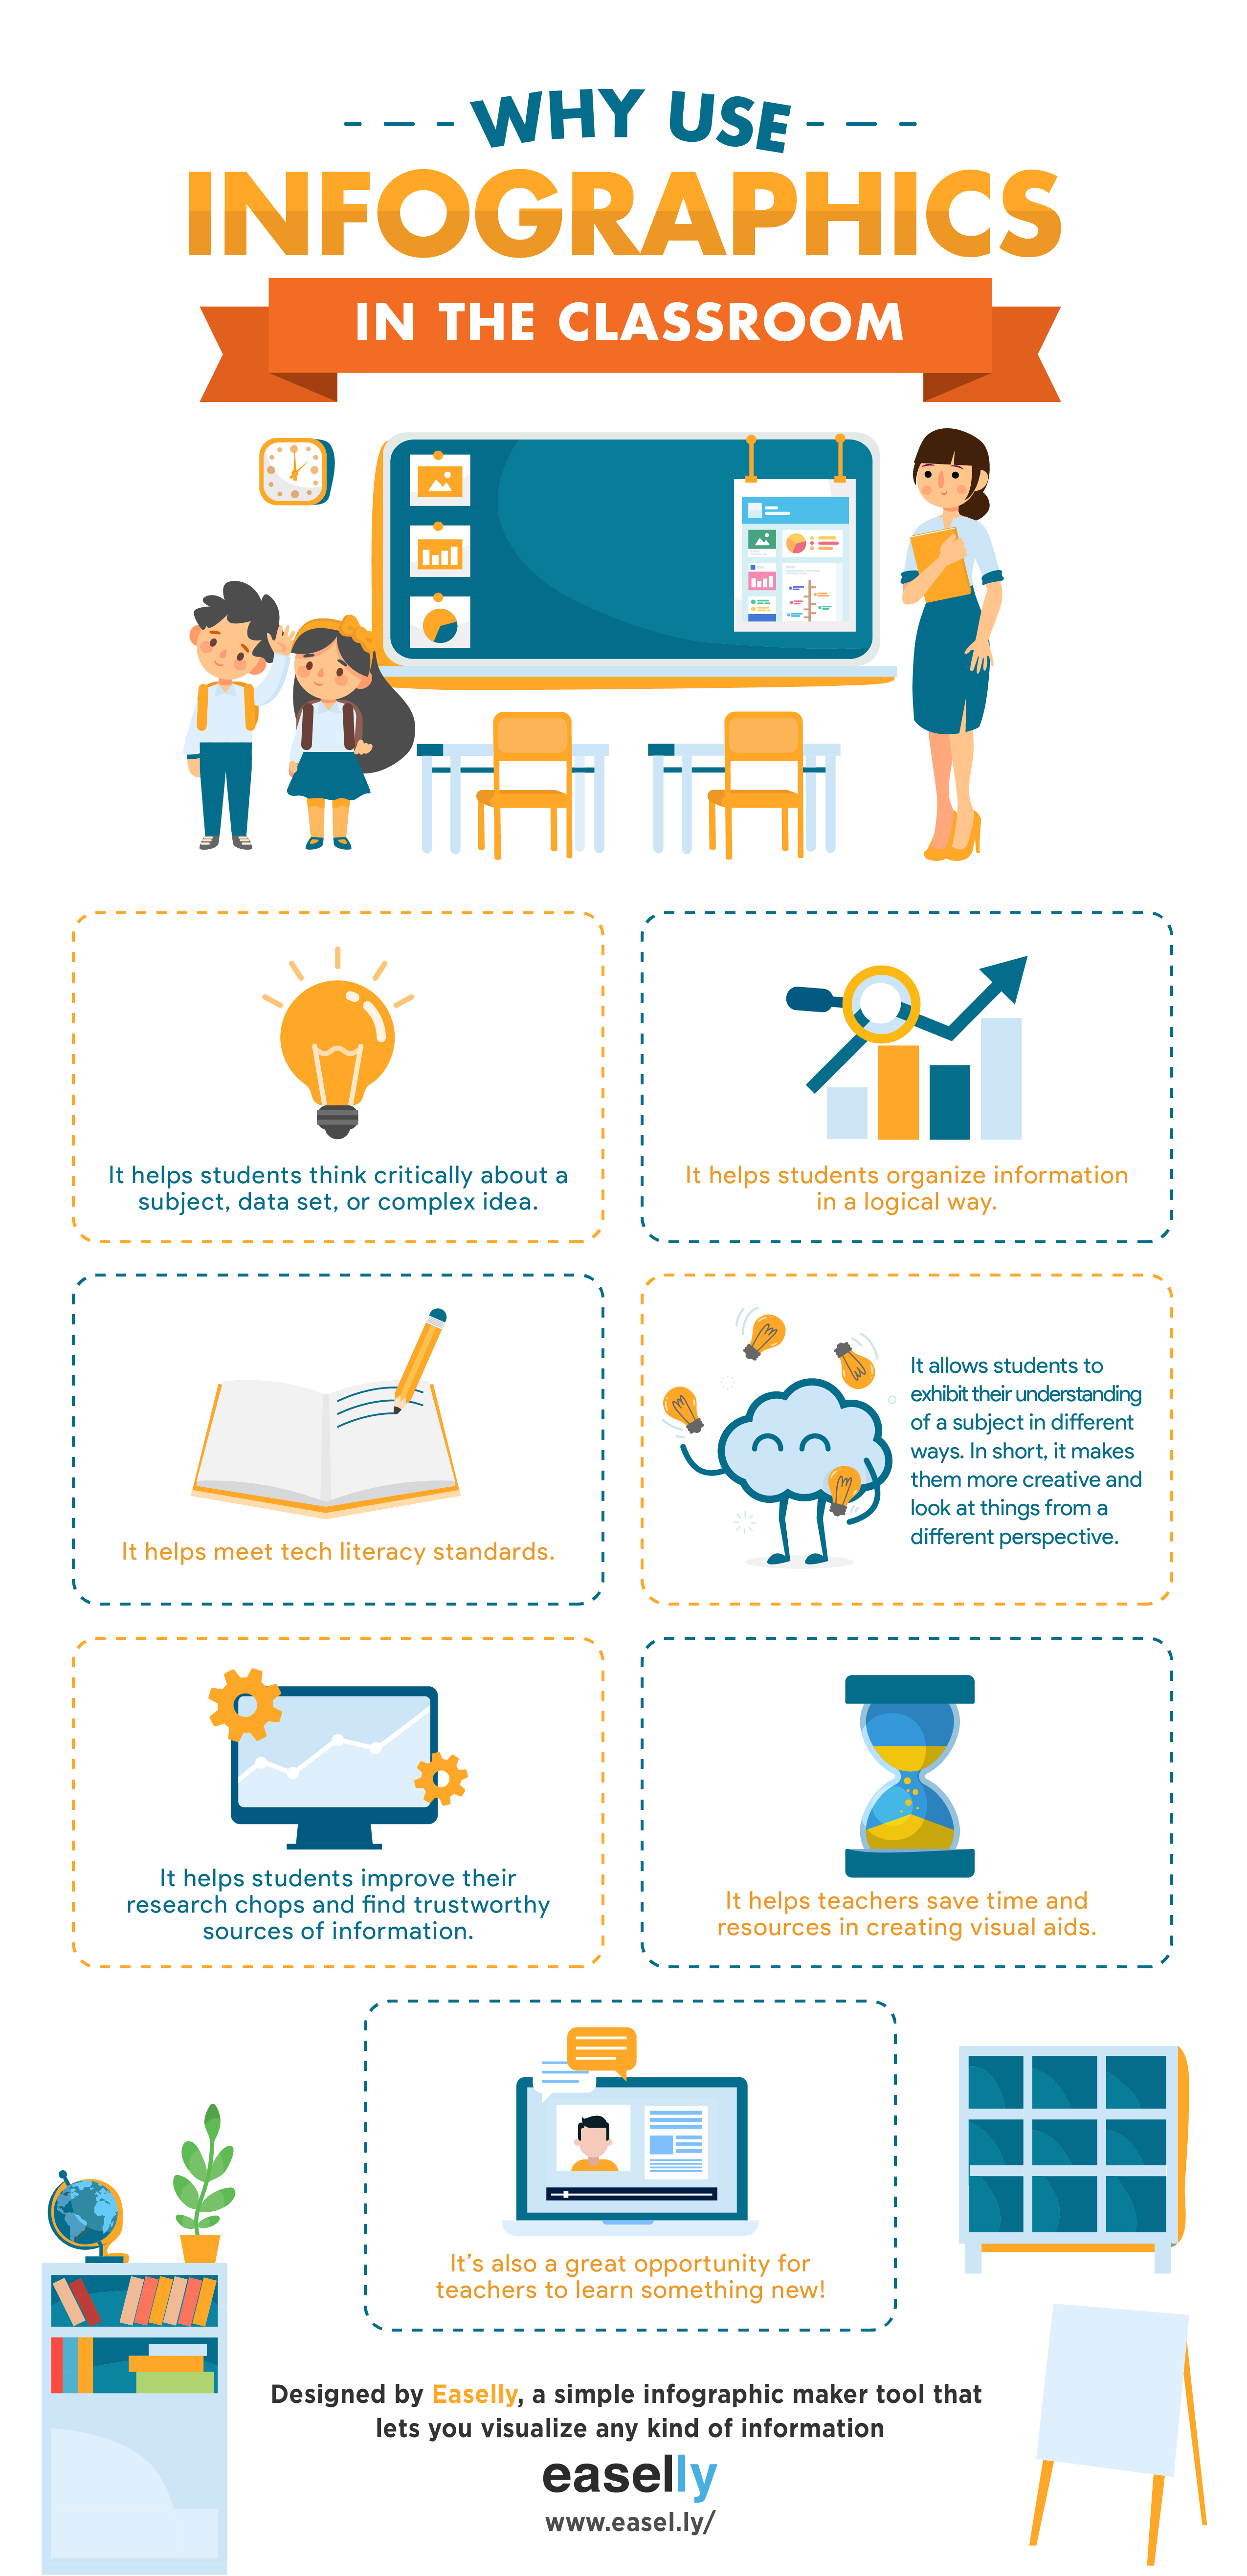
This strategy isn’t just about the learning materials looking prettier. Visual explanations have been shown to improve learning, and visual aids like infographics have numerous benefits for both learners and teachers.
This guide is for educators looking for ideas on how to use infographics in language learning.
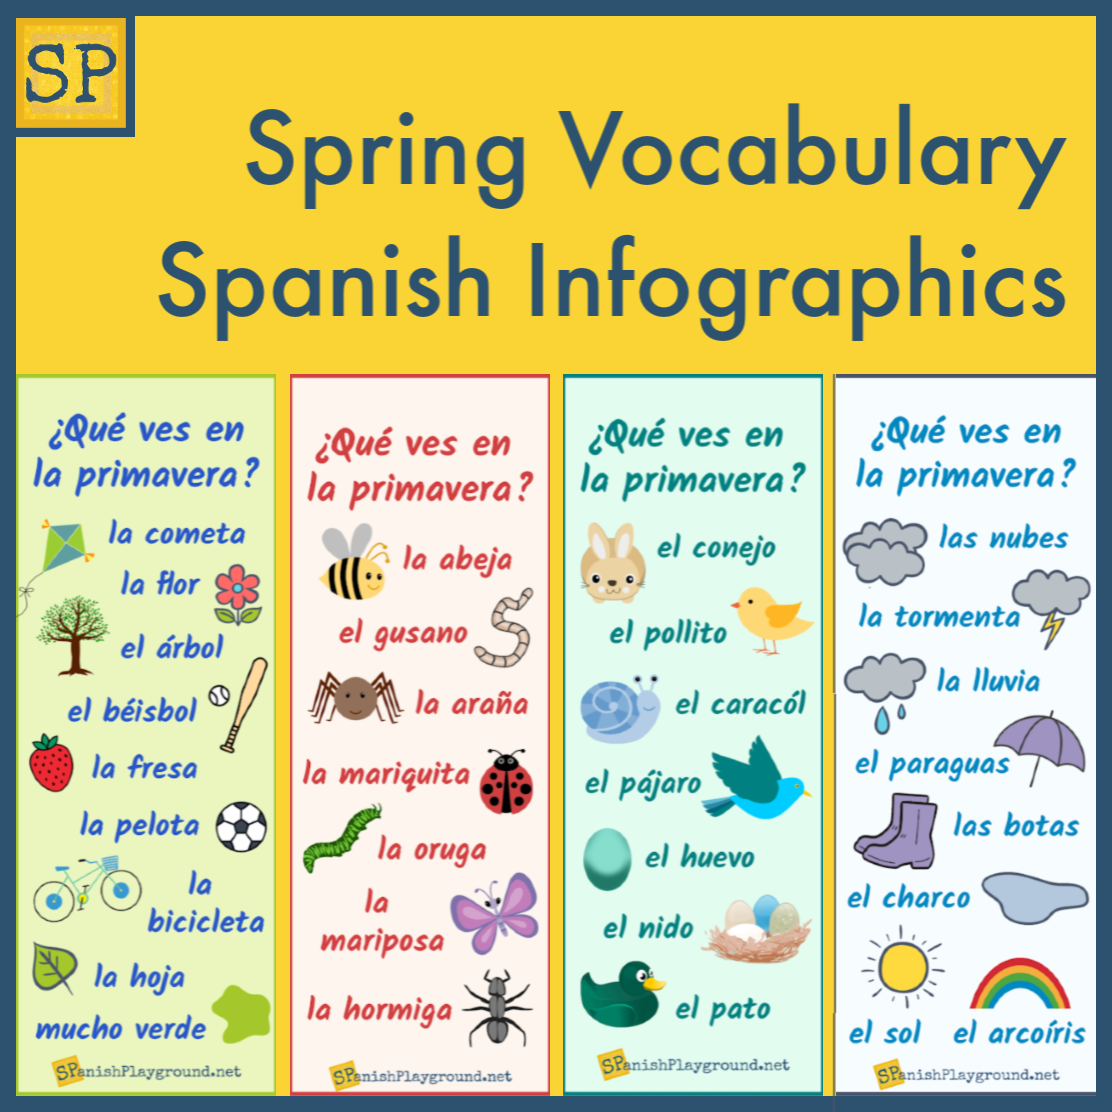
1. Use infographics for vocabulary lessons.
The traditional way of learning vocabulary comes down to simple bullet points in textual documents. It works, but it can be more effective with infographics.
Classroom infographics are perfect for visualizing vocabulary lists and making them more engaging. Present new words through visuals and share them for homework. a language learning infographic is just one example.
Here are some ideas:
Make a “theme-based’ infographic with an eye-catching background and pictures
Highlight essential words in different colors to differentiate them
Visualize the meaning of complex words
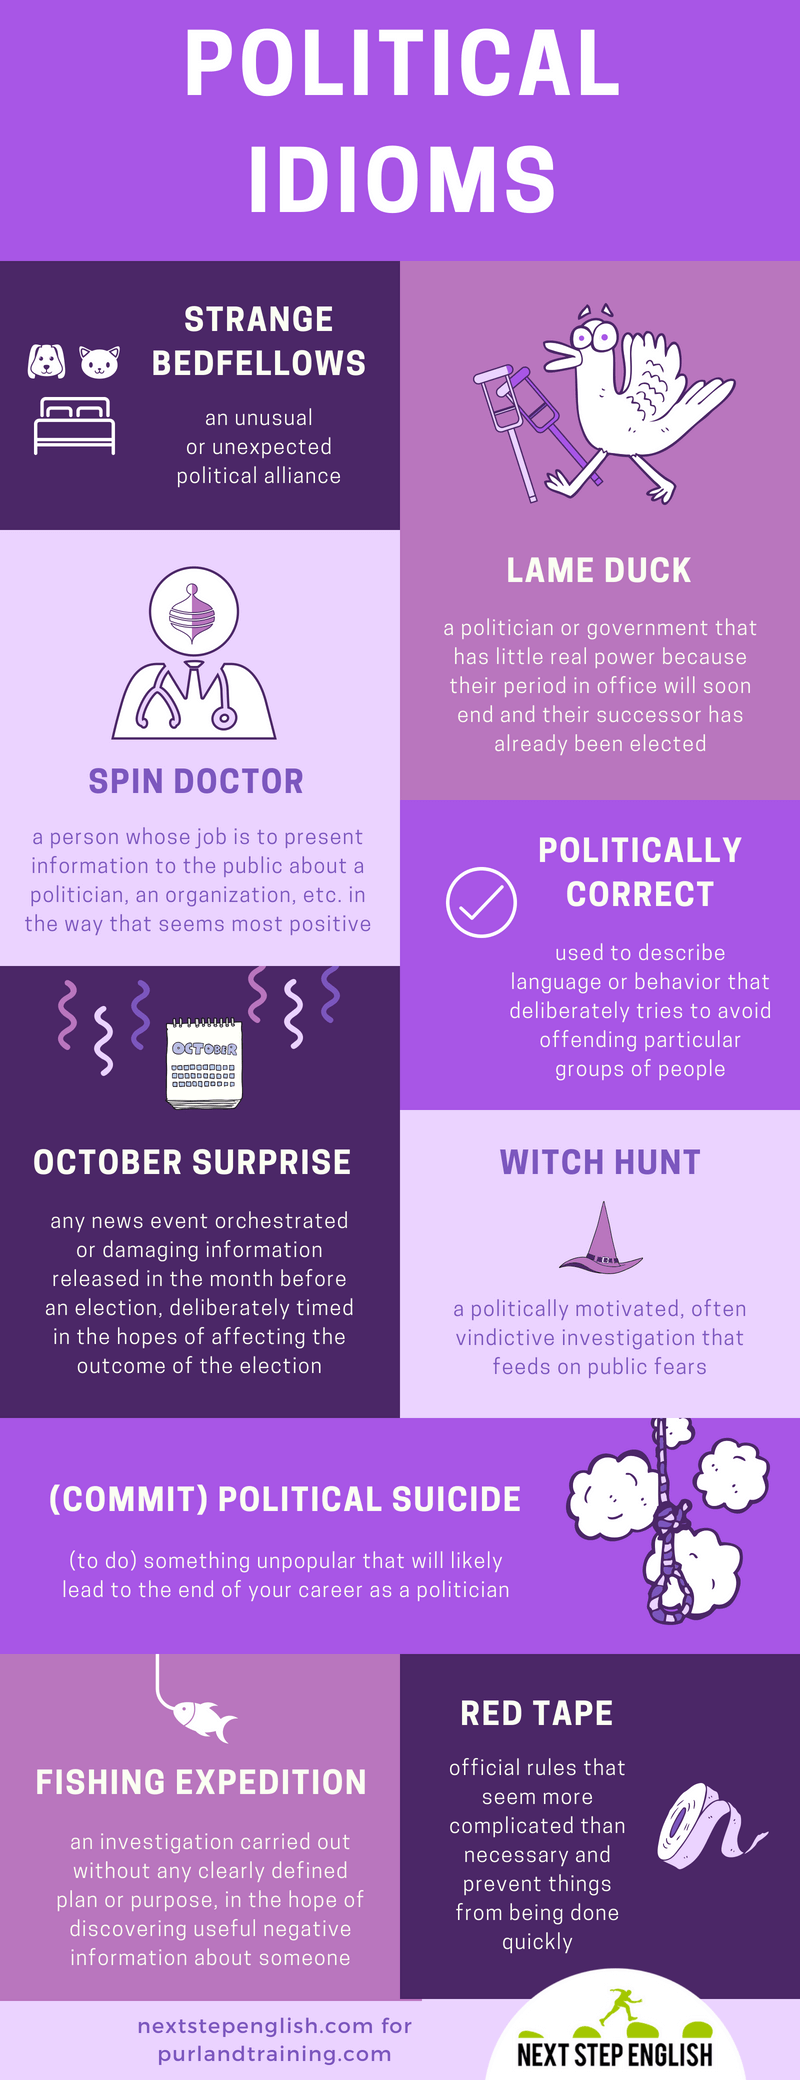
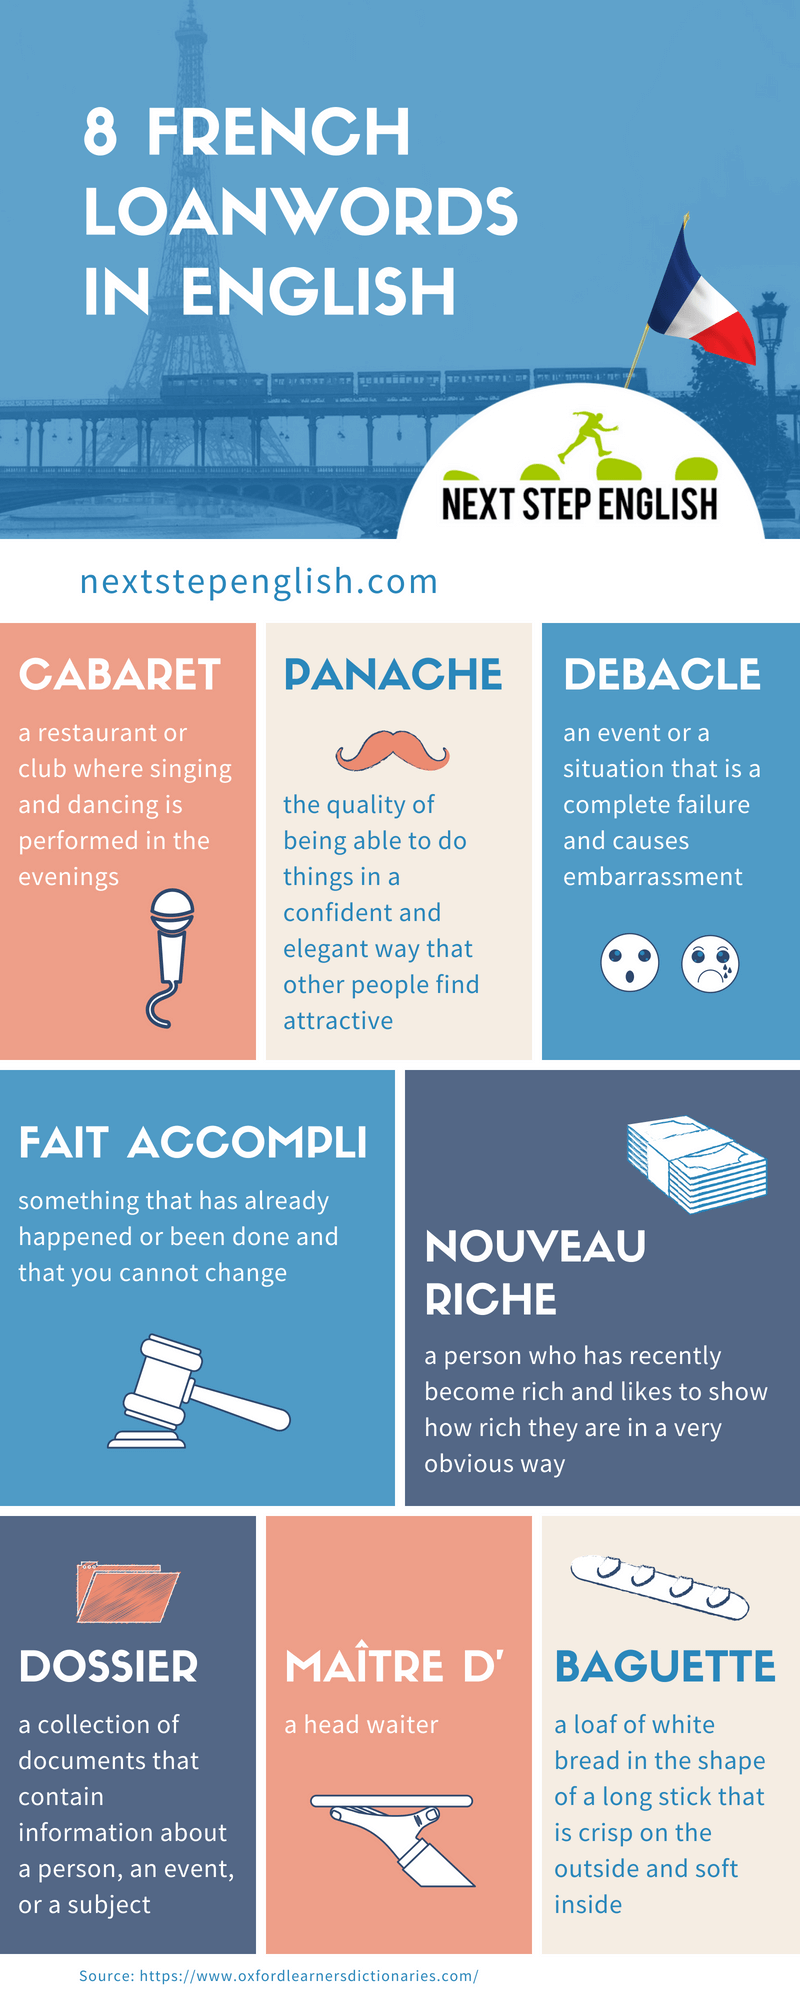
2. Use infographics to explain adjectives, verbs, and idioms.
Infographics are a perfect way to present adjectives, verbs, idioms, and other words in manageable chunks.
For example, you can add ten items to one infographic for a lesson instead of making a long list that’s hard to navigate.
The infographic below by A Cup of French explains French adjectives in a straightforward way.
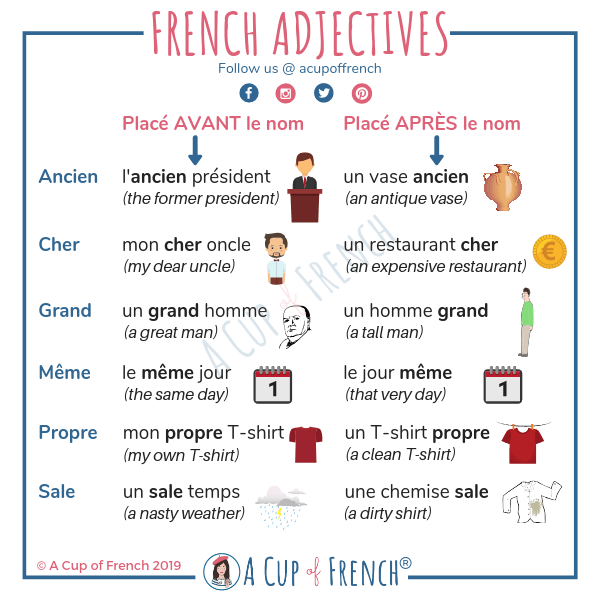
An infographic like this is an excellent option to share with your students. They can even copy it to their smartphones, and they can learn on the go.
Visualizing commonly used phrases is another perfect example. Adding pictures to the infographic of phrases can help students memorize them more quickly.
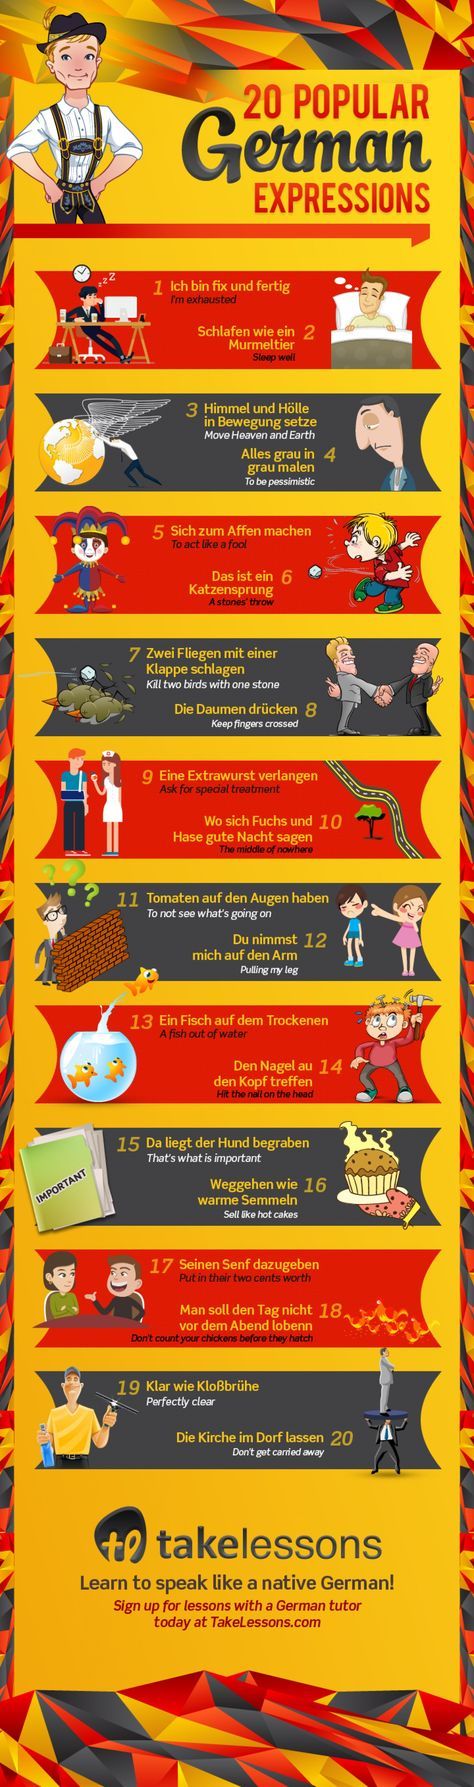
Just think about it – wouldn’t it be fun to visualize idioms and phrases like “Way Out of a Paper Bag” or “A Cat In Gloves Catches No Mice?”
Students can use them as references during the class and while doing their homework.
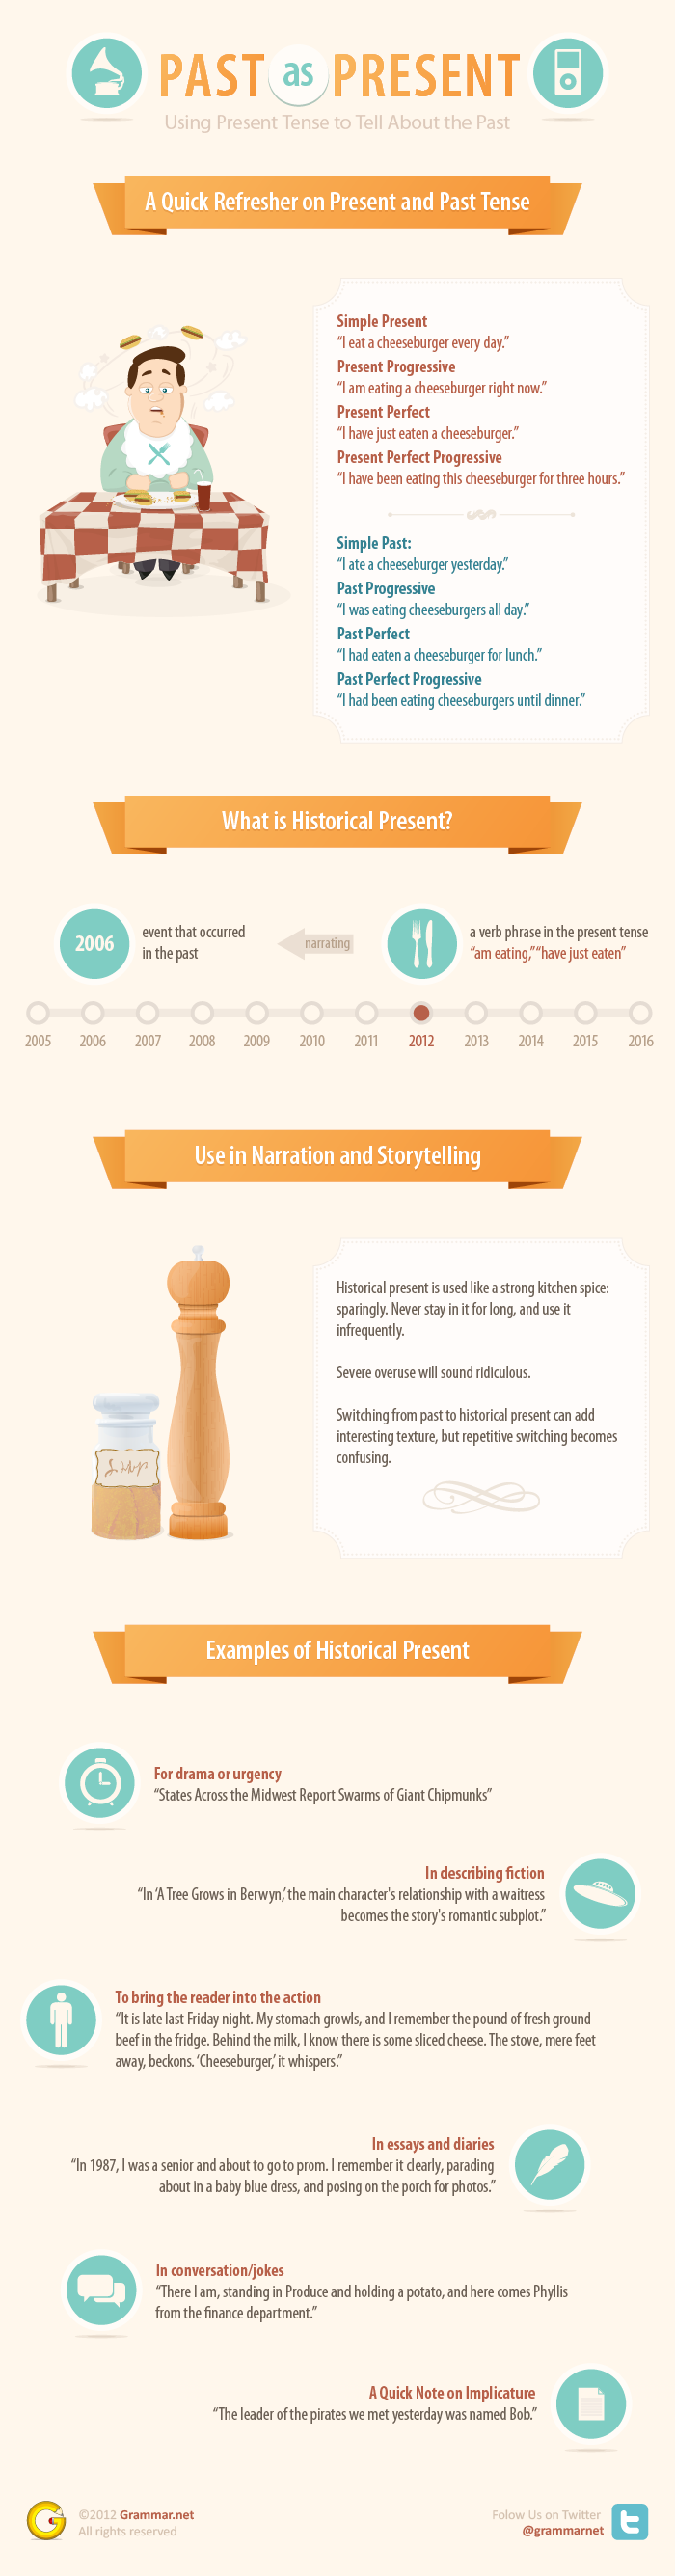
3. Explain tenses through infographics.
Tenses can cause a lot of confusion. In particular, they can be challenging for English learners whose native languages don’t have tense indicators.
Infographics can be a way to provide that visual context. Plus, you can make charts and graphs more appealing with infographics. Here’s a simple example from Grammar.net
In addition, make content easier to understand with examples. Doing so is simple with infographics. A typical infographic maker tool has hundreds (if not more!) of pictures, graphics, icons, emojis, and other visuals.
4. Turn a language learning infographic into a home assignment.
Another way to use infographics in the language learning classroom is to turn them into home assignments.
With infographic templates, you can visualize language exercises in minutes. Tables, multiple-choice questions, essays, you name it – you can transform them into classroom infographics.
Here’s an idea for you.
Have your students write an essay based on the statistics and facts in an infographic.
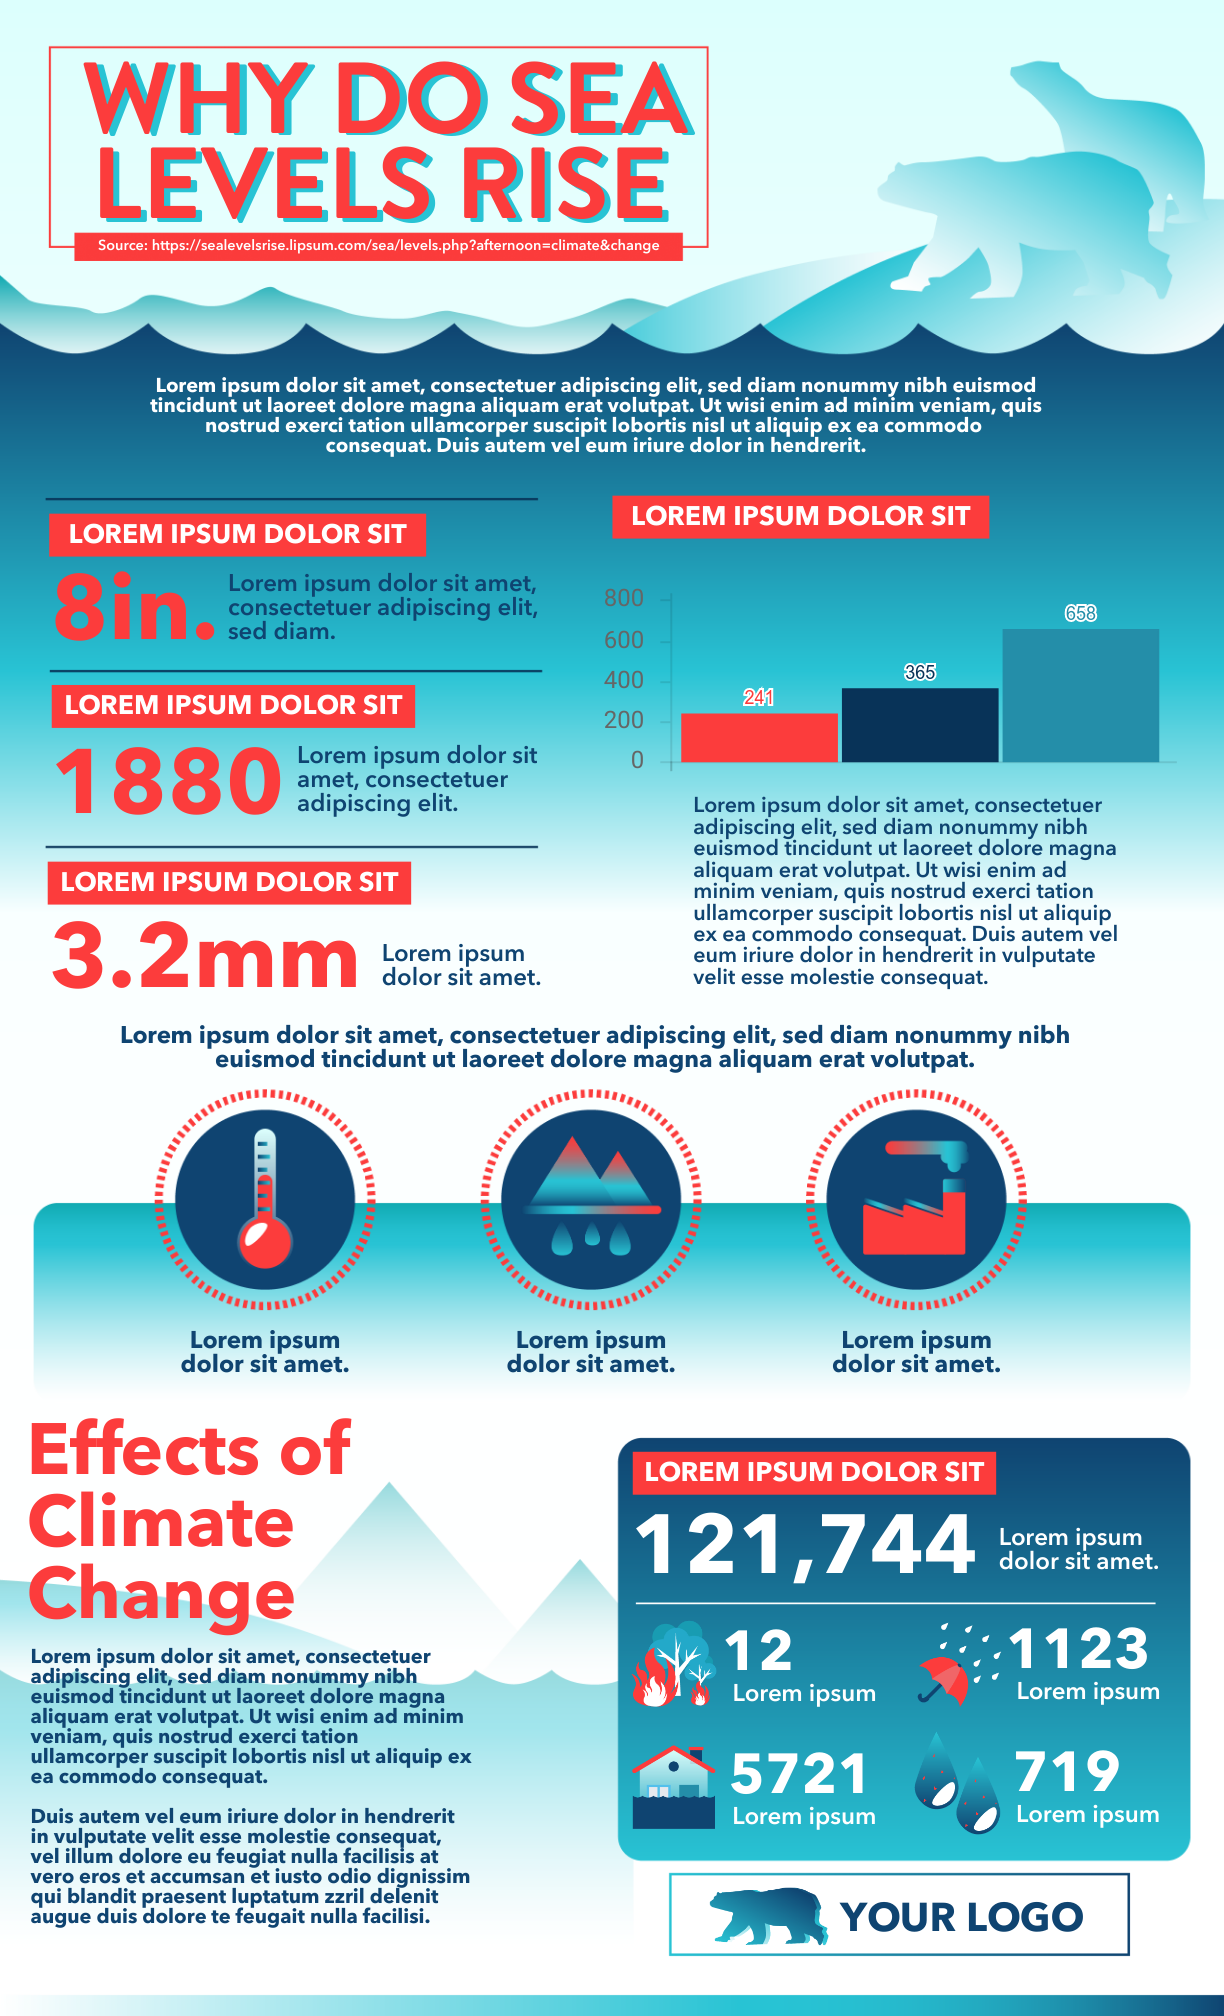
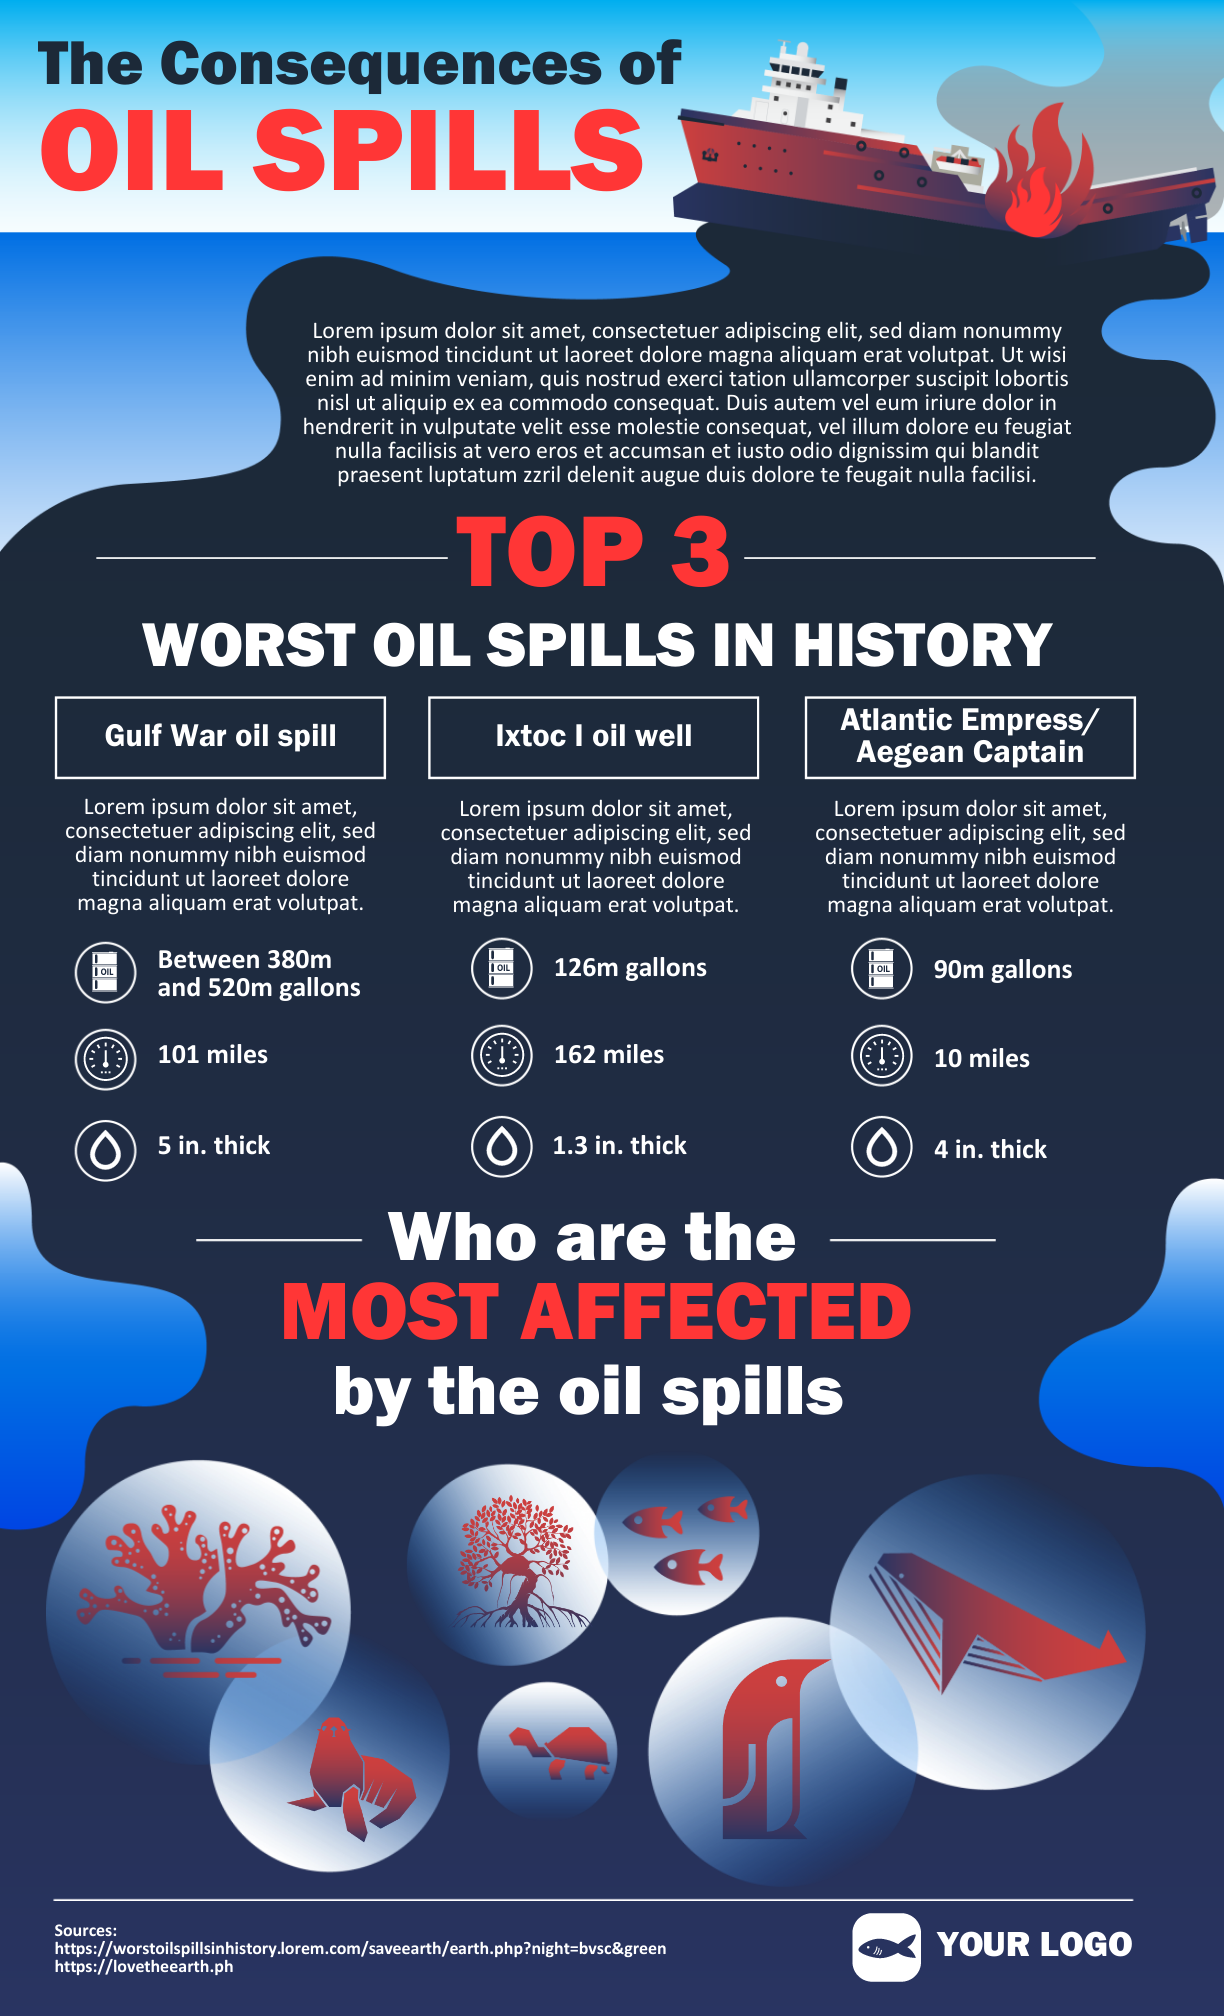
The following infographics on climate change are well-researched and contains several facts about the phenomena. It summarizes a lot of knowledge in one image that your students can use to write an essay.
Let your students choose the facts from infographics to create a structure of the essay. Putting them together can make a very well-structured essay.
Finally, keep in mind that you can also ask your students to choose an assignment. So you can pick any language learning topic you want.
5. Create language lesson plans with infographics.
You can use infographics for any classroom subject, like your language class.
Make mind maps, charts, graphics, and tables within infographics to present lesson plans.
Instead of making a text, how about making an infographic like the checklist template below? It has eye-catching colors, easy-to-read-text, and some helpful visuals.
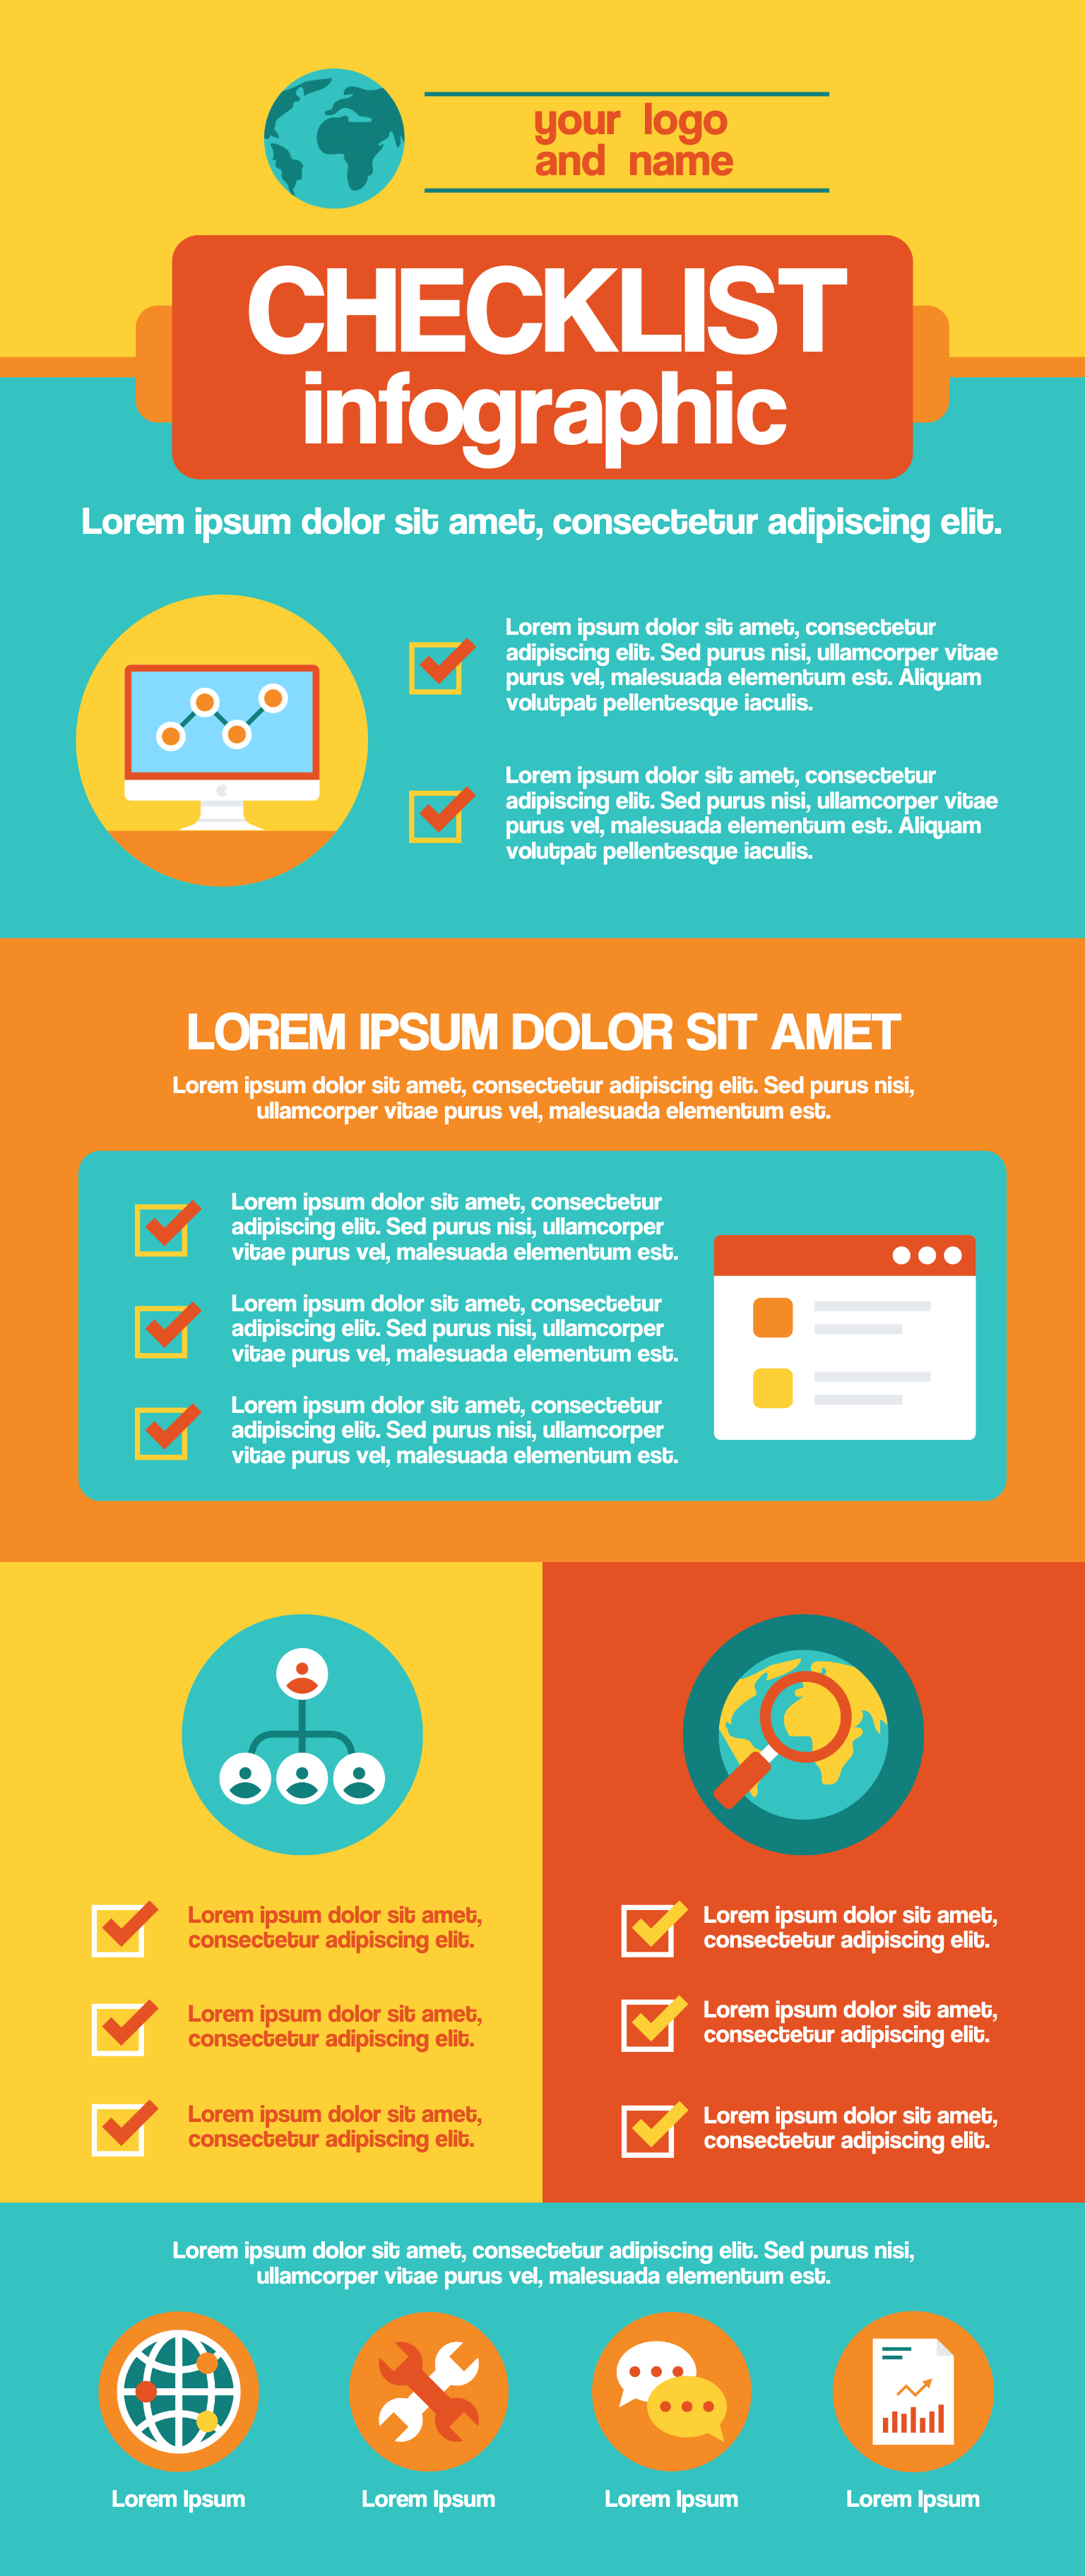
With an infographic like this, you can go through each subtopic during the lesson. This one, in particular, contains five behaviors and three sections for facts and stats. You can, of course, choose as many sections as you wish.
The beauty of infographics is that you can:
- Create separate sections with the information you’d like to highlight.
- Structure the infographic in the way you want the lesson to go.
- Add images, icons, and different fonts.
- Share lesson plans easily.
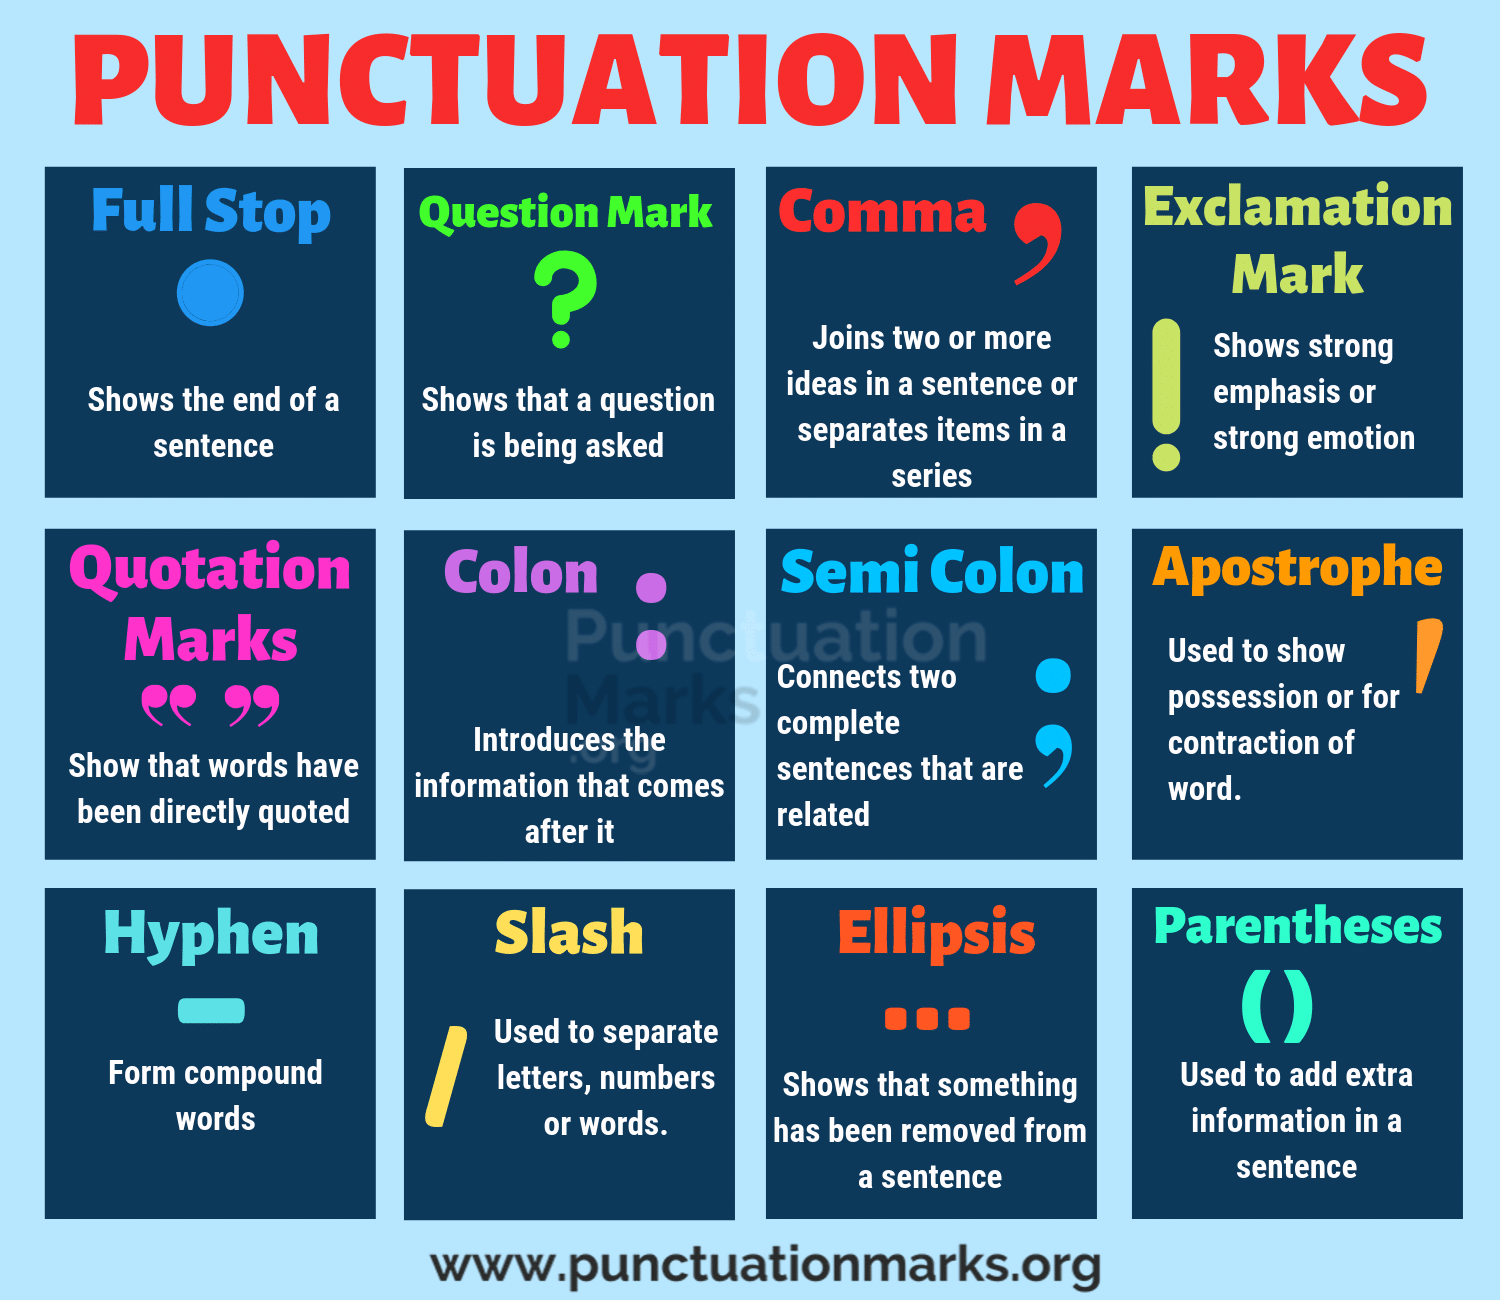
6. Explain punctuation through visuals.
Punctuation is one of the most challenging parts for many language learners.
Commas and periods are a piece of cake, but things change when slashes, semi-colons, apostrophes, and other guys come to the picture.
You can create a comprehensive infographic with all essential punctuation rules with examples. It could be an excellent reference for the punctuation needs of your students.
Although it won’t be the full information source, your punctuation infographic will help students express themselves clearly and correctly.
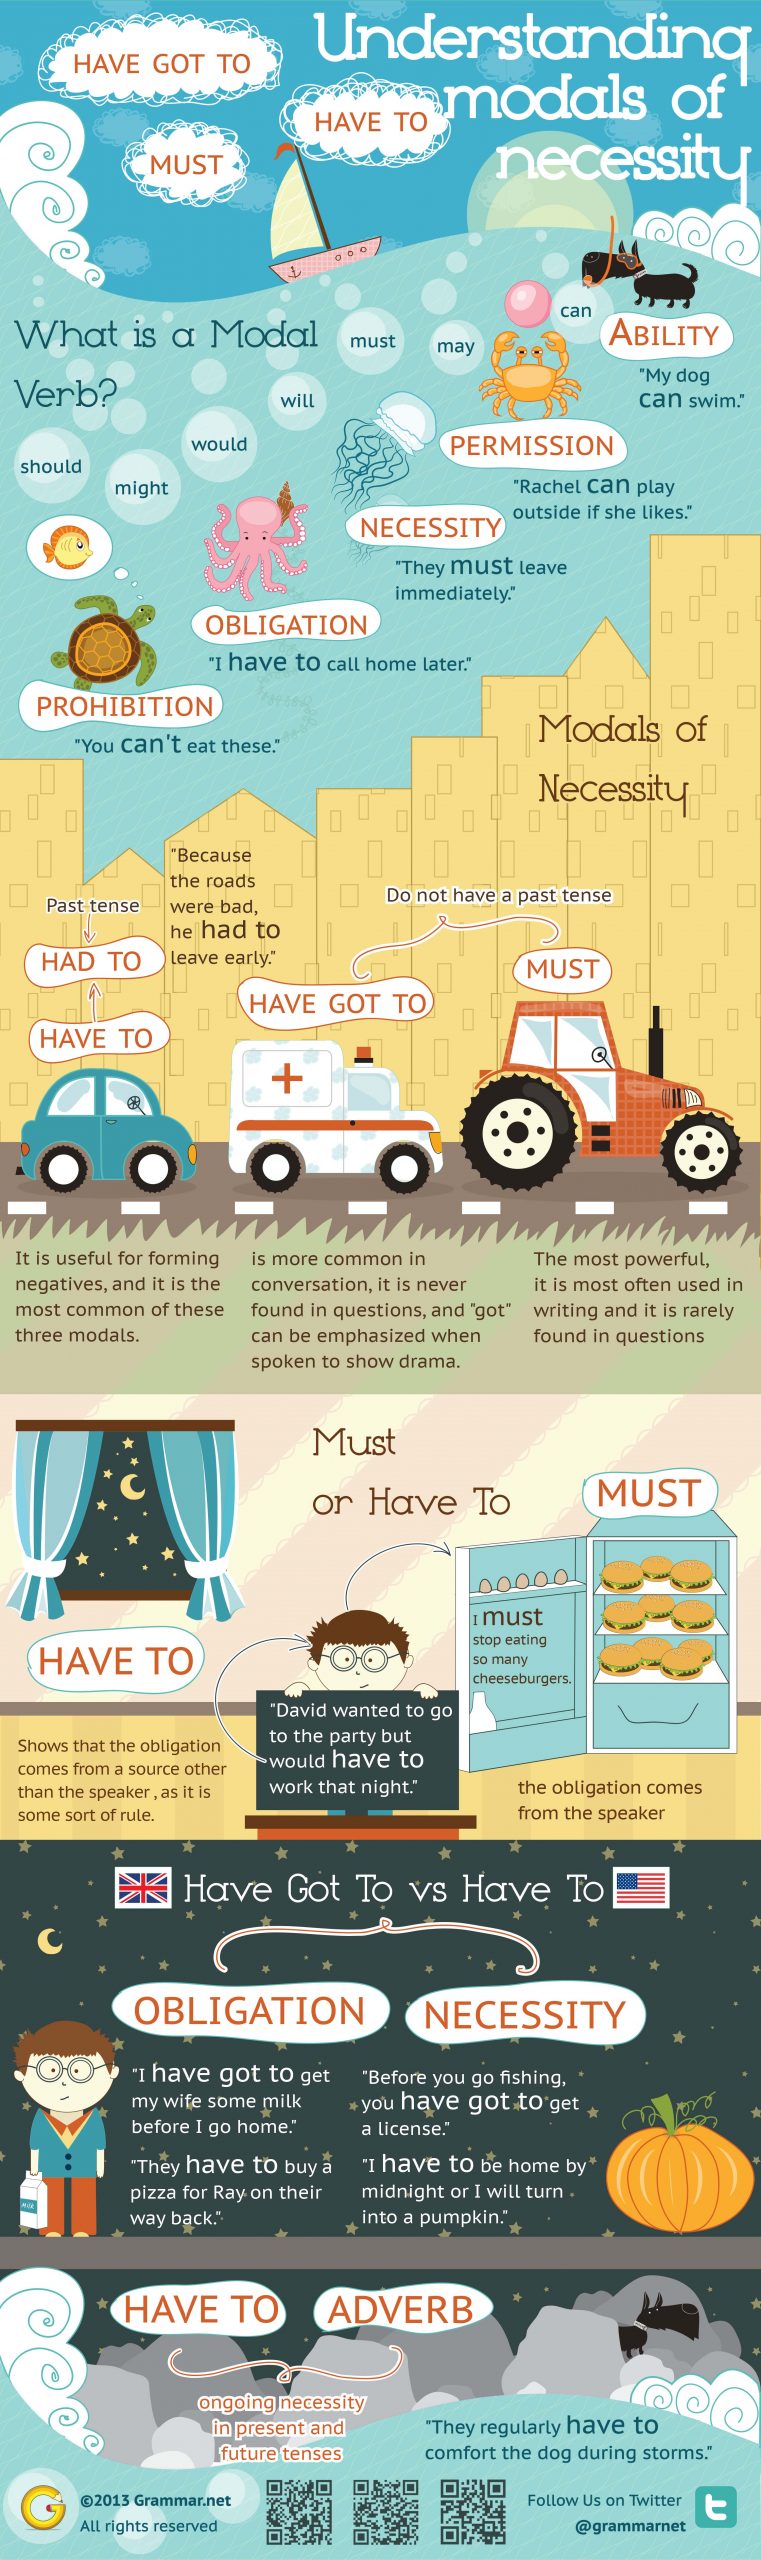
7. Explain modal verbs through an infographic.
Like many things with new languages, modals are guilty of strange behavior. So explaining them thoroughly is a primary goal for all language educators.
Where should I use “should”? “would’? “might”? or “may?”
For an English language learner, an infographic that explains these modals could be a helpful reference.
The example below has colorful sections and clever visuals.
You can create a comprehensive infographic covering all modal verbs or break them down to discuss multiple lessons.
Infographics can have as many content sections as you need, but avoid making very long versions.
When making long infographics, use contrasting colors for text boxes. This design technique will help to keep the text readable on most backgrounds. Stick to 2-3 colors when making infographics to make them readable.
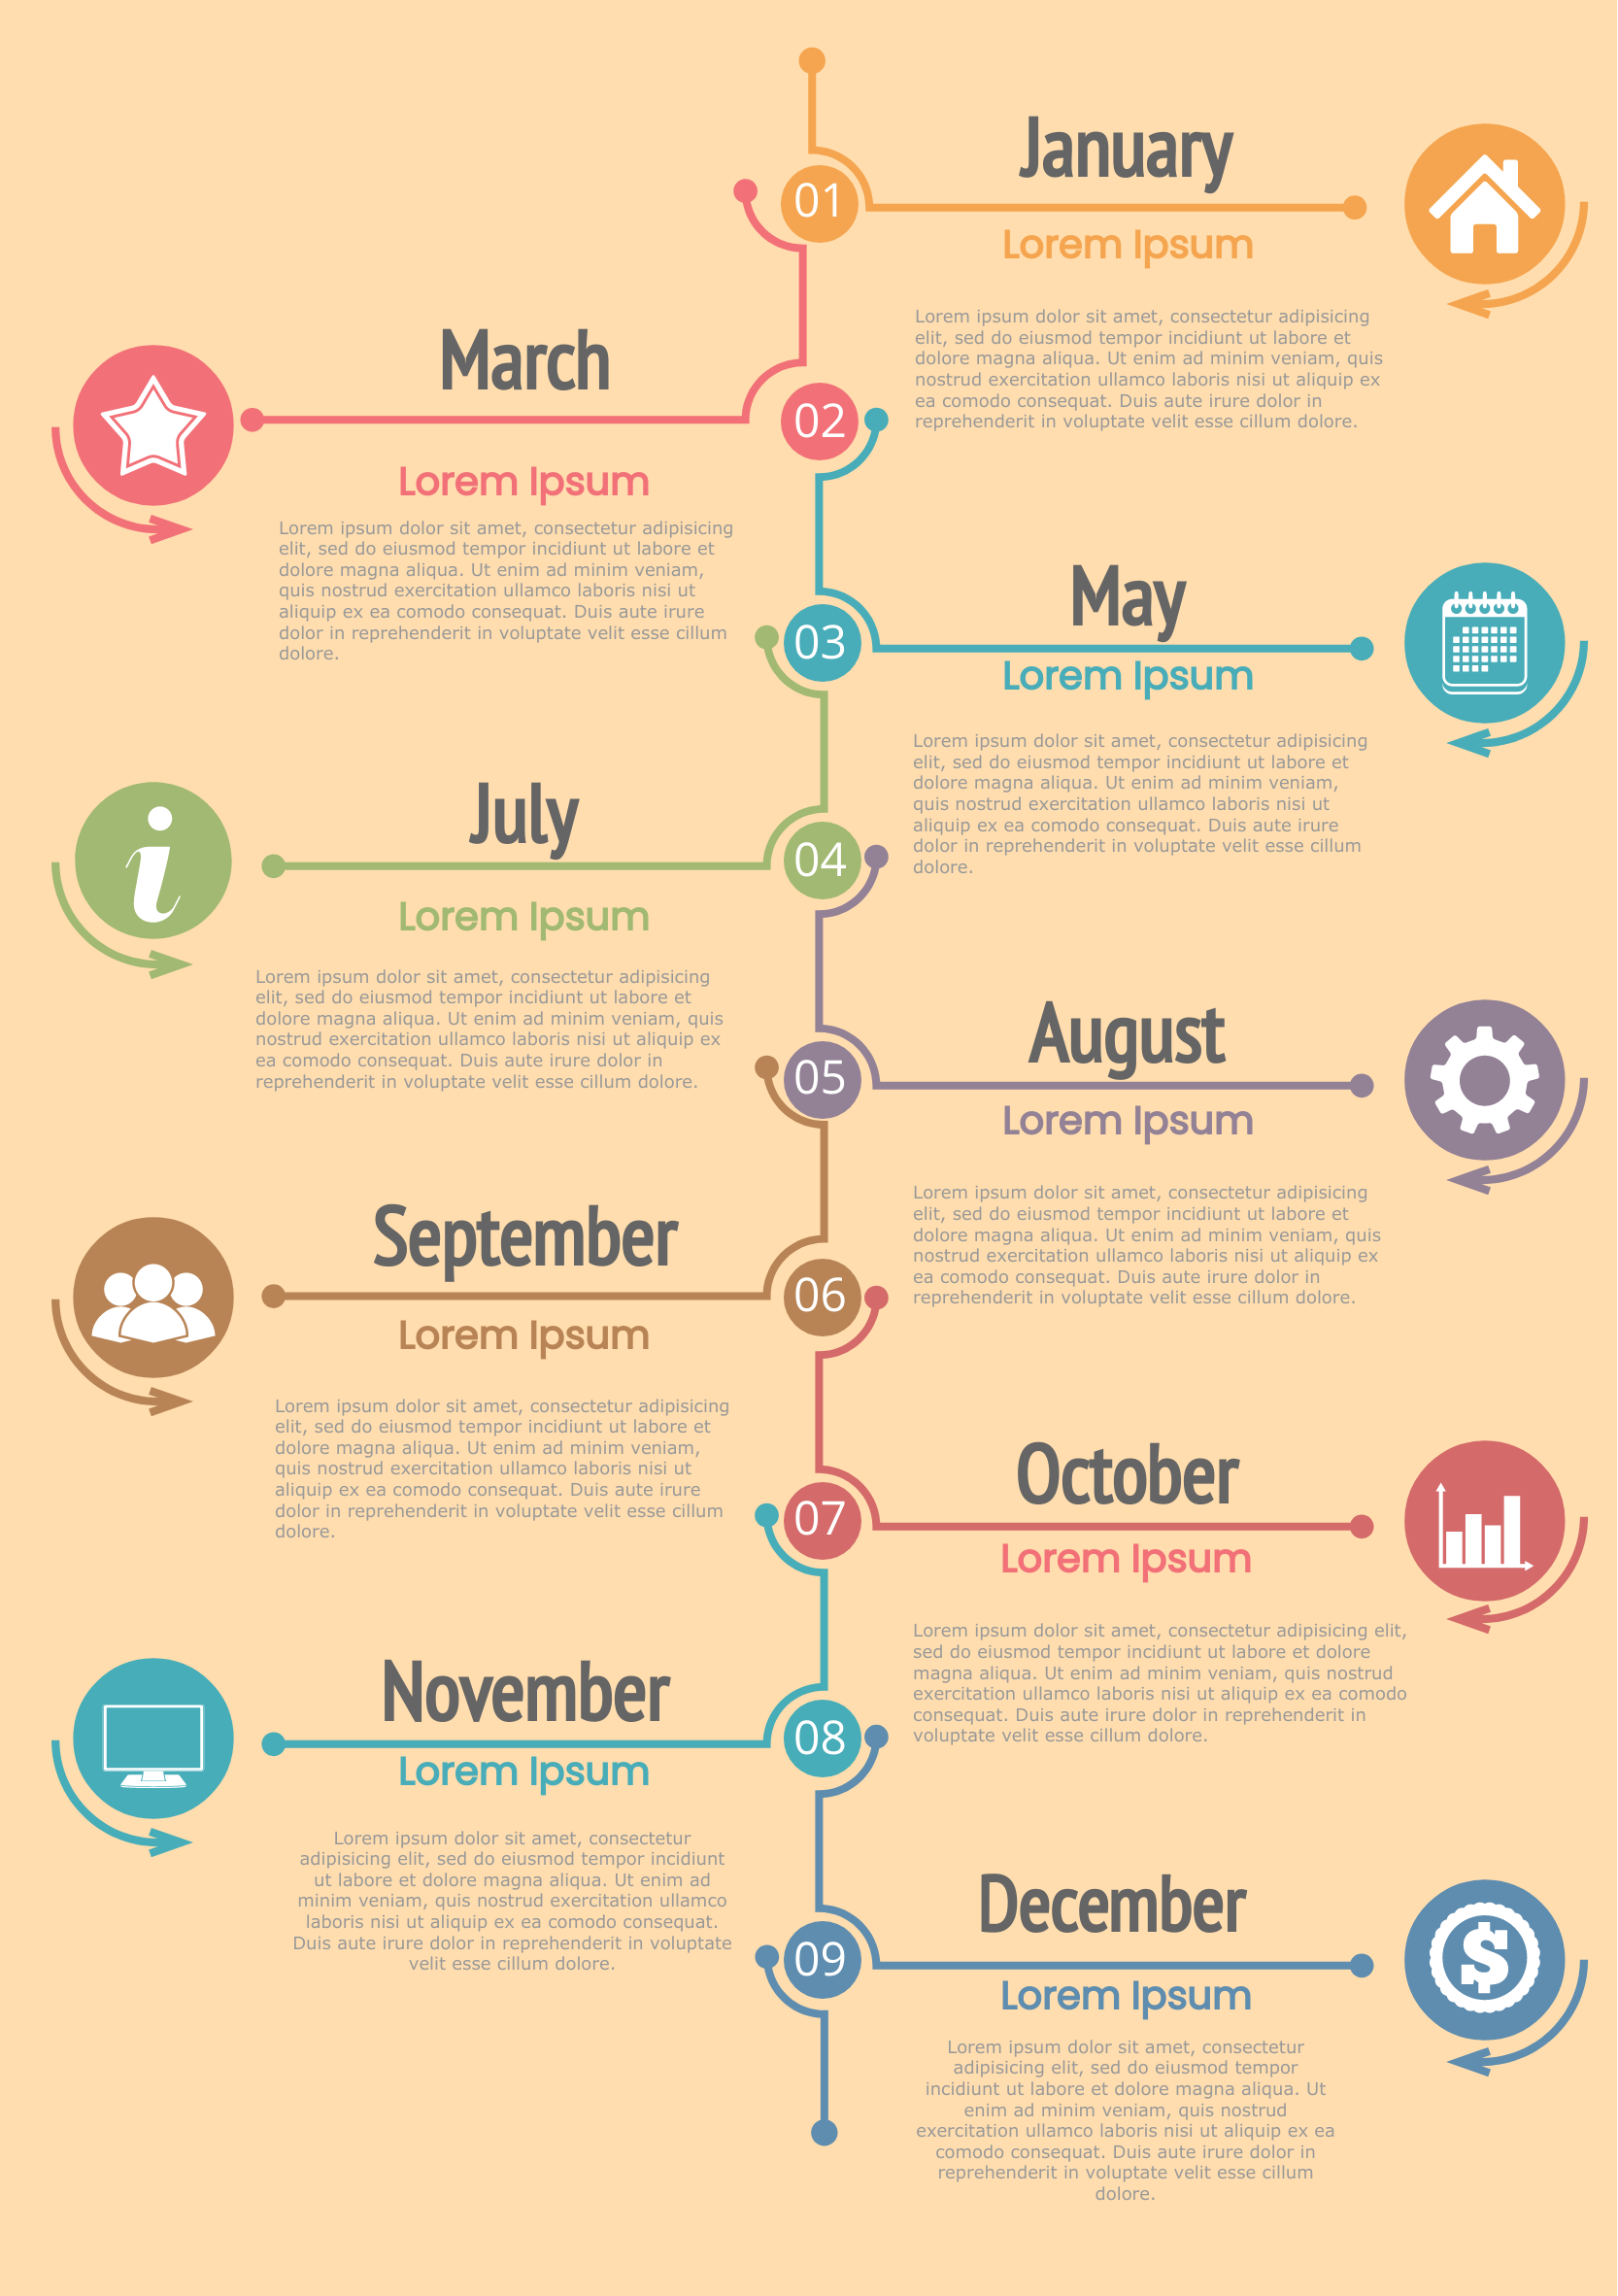
8. Create a language learning infographic to visualize language learning goals and milestones for each student.
You can do this at the beginning of the year to motivate your class to achieve them.
It’s a good idea for educators teaching elementary or middle school students. With timeline infographics, you can also visualize the milestones of the journey and give rewards to students for reaching them.
Getting started with your language infographic
A language learning infographic is an essential tool in the modern classroom.
From visualizing lesson plans to tenses and modal verbs, teachers can use them to present information that’s memorable and fun at the same time.
Regardless of the idea you choose, the most important thing is to be creative. Infographics are easy to create with infographic templates – no coding or web design skills necessary.
Editor’s note: This blog post was written in collaboration with Kristin Savage of Subjecto. She has been writing about technology in education for over a decade, having created numerous guides, case studies, and blogs. She enjoys reading fiction, enjoying nature, and discussing things on Reddit.