Did you know that over 65 percent of people are visual learners? Or that visuals make it easier for the brain to process information faster than text or speech?
For these reasons, visuals are becoming one of the best ways to communicate information in today’s world.
As a business owner, it’s your job to communicate with your audience and customers. You have to let them know:
- What your business does
- Who you serve
- What products or services you provide
- Why consumers should choose you
Of course, in today’s fast-paced world, you also have to find ways to communicate your points clearly and concisely. After all, you only have about 8 seconds to grab someone’s attention (and business).
Visuals – especially infographics – allow you to do just that.
Start with a story
As a business owner who knows the power of visuals, you might be tempted to just create an image, share it on social media, and call it good. But those images rarely help you get traction, more sales, or better customers. Why? Because there is no story.
Every audience across all industries love stories because they demonstrate the value of the information – the moral to the story, if you will. When you’re creating an infographic, don’t get caught up in the size of your icons or the color template just yet. Instead, ask yourself:
What story am I telling?
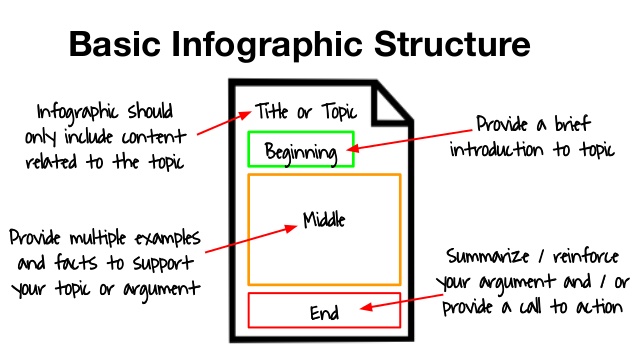
Stories have a beginning, middle, and an end – and so will the message you’re trying to send to your audience. Whichever aspect of your business you’re trying to share, make sure that you have the main parts of the “story.” This helps grab attention and ensure that you’re getting to the point. From there, you can design your infographic in line with the “plot” of your story.
Pro tip: We recommend always doodling or mapping a “rough draft” of your story before you visualize it!
The second part of the message, the visual aspect of the infographic, is designed to drive home the story of your business, your products, or why a customer should work with you. Design templates with Easelly are virtually limitless, but you have to know which one will cater to your story – NOT the other way around. That’s why starting with your story is the first part of communicating better with infographics.
Next comes the design aspect.
What else does your story need?
You’ve got your story now, right? You know the point you’re trying to make with your infographic, and you have your message broken down into a beginning, middle, and end. Now it’s time to use Easelly’s infographic maker tool to visualize it.
To communicate effectively with your infographics, you need:
- The actual data or information (services or products)
- Clear organization (beginning, middle, and end)
- The proper use of visual elements (images, fonts, etc.)
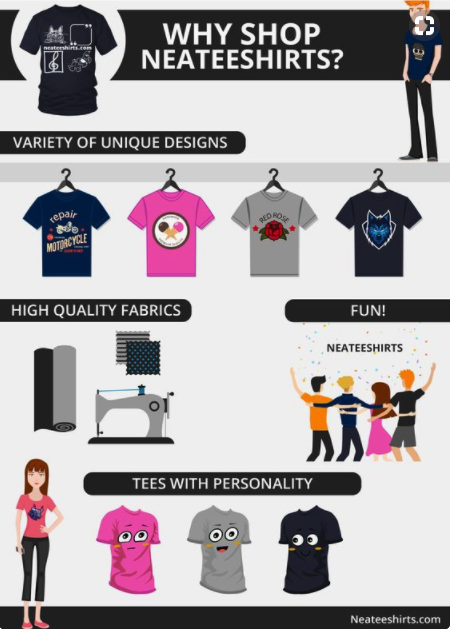
To communicate best, we recommend using objects and images to replace as much text as possible. Take, for instance, this infographic from Neateeshirts.com. It highlights services, products, and why consumers should purchase from them – without tons of text.
Instead, images and icons are used to tell the story.
Essentially, the best infographic communication includes:
- Simple statements
- Clear organization
- Engaging visuals
- A call to action
Infographics can be pages and pages long, but that’s cluttering up the communication between your business and your customer. We recommend getting to the point as soon as possible. Your audience will thank you for it – and you won’t spend forever trying to create an infographic that tells the whole story.
Don’t have time to make infographics?
We offer our new infographic design service to small and large business owners who just don’t have the time (or desire) to make their own. Simply fill out our order form and we’ll have a first draft in 48 hours.
Recommended resources for business infographic creation
- Selecting the Best Infographic Templates for Your Business
- How to Use Infographics to Generate Qualified Leads for Your Business
- Image SEO Tips for Small Businesses and Startups