
There are two kinds of webinars in this world.
You have webinars that make you feel like you’re ready to take on anything after an hour of new insights, ideas, and inspiration — may it be signing up for a short course or starting your first website. The speaker was confident, and everything was glitch-free.
And then there are webinars with poor audio or generic content. Webinar presenters who read their slides word for word are the worst.
A great webinar is a result of a knowledgeable and fluent presenter, unique content, glitch-free platform, and using the right medium for an engaging presentation. It all boils down to providing your audience with a stellar experience while they’re interacting with you.
Speaking of medium, we’ve put together this guide on how to use infographics to pull off an engaging, memorable webinar.
As brands of all sizes start to produce more webinars and virtual educational resources in light of the pandemic and stay-at-home policies around the world, the pressure has never been greater to put on the best virtual talk possible.
Why use infographics for webinars
When your attendees are just staring at you on the screen, what are the odds that they’re retaining what you’re saying?
What if they’re distracted by the lovely picture on the wall behind you or the sounds of the cafe you’re in?
If you want your audience to get something out of your webinar (other than your adorable cat or dog in the background or your lovely home office) try incorporating visuals like infographics that allow your audience to focus on what’s important.
Why use visuals in your webinar?
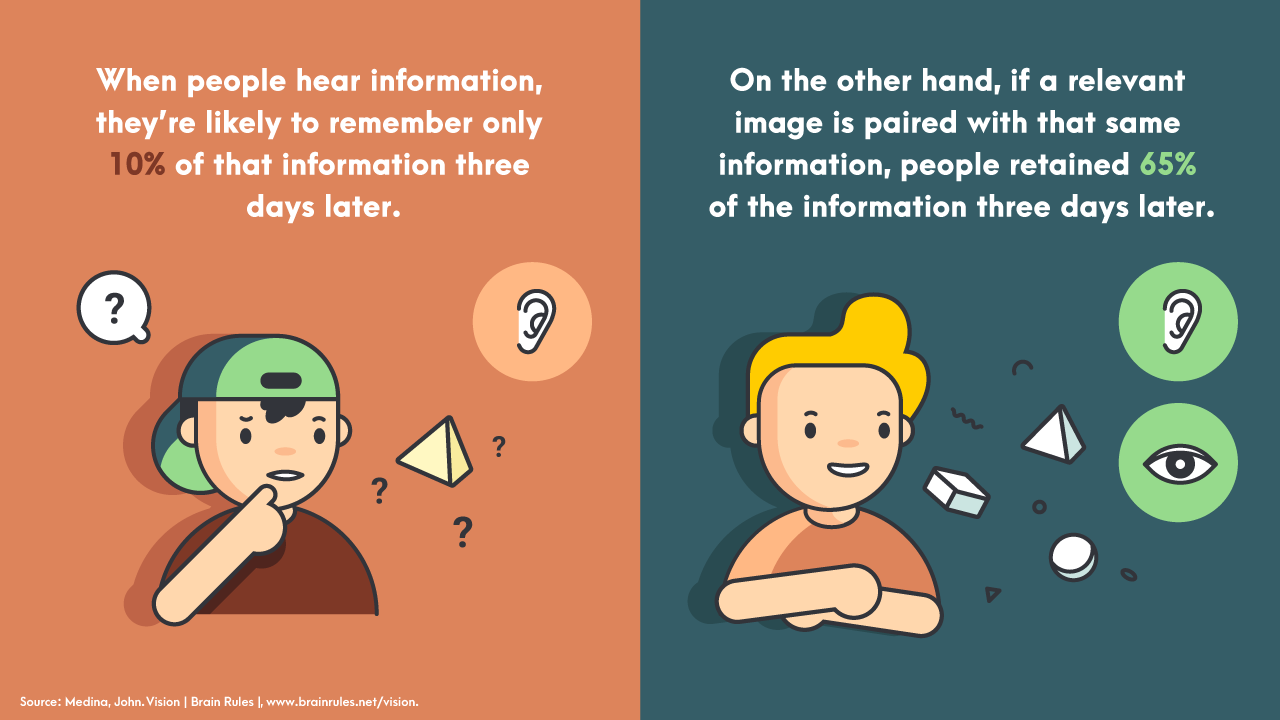
According to John Medina, author of Brain Rules, when you listen to information, you’re likely to remember 10 percent of that information three days later. Meanwhile, if a relevant visual is paired with that same information, you will likely retain 65 percent of the information three days later.
Not only do infographics and visuals help your audience retain information, but they also help with you with the following:
Engage
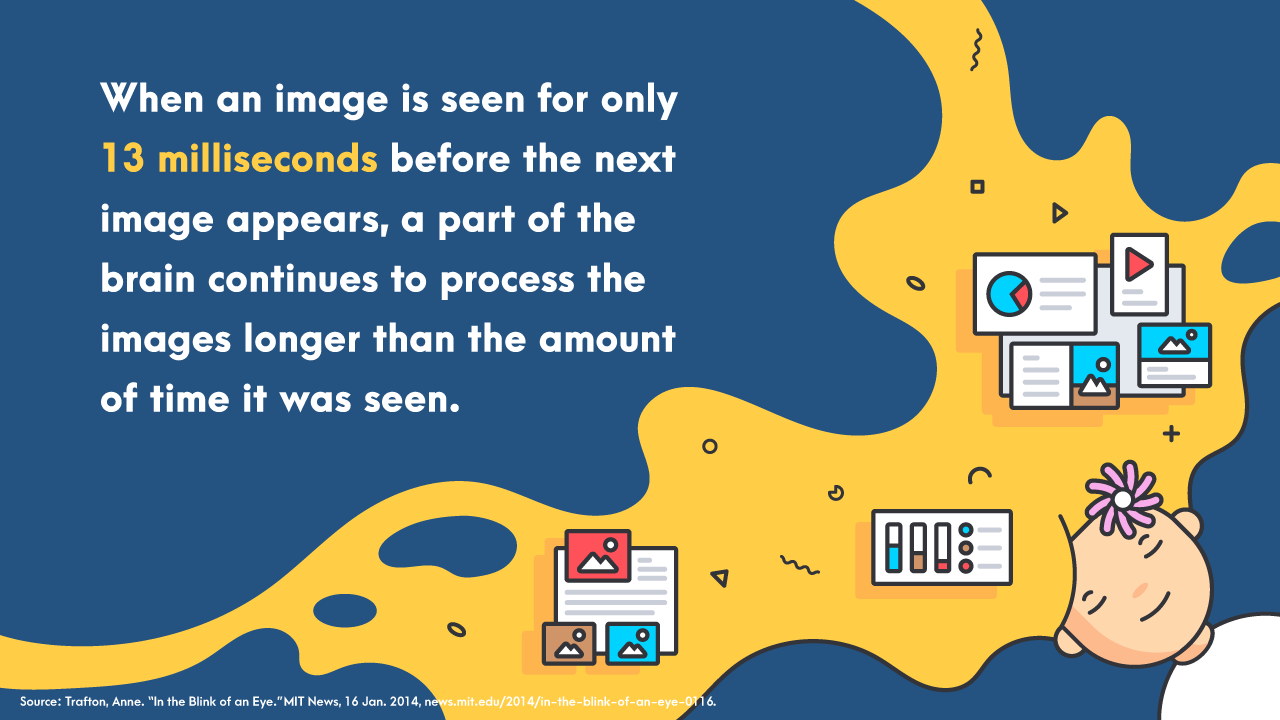
Our average attention span is 8 seconds. On the other hand, it only takes 13 milliseconds for brains to process an image, which is much shorter than 8 seconds. Why not cut to the chase and grab your audience’s attention right off the bat?
Educate
Adding color to your infographics increases readers’ attention spans and recall by 82 percent.
Build brand trustworthiness
An effective infographic that balances concise writing and clear hierarchy is a significant contributor to making your audience see you as an authority, which makes them more likely to believe what you’re saying.
Visuals have also proven to generate more leads and result in more conversions.
But how?
Let’s proceed to how you can get better with your webinars and perhaps transform yourself into a webinerd!
3 infographic best practices for a webinar that converts
In a 2019 survey of webinar creators and hosts by ON24, 76 percent of the respondents agreed that webinars enabled them to reach more leads. Encouragingly, 50 percent of the respondents claimed that the quality of leads generated from their webinars is above average.
Take note of the following best practices in using infographics for lead generation in your webinars:
1. Highlight the essential points of your webinar.
Use images or symbols that represent your points and then expanding on those points with minimal text. Do not type out all your webinar notes in your infographic.
Also, consider visuals, colors, and fonts that your audience would find most engaging.
2. Add a call to action (CTA) in your infographic.
Call-to-action statements are vital in making an engaging webinar through infographics. Without them, people will think, “That’s nice, but I don’t have to do anything about it.”
A call-to-action in your infographic could be the following:
- Writing something down (taking notes)
- Visiting a web page, booking your services, buying your product
- Following you on social media
- Signing up for your newsletter
- Downloading a resource you made for your webinar audience
3. Communicate the value of your product or service
The visual content you provide in your webinar should be relevant, helpful, and actionable. But don’t forget to bring back the focus to the value you’re offering through your products, services, or website.
In all of your infographics within your webinar, make sure you:
- Use consistent color schemes, logos, watermarks, etc. to remind viewers of your brand
- Link to your website if possible
- Your data from surveys or research you’ve done
- Your unique insight or idea
- Special offers for webinar attendees – promo code, special link, etc.
- Information on how your attendees can get hold of your webinar slides
Beyond the webinar: Other ways to use your infographics
The thing that makes infographics a stellar platform is that they’re not limited to just the webinar itself.
You can use the infographics you create for your webinar in multiple ways, in various places, and for as long as you still need the content.
Here are some ideas:
Use them for a printable resource.
Encourage attendees to save, share, and continue to learn from your content by downloading your infographic.
Promote your webinar.
Create advertisements, landing pages, and marketing materials with your infographics. Not only will people be more drawn to your ads, but it creates brand cohesion when you have consistent images, colors, and content across platforms.

Encourage your audience to share them on social media.
Share infographic links to your sign-up page, webinar recordings, or landing page with your infographics as social media thumbnails.
You can divide your infographics into sections so you can share snippets on social media. Use this quick guide to infographic sizes for online and offline use. Alternatively, you can transform them into animated infographics.
Creating infographics for your next webinar
While many would think that infographics are complicated, expensive visuals that they have to buy from a graphic designer, you can make infographics quickly with an infographic maker tool like Easelly.
The video tutorials below are good starting points.
How to customize infographic templates in Easelly (video)
How to write content for your infographics (video)
10 Easelly shortcuts you need to know (video)
Add your infographic to your webinar presentation
Once you’ve created your infographic, you can add the infographic (or snippets of it) into a slideshow, and create an impressive visual presentation for your webinar.
Share your screen during the webinar and put your slides in presentation mode and voila!
If you don’t have enough time to make infographics on your own, our infographic design team can help. Good luck with your webinar. We’re rooting for you!