
If you’re new to making infographics or have only used them a few times, you may be wondering what exactly you can do with them once you create them. Creating an infographic is half the battle. You also want everyone to see your awesome work, right?
How to share your infographics
Using Easelly’s infographic templates is easy, but what you decide to do with your images once you’ve created them is entirely up to you.
In this article, we’re going to take you through a number of ways that you can download and share your infographics using Easelly.
Hopefully, these infographic sharing recommendations will make sure that you get the most bang for your creative buck!
Download your infographic.
With Easelly, you can download your image straight to your desktop or phone/tablet’s camera roll, and share it across your social media.
Use the JPEGs, PNGs, or PDF files in promotional materials, for a page in your book, for a classroom lecture, or for a boardroom presentation slide. You can also use these infographics on your personal or business websites, on your blog, or in your emails. Whichever way you choose, your information, cause, or business will get a lot of exposure.
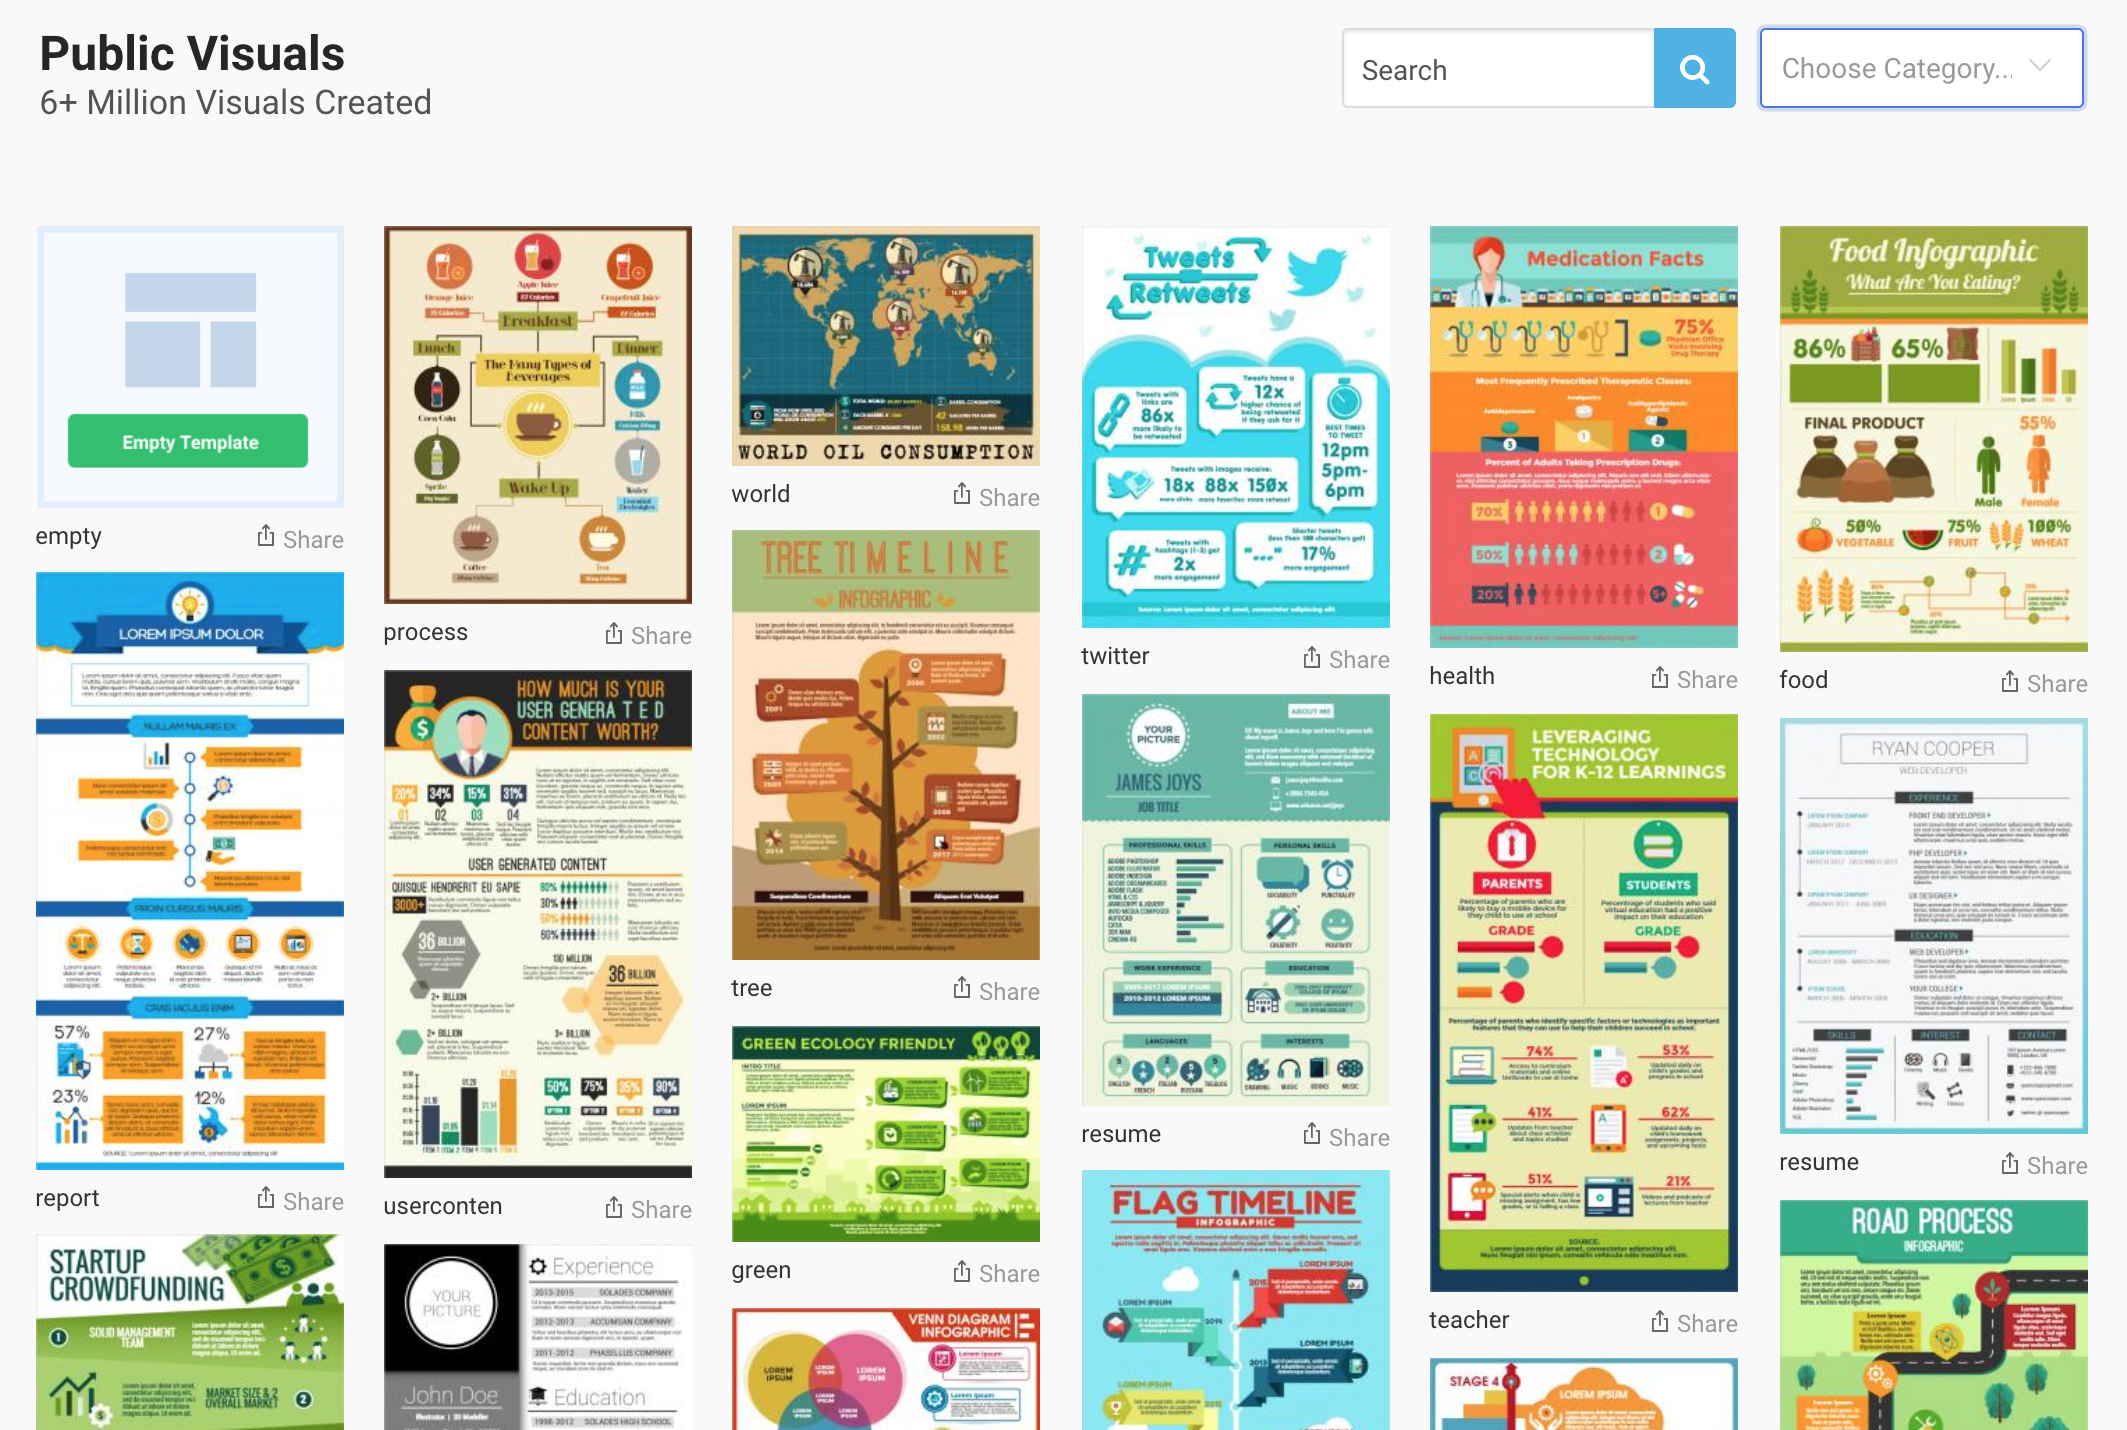
Alternatively, you can also save the infographic to Easelly’s “Public Visuals,” and let fellow Easelly users see the awesome stuff you’ve created (and maybe even use it themselves as a template).
Embed your infographic.
If you have a blog or a website that you’ve created the infographic for, or you want to insert infographic into an email newsletter, we strongly suggest that you embed the code.
This allows your infographic to appear exactly where you want it to on your page and has the added bonus of letting people see the infographic in larger detail by linking back to Easel.ly’s site.
Don’t know what embed codes are? Neither do we!
Just kidding!
Essentially, embed codes are lines of code that you source your image from – the “home base” of the infographic, so to speak. So whenever someone shares your image, that embed code follows the image, and the audience of anyone who shares your infographic can engage with it on Easelly when they click it.
But how in the world do you get the embed code?
Watch the quick tutorial video below in embedding your infographic in a standard HTML page or within your WordPress blog.
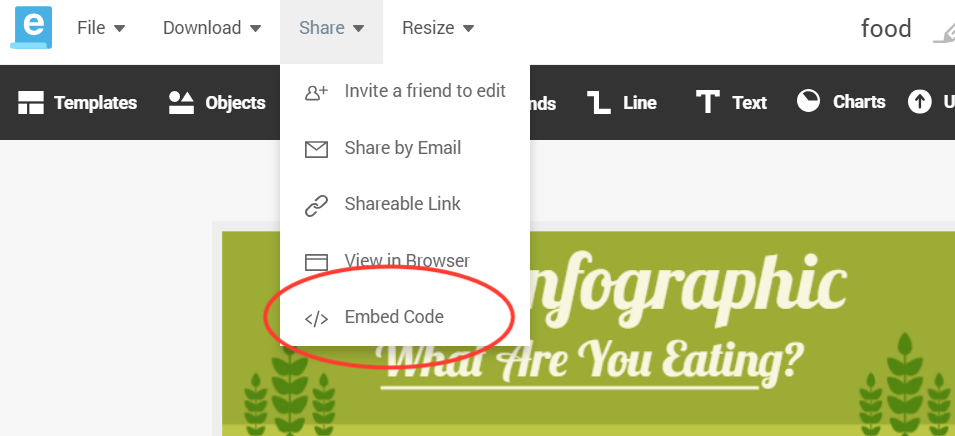
Step 1: Open the designer and then select “Share” then “Embed Code”.
Step 2: Next select “Copy” from the dialog that pops up.
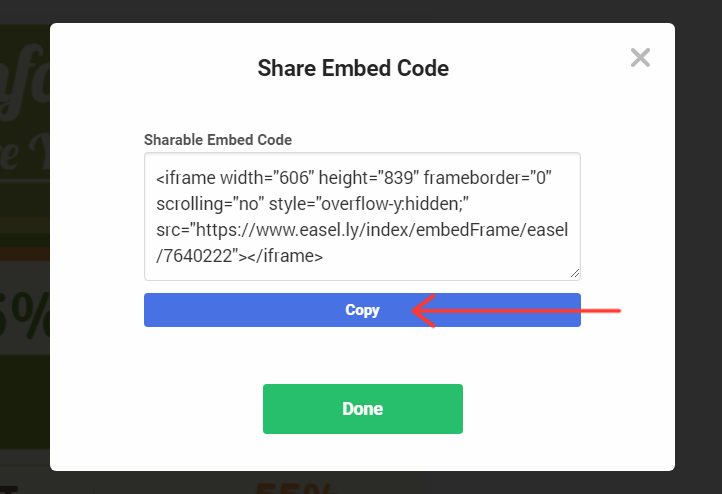
Once you have copied the code, you next need to embed it into your blog or web page.
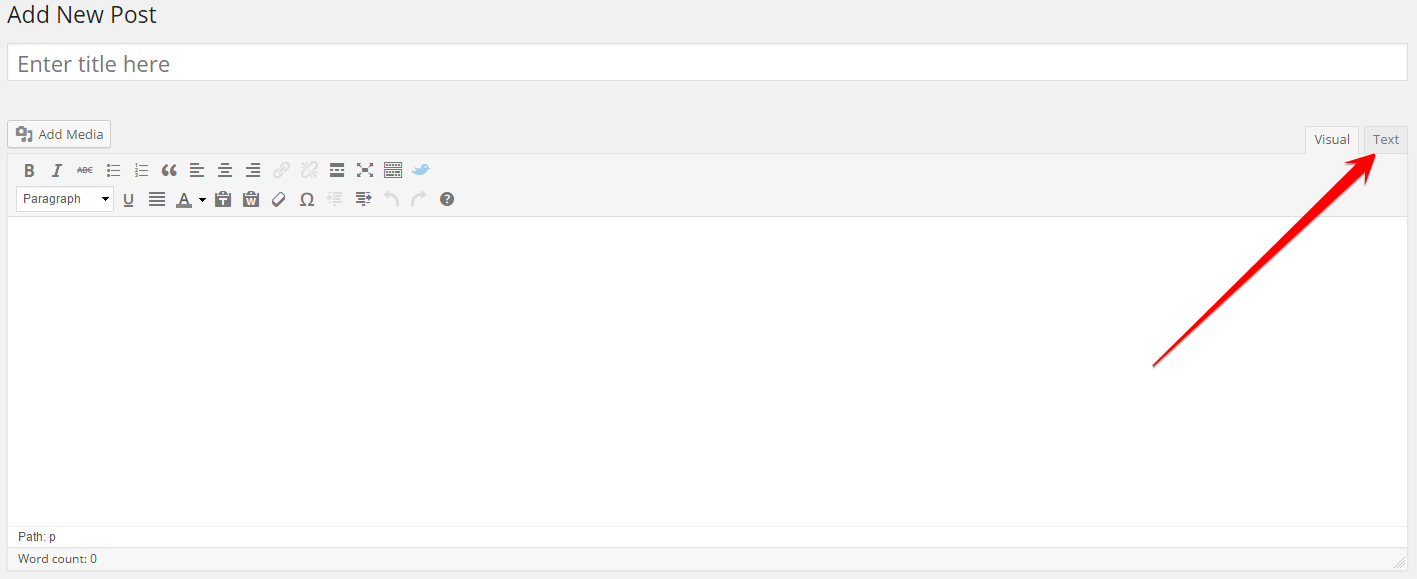
1: Once in WordPress create a new page or post.
2: You now want to select “Text” from the top right.
3: Simple copy your embed code into the Text section of WordPress.
If you’re still unsure as to whether or not the embed code works you can try the following website that will let you render your iFrame code.
1: Go to this location.
2: Now just copy your code anywhere between the <body> and </body> sections and hit “See Result”
Besides downloading your infographic or embedding it to your website or blog, you can also share it through the following:
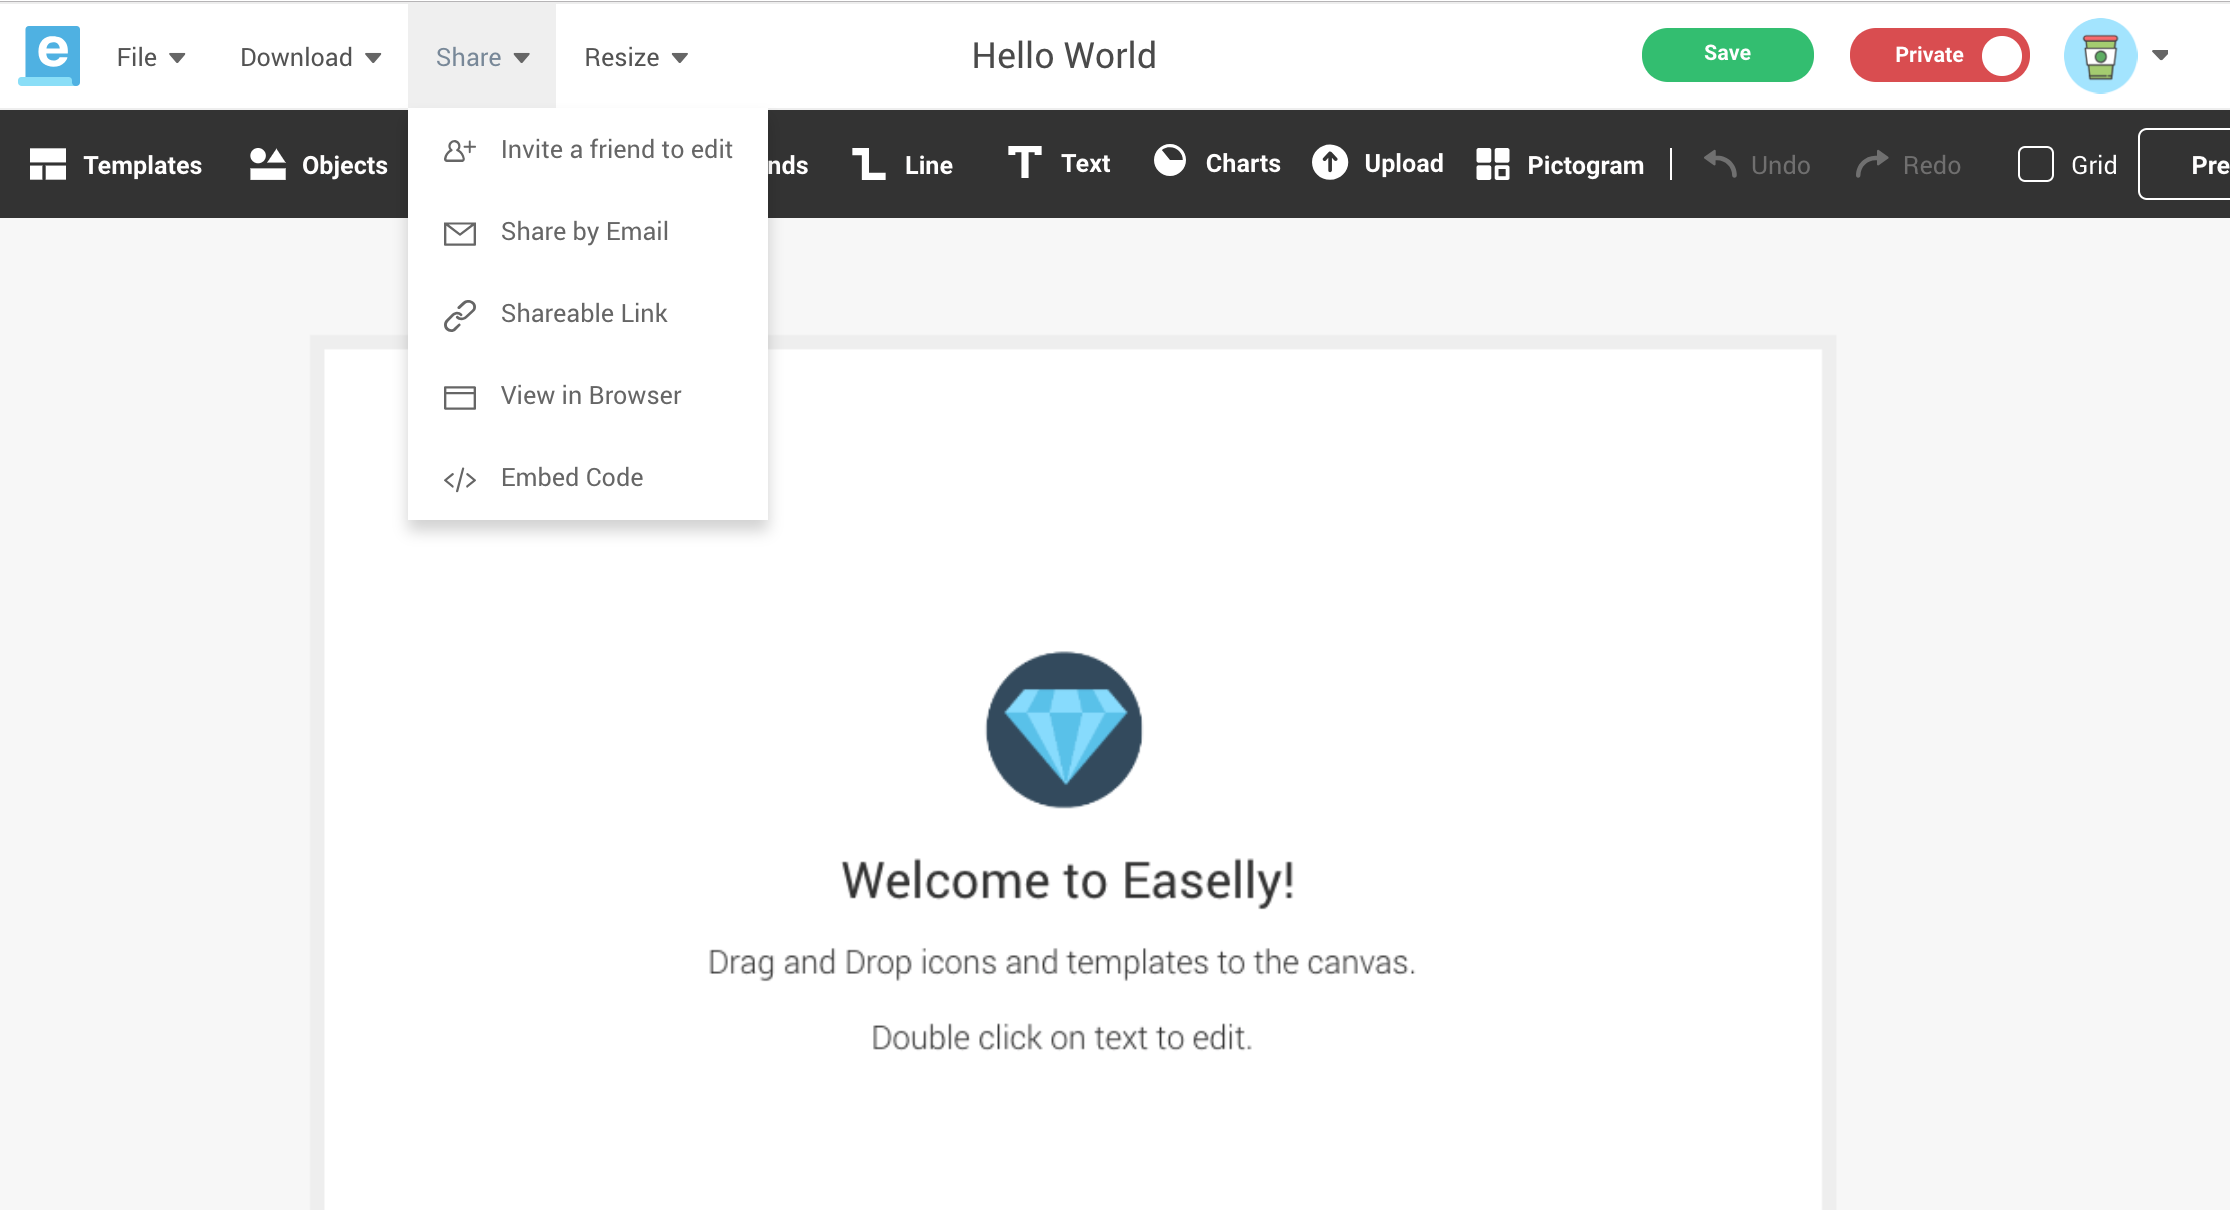
- Invite a friend to edit: Collaboration is possible with this option. The person you share this to can make changes on your work if that person has an account. Here’s a short tutorial to co-authoring your infographic if you’re curious.
- Share By Email: This will allow you to share your infographic with just one other person. Only the person you share the infographic will be able to reuse it.
- Shareable Link: A shareable link allows a user to both see and reuse your infographic. The only people that can see and reuse the infographic are people whom you give the link to. You can also share the link on social media.
- View in Browser: This sharing option allows you to see your work out of the edit page.
- Share your infographic to Twitter and Facebook: Show off your creation to friends!
That’s a wrap on the different ways of sharing your infographic to the world!
If you’re working on an infographic or a visualization project for a certain advocacy and would like to share your work (and the story behind it!), let us know in the comments or email support@easel.ly. We’d love to feature it as an Easelly user story.
Additional resources when sharing your infographic:
- How to Create Infographics for Instagram to Get More Engagement
- Guide to Infographic Size and Dimensions: A Cheat Sheet
- The Complete Infographic Checklist for Your Next Easelly Infographic
*Editor’s Note: This blog post was updated on January 9, 2019 for accuracy, new updates, and comprehensiveness. It was originally published on May 16, 2016.