
It’s time for our first edition of Easelly user stories for the new year!
What are Easelly user stories?
These stories are about Easelly users whose infographic creation and advocacy caught our eye on social media.
In the past, we’ve featured two educational specialists for English Language Learners, a school librarian, a TOSA educator, geologist, and an advocate of open educational resources, just to name a few.
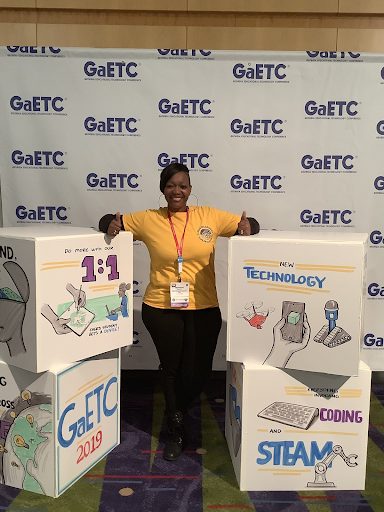
This time around, we chatted with Nefertiti Singleton, a PBL Teacher (K-5) at Oakley Elementary School in Union City, Georgia.
How to use infographics for project-based learning
Let’s get to know her, her teaching style, and advocacies below!
Hello, Nefertiti! Tell us about yourself and your teaching background.
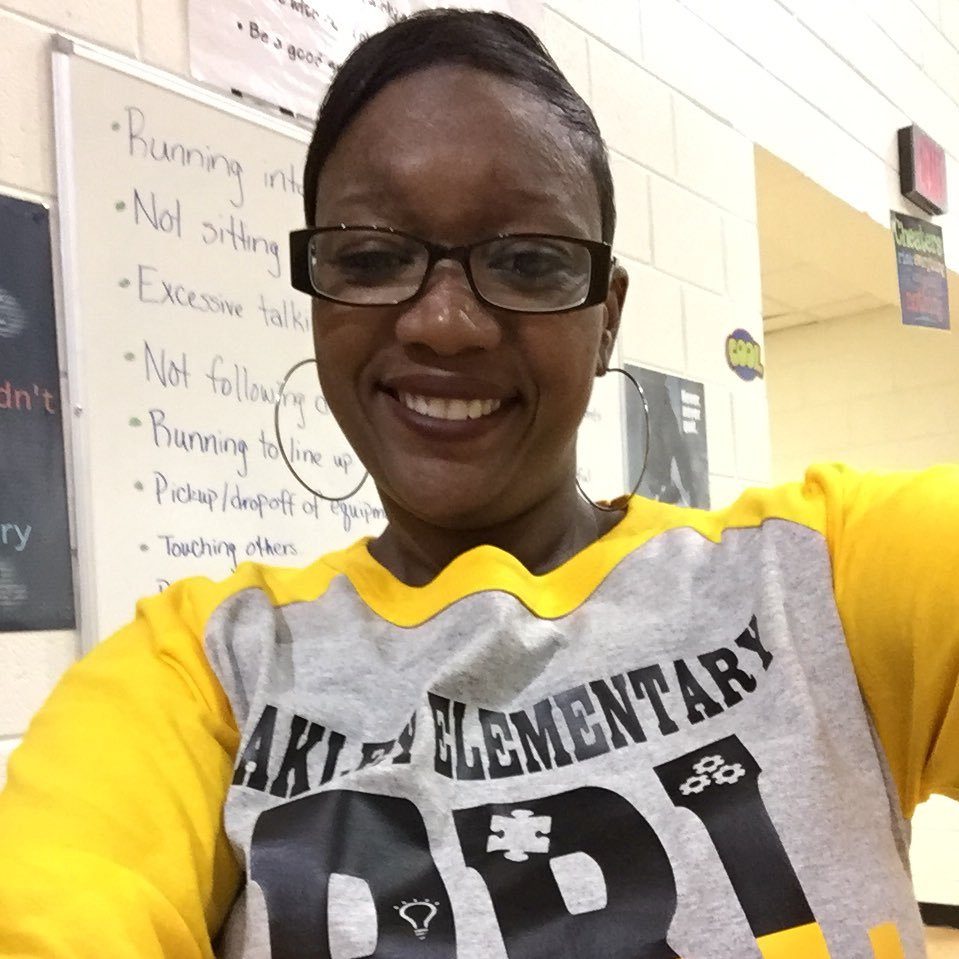
I am a native of Atlanta, Georgia, and a proud wife and mother of two. I am a product of Fulton County Schools and I sought to come back and teach in the same school system.
I wanted to make an impact with my students like some of the very educators that imparted so much in my life as a young person.
I attended the University of West Georgia (BS in Early Childhood Education), Kennesaw State University (Masters in Special Education) and Lincoln University (Educational Specialist In Curriculum and Instruction).
All of my experiences thus far has enlightened me on my journey and I am proud of all the networks I have obtained from each level.
I currently teach at Oakley Elementary School in Union City, Georgia. I have been teaching for 18 years; I taught 4th grade and various levels for 13 years and have been teaching Project Based Learning (PBL) for the last five years.
What’s your day like as a PBL teacher?
My days as a PBL teacher are quite interesting.
Five years ago, I was given the opportunity to pilot a new program at my school in a lab setting. No other school in my district has the model we have. I am a special area teacher and I teach all grade levels K-5.
Each day is not the same, I see different grade levels depending on their scheduled days. The content area that I teach is mainly social studies with the integration of other subjects depending on the project.
Cool! Tell us about the rewards and challenges you have right now in your current role.
The most favorite thing about my job is having the autonomy to think outside the box, innovate, and create projects that I feel will extend learning outside of the classroom walls for my students and their teachers.
While there are several challenges with my job, timing being the main one, it is one that I have to create workarounds for because there never seems to be enough time to get it all in.
A challenge that I’ve successfully “bounced back” from is thinking that some of my K-2 students are not ready for some of the rigor in the projects that I plan for, but with more scaffolding and patience some of them really do rise to the occasion and have those ah-ha moments that make it all worthwhile. It’s the nature of the beast, but I love it!
That’s inspiring. How’d you discover Easelly for your students?
I discovered Easelly from a colleague that was showing me about user-friendly infographics.
I was looking for ways to incorporate technology with my students so they can use alternate ways to map out their thinking and learning.
I started using Easelly two years ago because I was looking for an easy way for my second graders to display their work online.
Thanks to your colleague! What do you like about using an infographic maker tool like Easelly?
My favorite Easelly features are being able to drag and drop tools into the templates or blank platforms. I like that you don’t have to go out of the website to get images for the work I do with students, we make it fit.
Quick tutorial: How to Find and Use Photos in Easelly
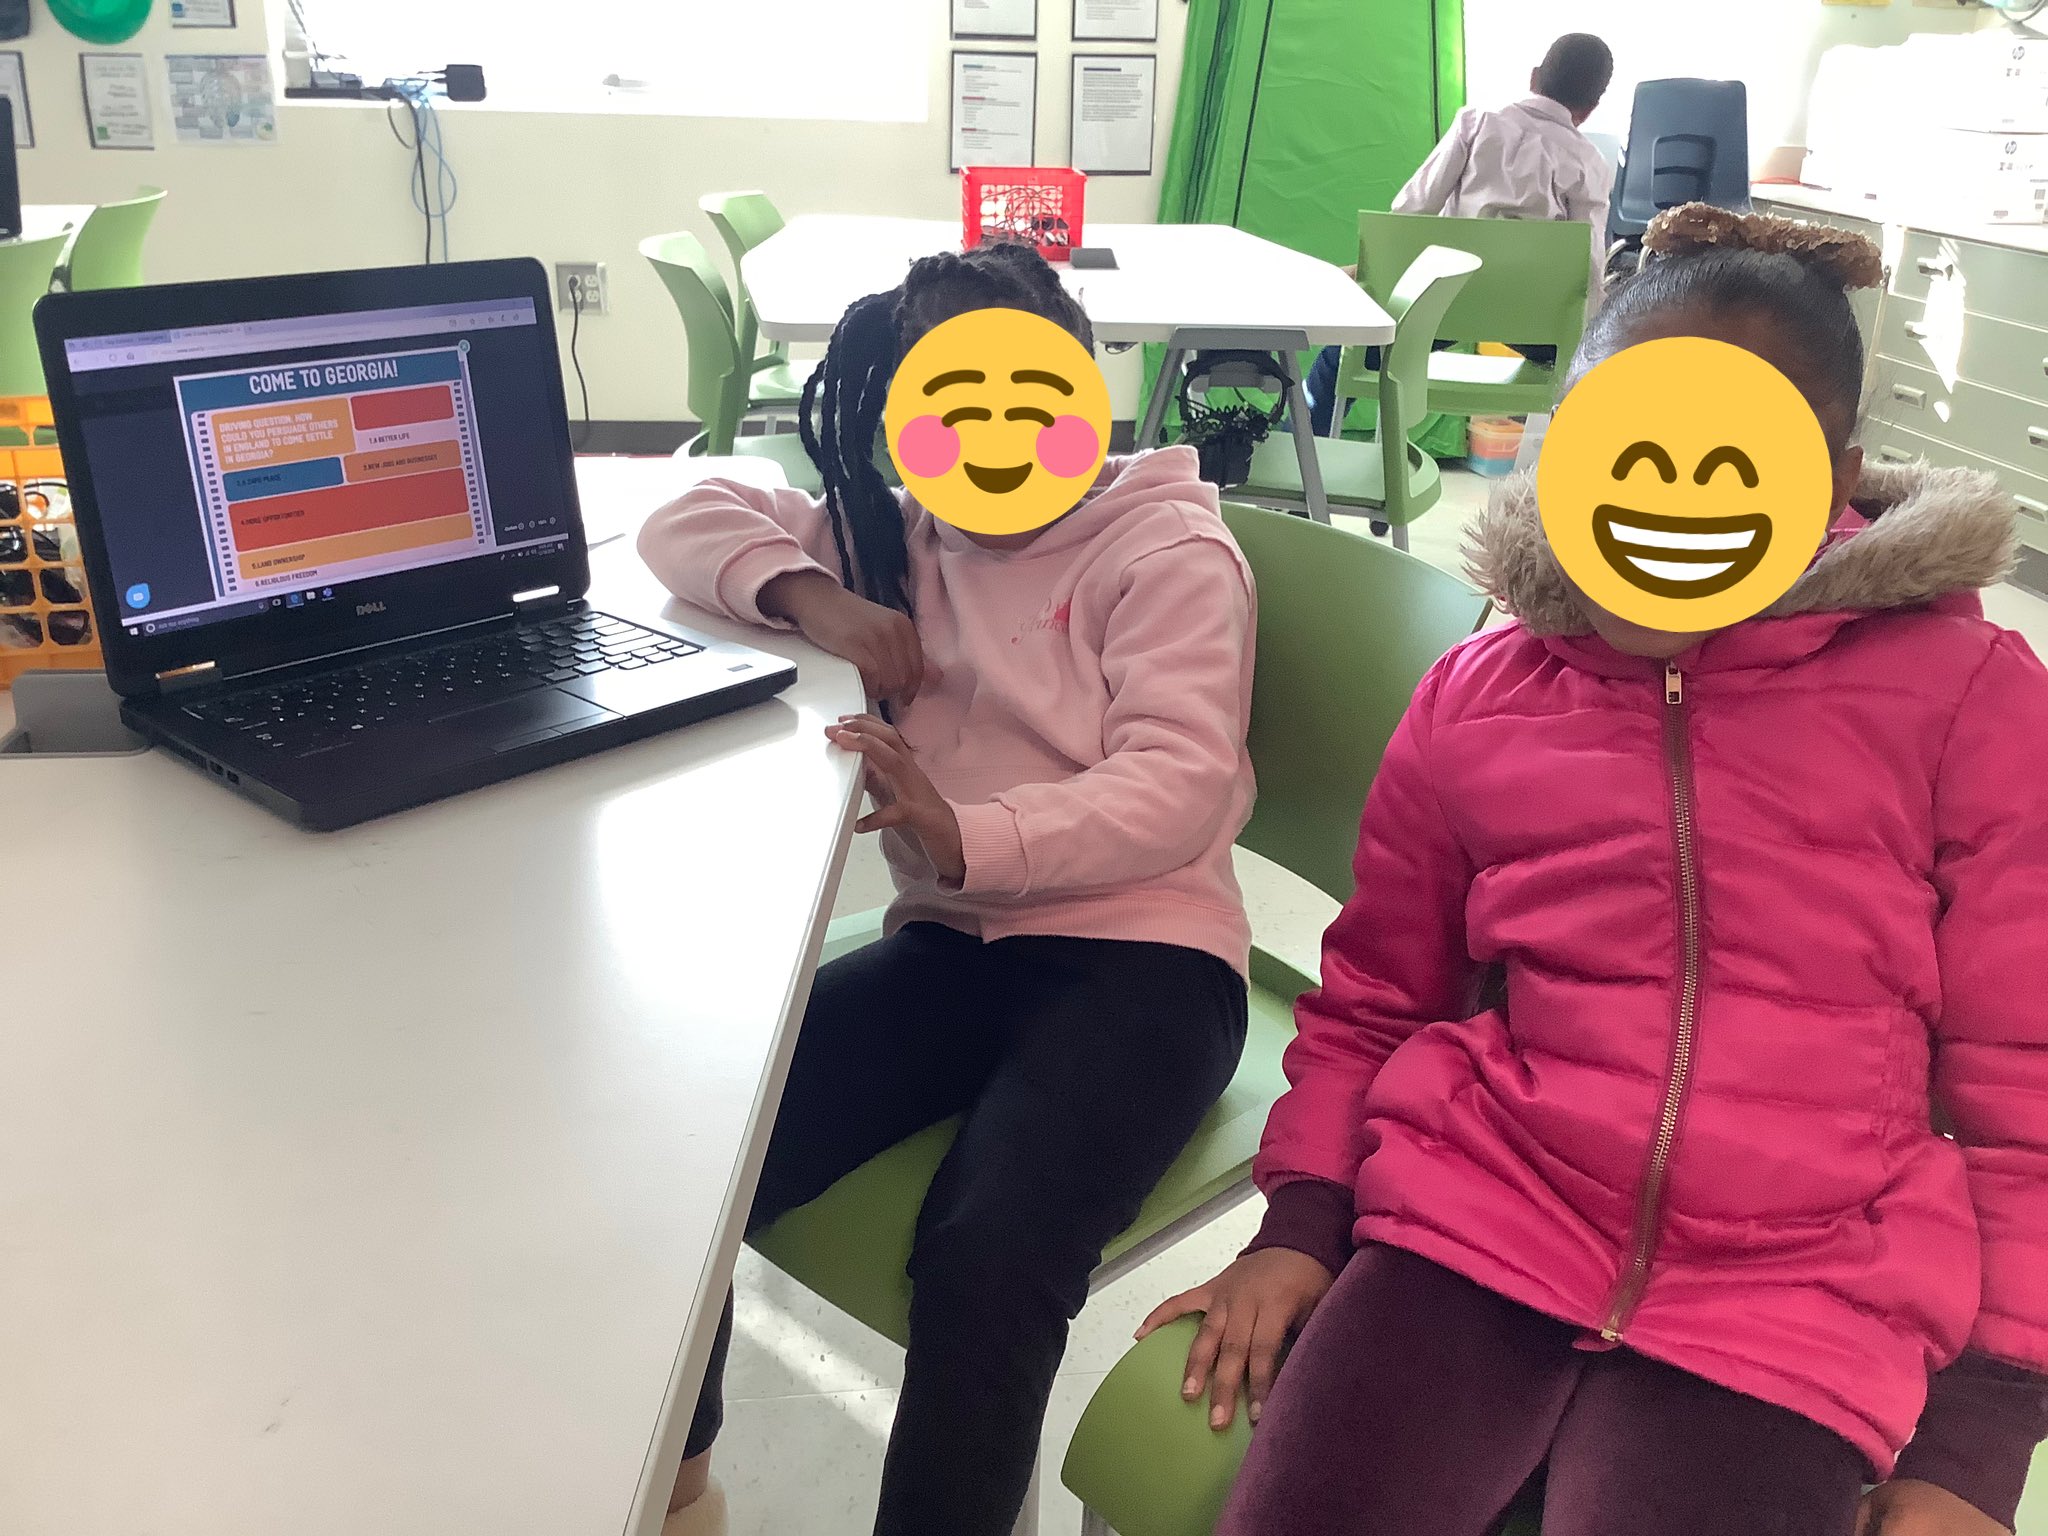
Would you please share an infographic activity you’ve done with your students?
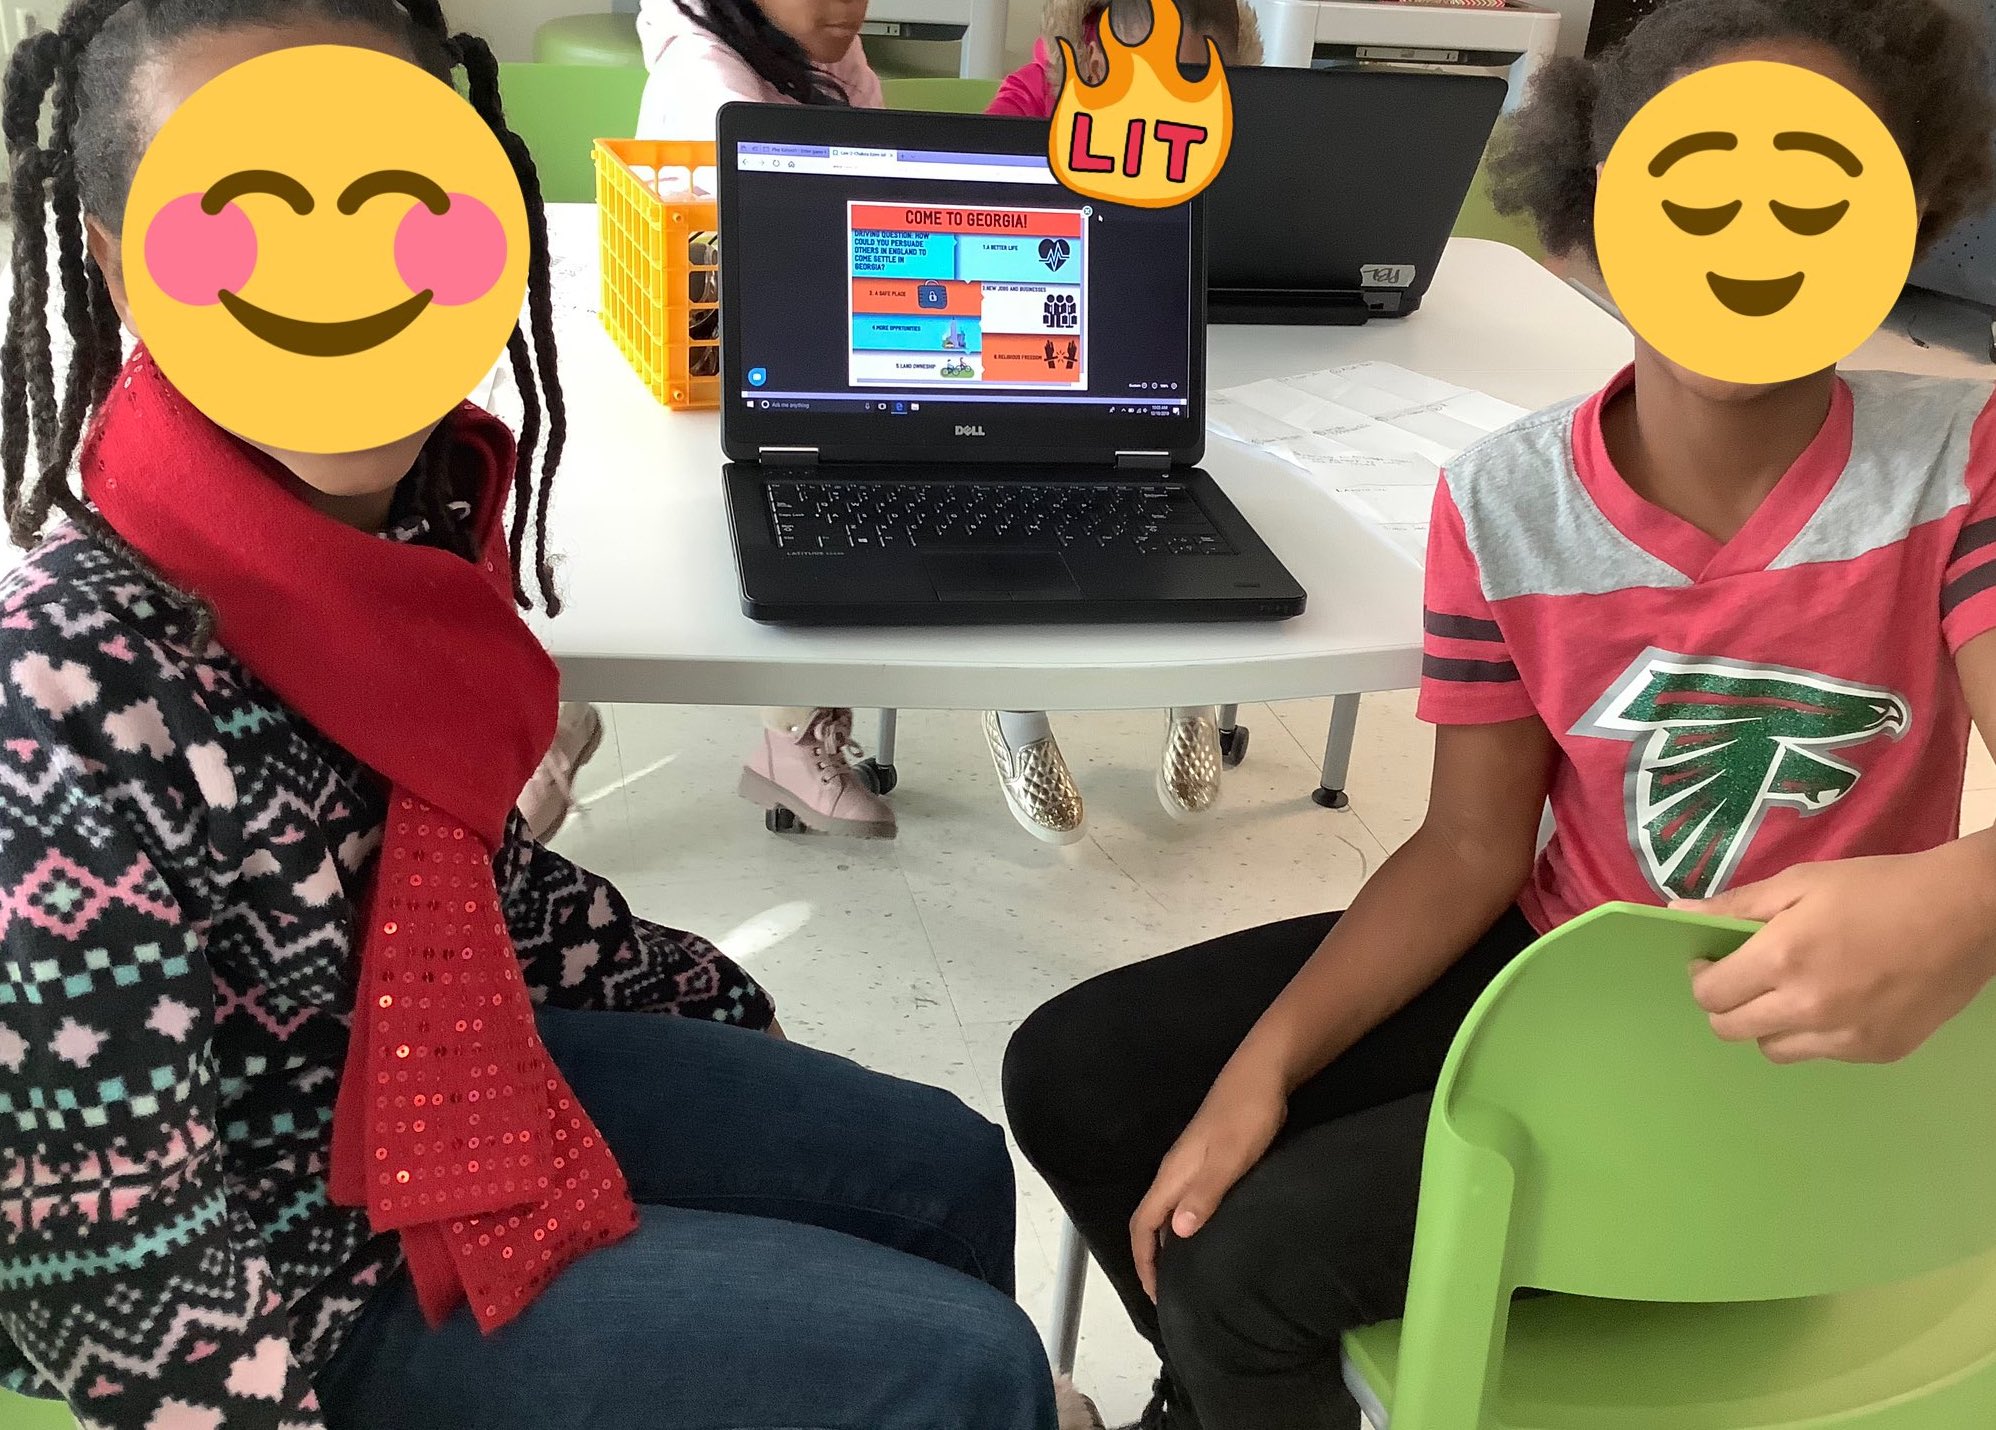
Sure. My goal for creating this infographic activity in the classroom was for my students to be able to share their thoughts on why people from England came to settle in Georgia.
Second graders learned how many people do things that improve life for other people. Students will explain how James Oglethorpe, Tomochichi, and Mary Musgrove helped to make life better for people in Georgia.
After learning about the lives of these historical figures, students will persuade new colonists to settle in Georgia by displaying the benefits of living in the colony.
The students will develop a persuasive presentation that will depict the unique features of Georgia and why new colonists from England should settle there.
Scenario: Imagine you traveled with James Oglethorpe to help establish the colony of Georgia. How could you persuade others from England to come settle in Georgia using an infographic?
Here’s what some of my students came up with:
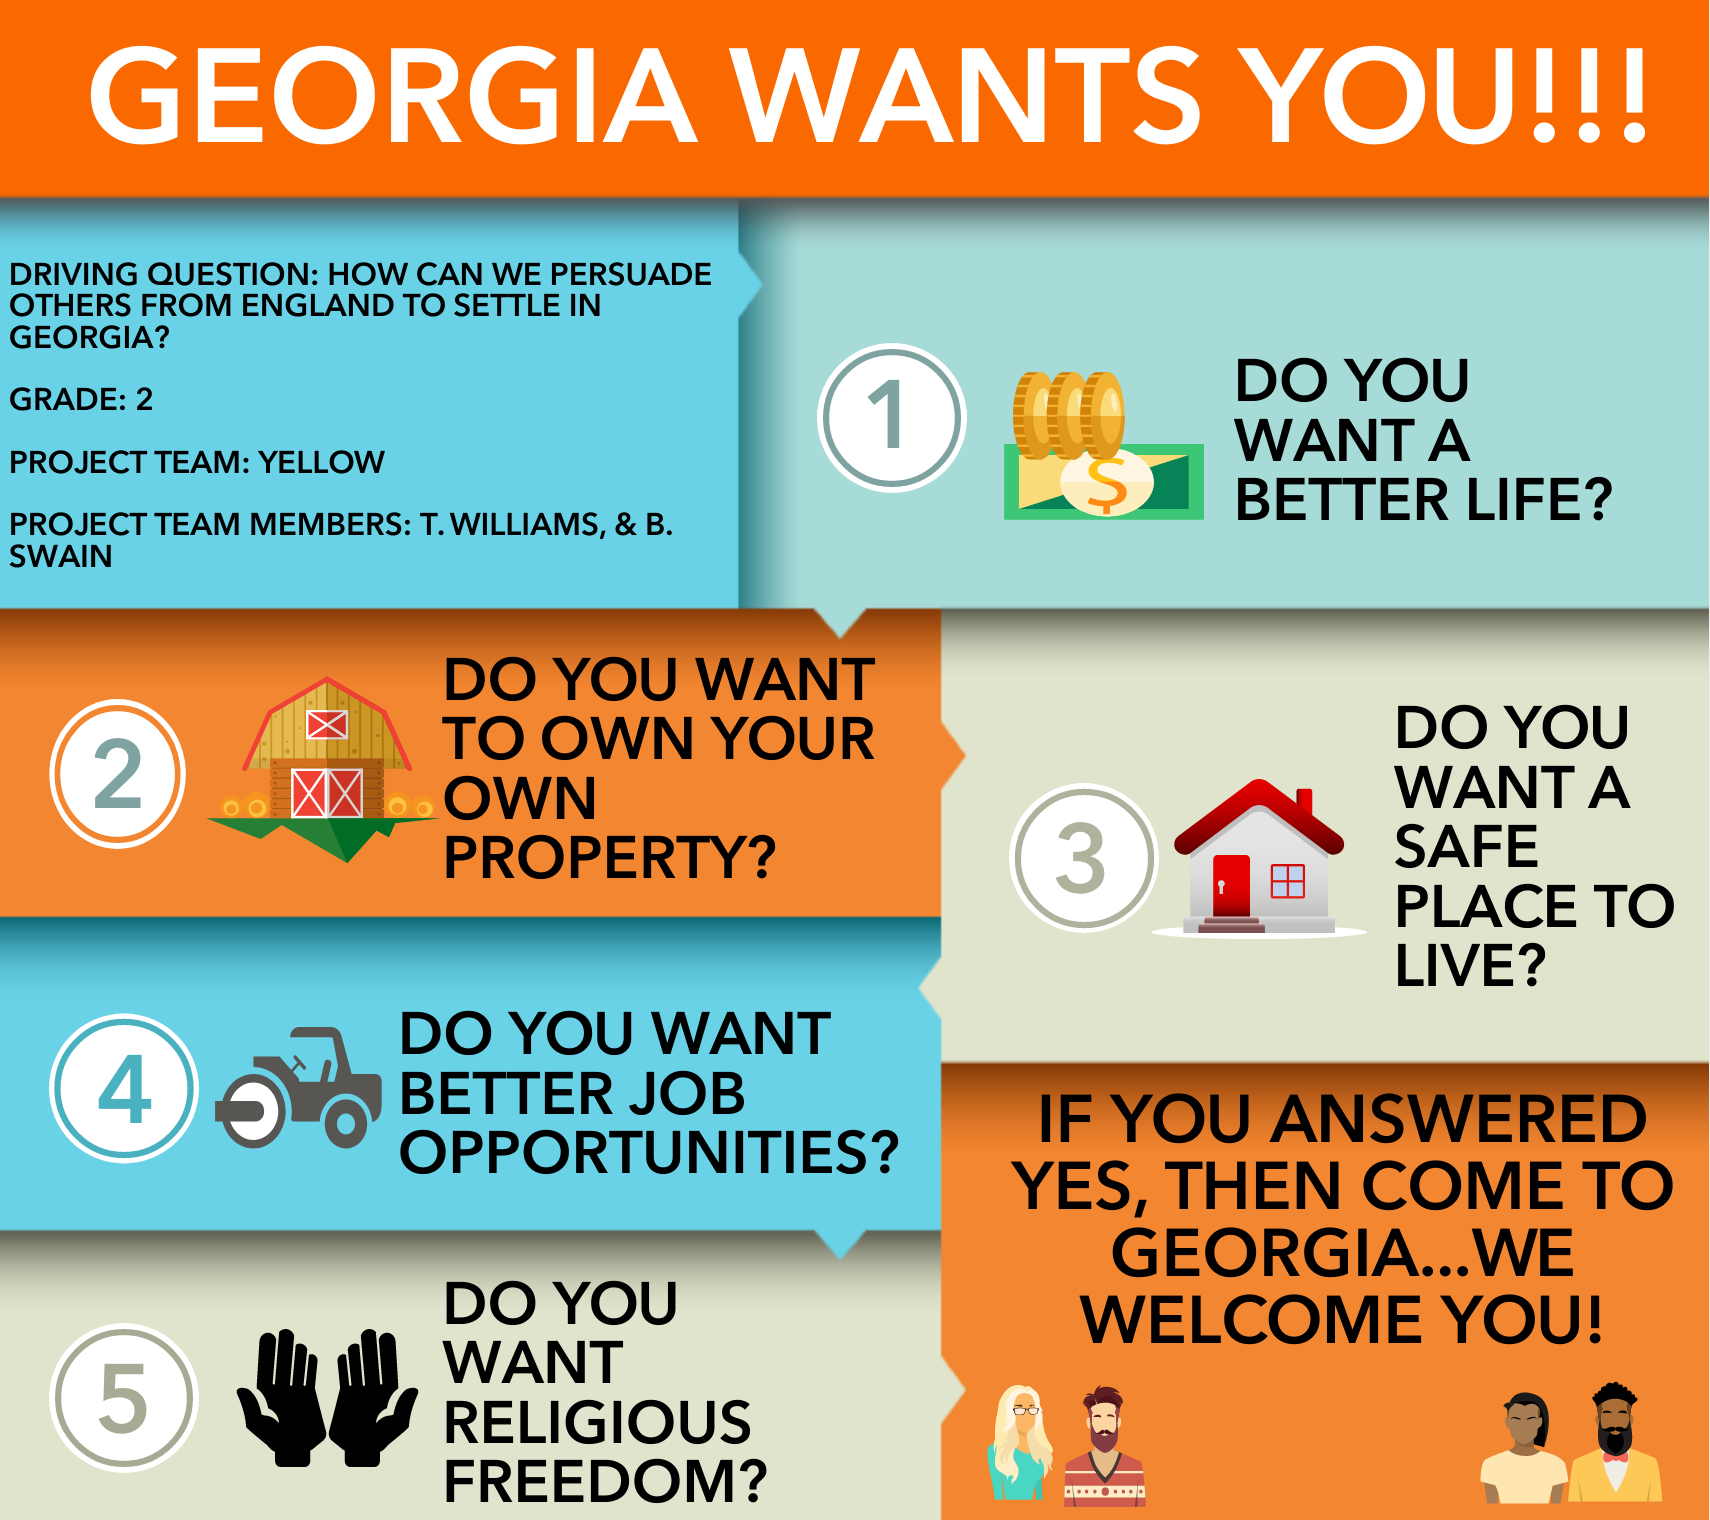
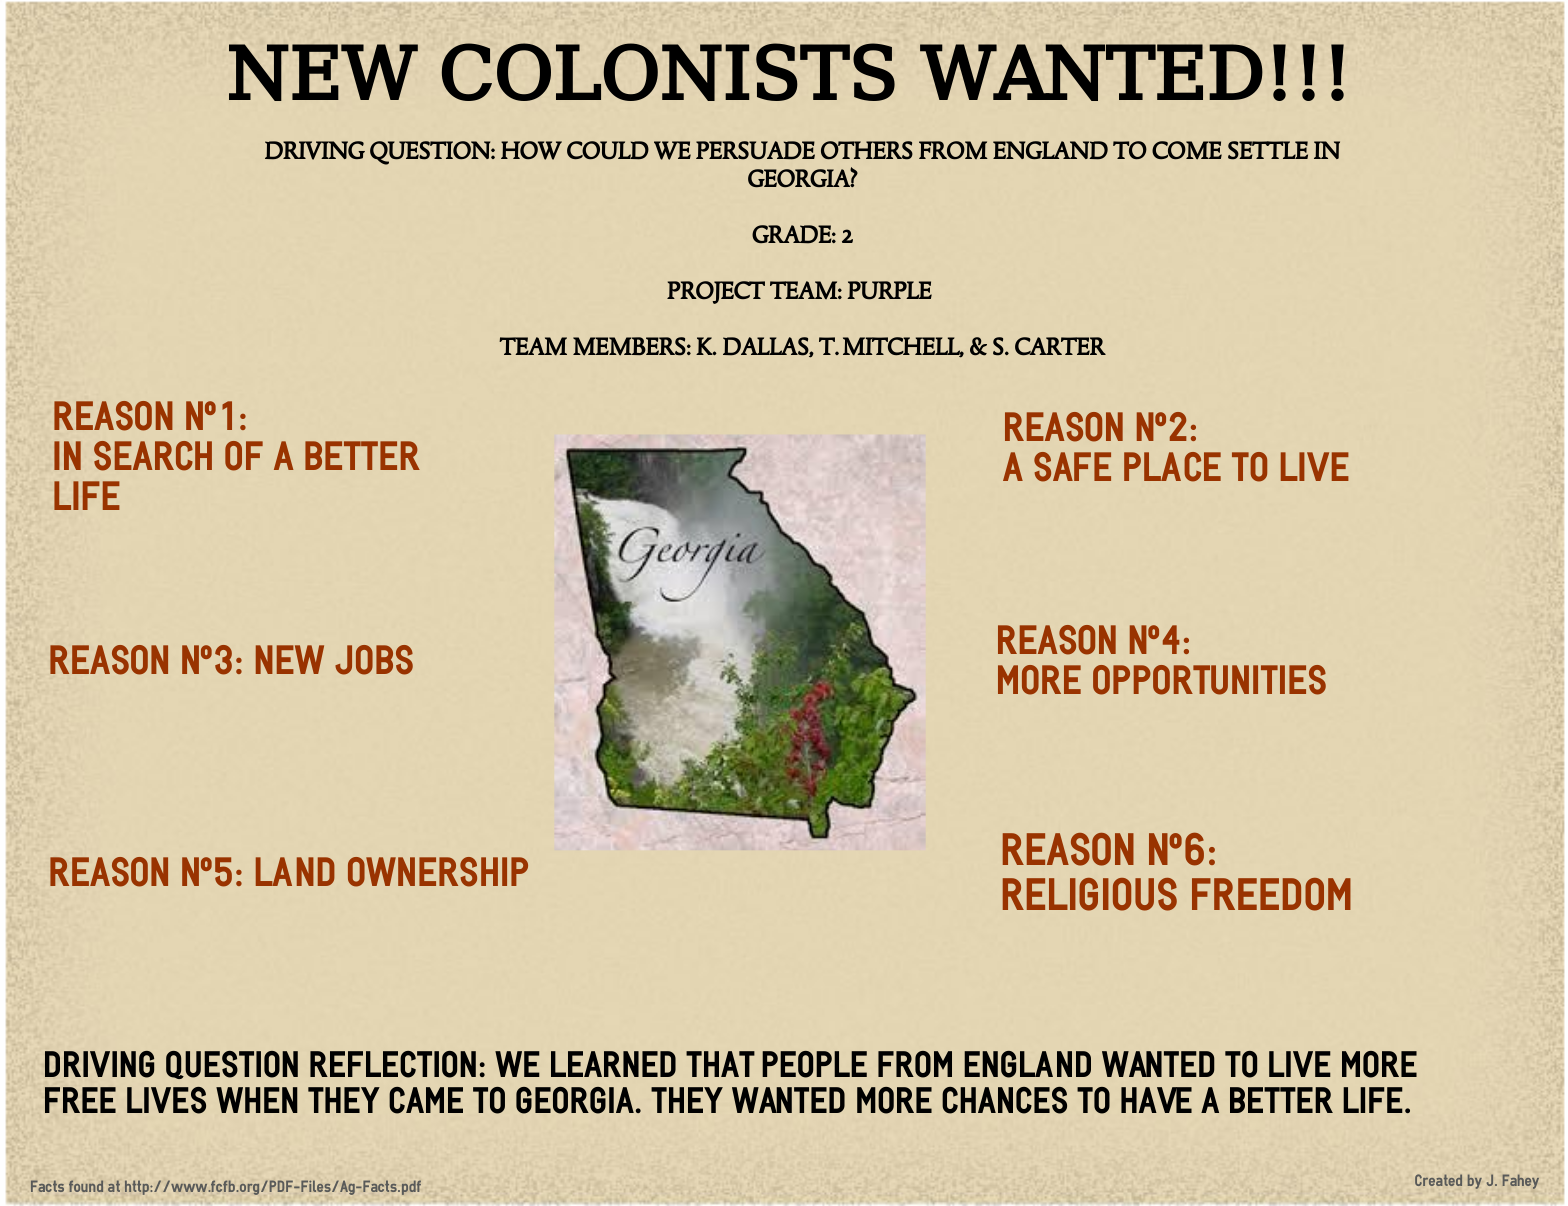

The infographics will be shared and presented with third graders as they learned why explorers wanted to find new lands. I wanted my students to make some connections between both time periods.
Prior to this activity, I did demo lessons to show the students the features that Easelly had to offer. From there, the students get to choose their colors, fonts, and icons with their teammates.
Thanks for walking us through. Tell us more about your hobbies and creative pursuits apart from teaching.
Outside of teaching, I love hanging out with family and friends, attending concerts, listening to live music, going to the movies and traveling. I also love learning from other educators and like minded people that add value to my network.
We’d like to thank Nefertiti for allowing us to share her Easelly user story and student infographic activity. Follow Nefertiti on Twitter or visit her website.
Meanwhile, if you have an Easelly story to share, we’re all eyes and ears. Comment below or send us an email at support@easel.ly. We look forward to hearing your story!
If you’re wondering how you can start using infographics in your classroom or media studies class, get our Infographic Activity Book for Students. It’s free.
Finally, try out Easelly for free today! You can also ask our infographic design team to make an infographic for your class if you’re pressed for time.
*Editor’s note: Responses has been lightly edited and condensed for clarity.