Our Easelly User Story series features Easelly users whose infographic creation or advocacy caught our eye on social media.
For November, we’re putting the spotlight on Jessica Fitzpatrick, also fondly known as Mrs. Fitz the librarian by her students.
Here at Easelly, we’re huge fans of librarians. Like English author Neil Gaiman said — librarians are the coolest people out there doing the hardest job out there on the frontlines.
Let’s get to know the youngest school librarian in Texas (to date!) and her thought process when creating eye-catching infographics for her library.
Tell us a bit about yourself and background, Jessica.
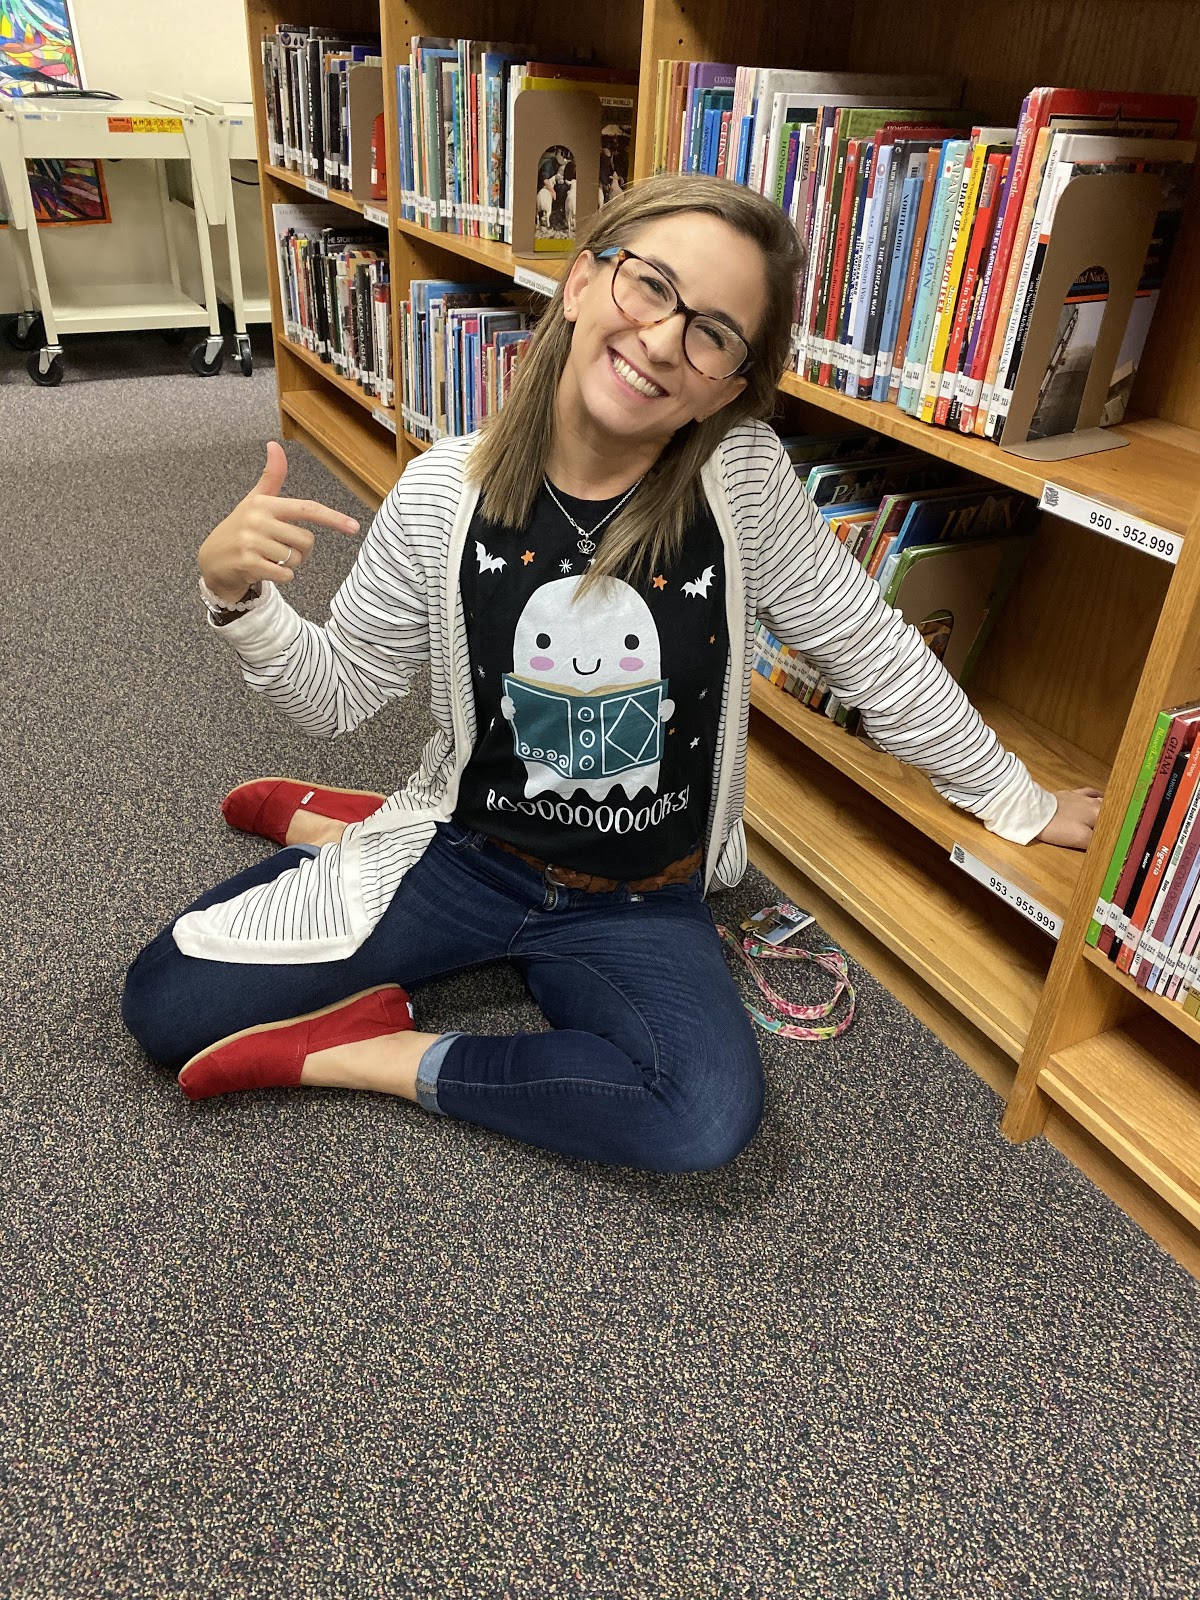
I was born and raised in Houston and my biggest passions in life are: baseball, my family, books and sharing the love of reading with children.
I graduated with my Bachelors in Education from The University of Houston and I have been in education for seven years now.
I spent my first five years in education as an elementary reading teacher and after I completed my Masters degree in Library Science from The University of North Texas, I was hired as a middle school librarian at the best school in the world. I am very lucky to have my dream job!
What’s your day like as a librarian?
My typical day as a librarian is hectic, but fun and fulfilling hectic that I love. I service all students at my campus (1300 students) and they love the library.
Our campus opens and we fill our library up with students! Before school is one of our most popular times of the day.
Students come into the library to read, check out books, create in our STEAM Makerspace, work on the computers and hang out with friends.
During the day, I am teaching classes, collaborating with teachers on how to bring more reading, research and technology into their lessons and helping students with 3D printing, podcasts and finding the perfect book.
Tell us more about the rewards and challenges you have right now as a librarian.
The most rewarding part of my job is seeing how much the students love the library. Students literally run to get to the library!
Since I have arrived at my campus, our circulation (how many books checked out) has grown to the extreme. Just this year our circulation from August 1st to September 31st was more than the circulation for the entire 2017-2018 school year!
Students love coming into the library to be with their friends, to use the STEAM Makerspace, create with podcasting or the 3D printer and when they are here, they see amazing books that I am book talking and they check it out.
They might come to the library for one thing (non book related) and then they come and see our books and check one out.
Getting them into the library and making the library fun and inviting is incredibly vital in getting them to read and sharing the love of reading is by far my favorite part of my job.
The biggest challenge that I have had in my job was that last year, I was new. The librarian before more had been there for several years and when I was hired, some of the teachers were hesitant about me.
Not only was it my first year, but I was also the youngest school librarian in the State of Texas so some of the teachers underestimated me.
Throughout the school year I kept showing them new data literacy skills, researching skills, and technology skills. Over time, they have come to love me! This school year, more teachers have come to me to collaborate or ask for help than ever before so I call that a success!
How’d you discover Easelly?
I discovered Easelly through one of my grad school class at The University of North Texas. It might surprise many people but to become a librarian, you take a lot of technology integration classes (because libraries are more than books!).
For this particular class, we were given a giant list of websites and apps that could potentially be used in the library and we were to pick five of them, evaluate them, and create a lesson plan for using them.
What’s your favourite Easelly feature?
I picked Easelly not knowing anything about the website and I fell in love! I use it countless times in my day to day life as a librarian.
My favorite Easelly feature is how the presentations are fun and exciting. I could be making a presentation over library data, a presentation that before discovering Easelly would have been done with powerpoint which is not as fun and exciting.
Easelly not only brings to life the data by making it pop rather than just blend in, but the designs are inviting that even young students eyes would be drawn towards it.
I also like how the charts bring data to life plus the ability to draw arrows to make the visual tool more inviting to the eyes. My husband is a data analyst and he loves to geek out over how user friendly Easelly is and how it brings numbers to life.
Walk us through your thought process when making infographics for your library.
At first, I would make my infographics on Easelly just to share the library statistics for the month with my admin, district librarian, and teachers.
As I have moved on and have become more adventurous as a librarian, I have started to create infographics from scratch on Easelly for the students over what kinds of books (genres) are being checked out and then what books within that genre are the most popular.
I post these infographics for the library to share books that might have been overlooked by students.
Students often 1) compliment how pretty and interesting the Easelly infographic looks and 2) want to find one of the books that are on the infographic.
When creating an infographic on Easelly, my first thought is “who is this infographic for?”. If the infographic is for my admin, district librarian or teachers I would pick a more mature, work centered background for my infographic.
If the infographic is for my students, I look through the backgrounds provided on Easelly for a background that matched the theme for the infographic I am creating.
My ultimate goal in designing the infographic is to create something that the students or staff would want to look at.
If the infographic was boring, they would just delete my email or walk right past the poster. When the infographic is eye catching, then the reader will be drawn in and more likely to read and digest the information from the infographic.
Thanks for sharing your thought process. Moving forward, tell us more about your hobbies and creative pursuits?
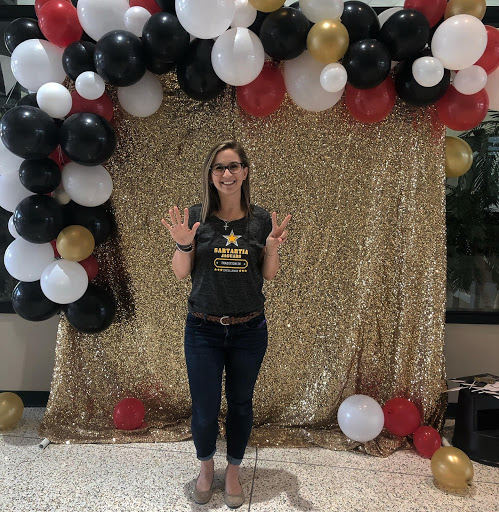
My other hobbies and creative pursuits apart from teaching are watching the Astros and running.My husband and I are the biggest Astros fans (in the world!) so during baseball season our lives live and breath Astros. We were married at an Astros game in 2013 (when their record was 51-111) and since they have been amazing so we like to joke that we are the reason why the Astros are great now.
I also am an avid marathon runner! I also have two young daughters ages 2 and 5 that I have the best time raising.
Editor’s note: The response has been lightly edited and condensed for clarity.
Follow Jessica on her Twitter and Instagram to learn more about her and her advocacy in making libraries fun and inviting for learners of all ages. We’d like to thank Jessica for allowing us to share her Easelly story.
Finally, if you have an Easelly story to share, we’re all eyes and ears. Comment below or send us an email at support@easel.ly. We look forward to hearing your story!
Want to make infographics for your library and school too? Give our simple infographic maker tool a spin.