
*Editor’s Note: This post was originally published on April 21, 2017 and updated on October 16, 2019 for accuracy and comprehensiveness.
As a startup or a small business owner, you are very familiar with the struggle to keep up a constant flow of content and outreach without losing a massive flow of cash.
You have to figure out advertising, web copy, blog posts, white papers or media kits, email campaigns – and don’t forget about social media! The worst part is that all of these different areas require different kinds of content which costs you time, money, and energy.
What if you can use ONE tool that helps you not only cut costs and save time, but can also give you content that you can use multiple times on various platforms?
Enter infographics for content marketing.
Why use infographics for your content marketing campaigns
In case you didn’t know, an infographic is a visual (chart, graph, timeline, symbols, etc.) that essentially recaps or represents information.
What an infographic is not is a place to just re-type boring text that can be saved as an image (people do still try that, though!).
Infographics have become massively popular since 2010, with growth over 800 percent on Google search in recent years.
Contrary to popular belief, it doesn’t take a degree in graphic design to create or a pirate’s chest worth of gold to pay for an infographic.
You can create infographics on your own time and dime that look great and intrigue your audience. There are even infographic generators that give you tons of templates, fonts, objects, shapes, and images to work with for free.
Still skeptical?
What if you knew that infographics help generate more organic search traffic and increase your image SEO ranking?
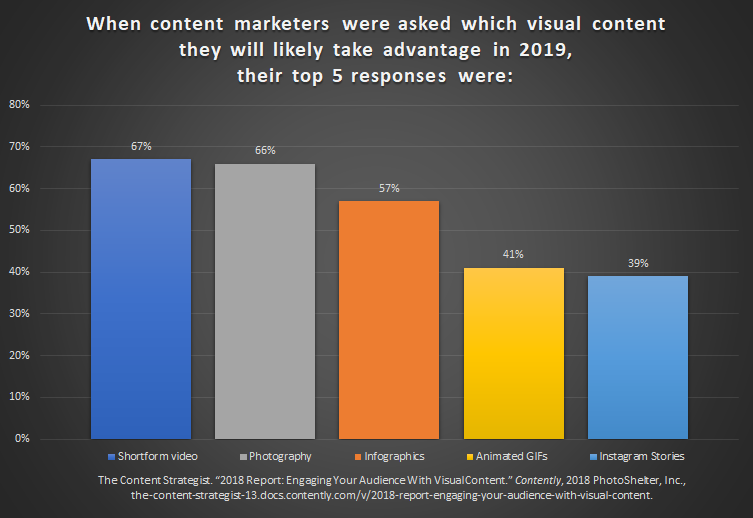
What if you could grow your website traffic by at least 12 percent? And the real clincher — 75 percent of marketers have better content ROI when they use visuals with their content.
Now that we’ve got your attention, let’s explore how you can use infographics to help grow your startup or small business without breaking the bank.
Infographics customized to your business or brand goals
While most people write infographics off as a tool only people with “hard data” can use, the truth is that infographics can be used in virtually every area of our business. Infographics can be used to:
- Summarize a blog post
- Display budget or finance information
- Share “how-to” information with your team or audience
- Communicate product value and provide information about your service
- Encourage engagement through social media
- Spruce up web copy, eBooks, white papers, and more
- Promote and advertise your brand
….just to list a few. To some people, infographics sound like “just one more thing” they have to incorporate into their content marketing efforts.
But what if you could use this one inexpensive and fairly simple tool to cut your content marketing costs, efforts, and time in half?
One-and-done content creation
Those “in the know” understand the versatility behind one single infographic. You’re probably thinking, “There’s no way I can use one infographic and be done,” and you’d be correct.
But you’re not going to just create one infographic and call it good; you will create multiple infographics for multiple occasions.
The “one-and-done” side of infographics means that you can actually create one infographic and use it across virtually every single platform in multiple formats.
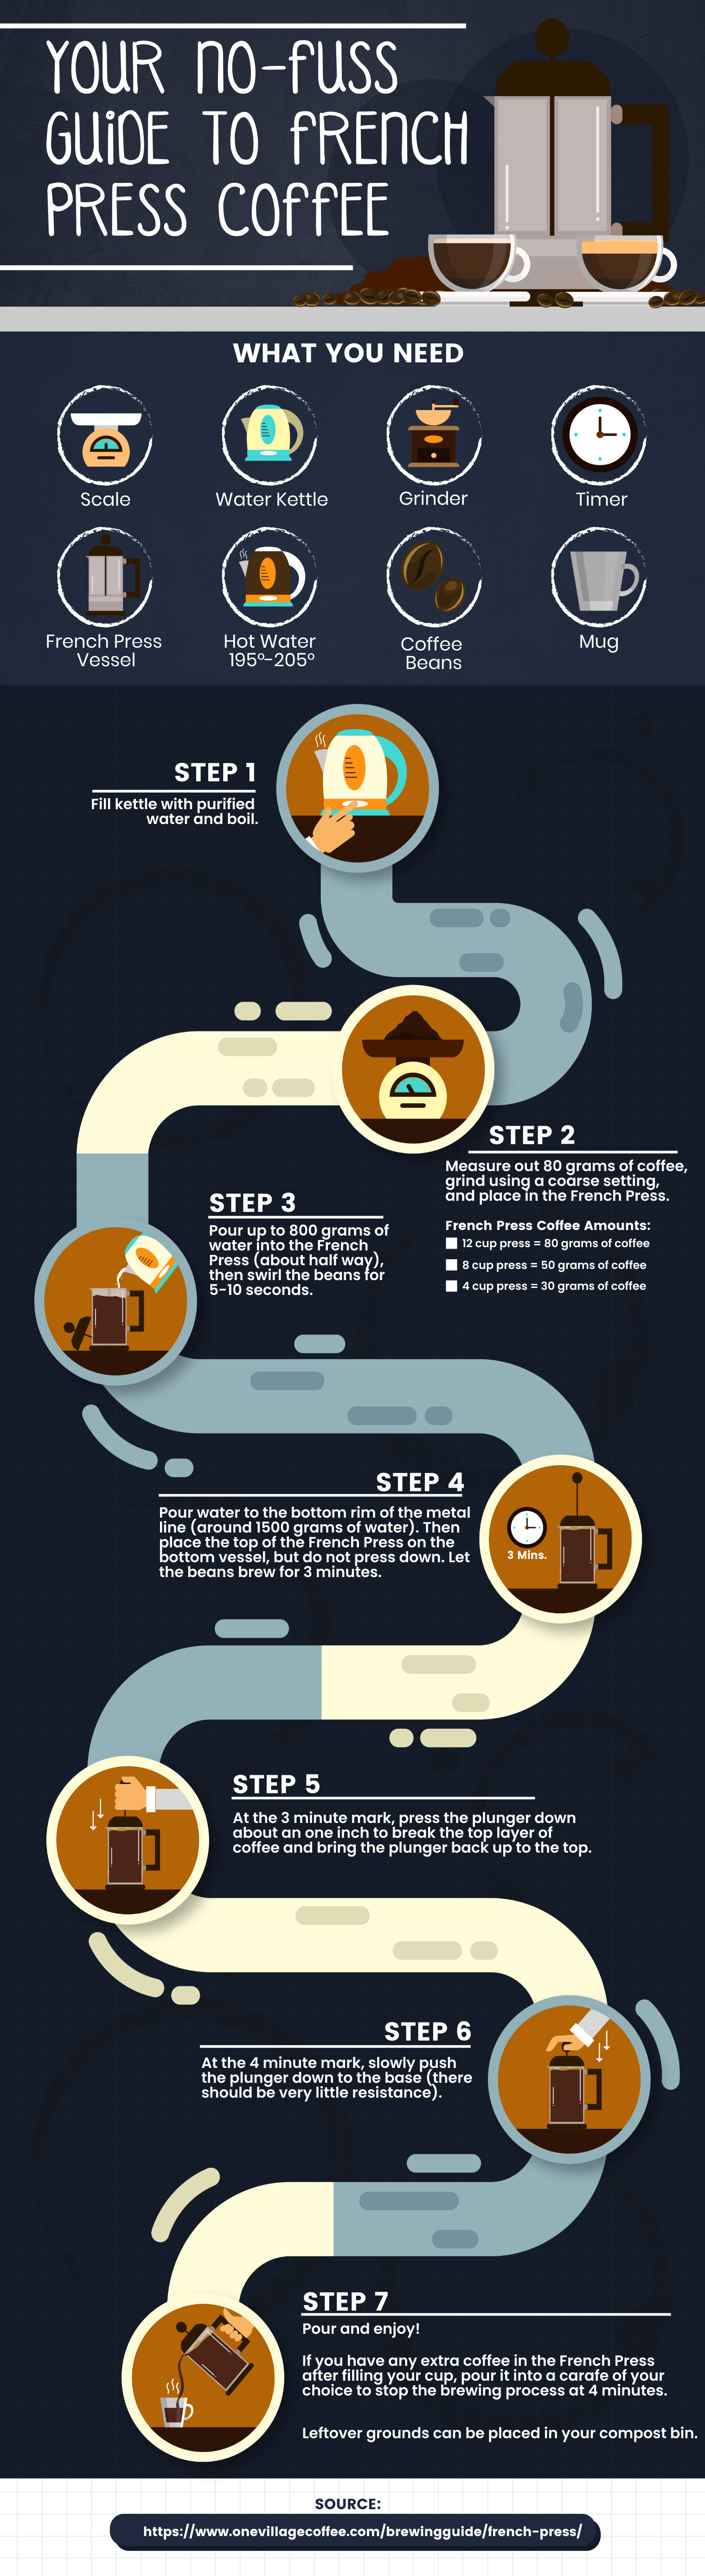
What does this look like? Take for instance this infographic:
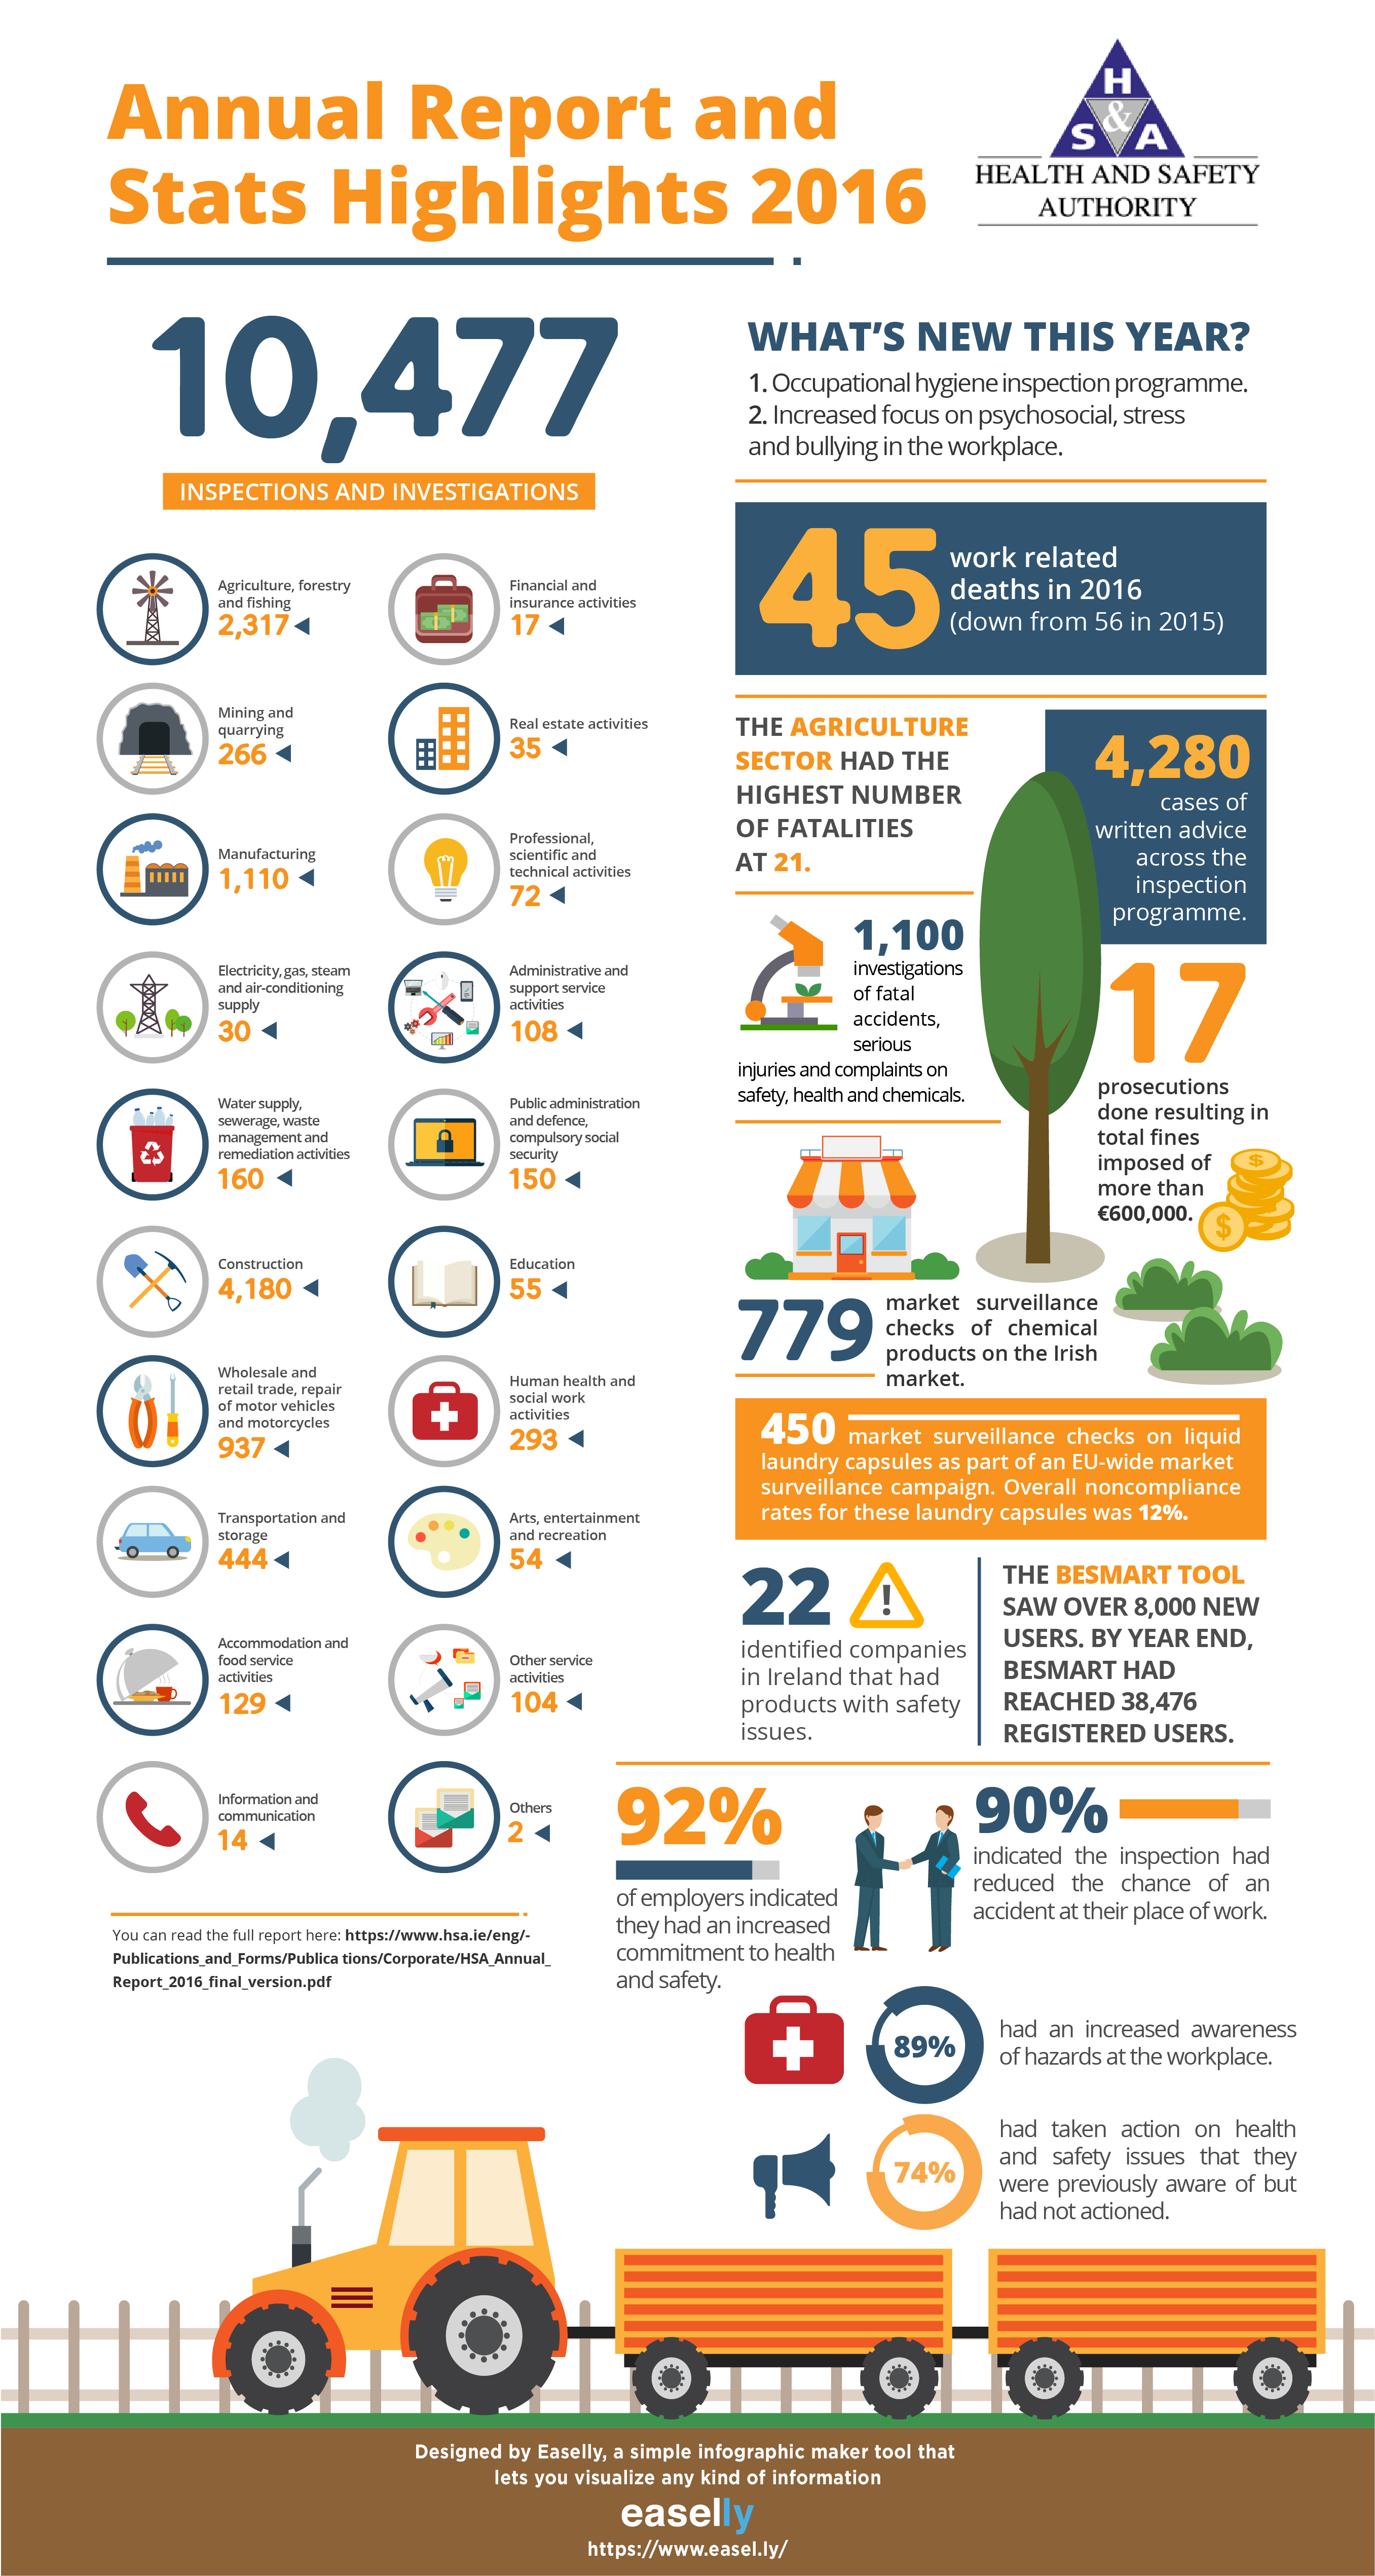
Just as an example, say you needed to draft up financial reports for an investor, for your board, or to help employees see where they need to improve. You may be thinking, “Why would I waste an afternoon creating an intricate infographic for just one meeting?” This is where you have to change your thinking.
Creating this infographic means that you can use it in multiple places, from an investor introduction package, your quarterly meetings, even in white papers or media kits. You can also save the template for next quarter/month/year – boom!
This idea can be used for any type of infographic you can create, whether it’s for a blog post, advertisement, social media thumbnail – whatever. You can create infographics with the intention of using them in multiple places.
Think about creating an infographic communicating the benefits of your product.
The infographic on matcha health benefits below is a stellar example.
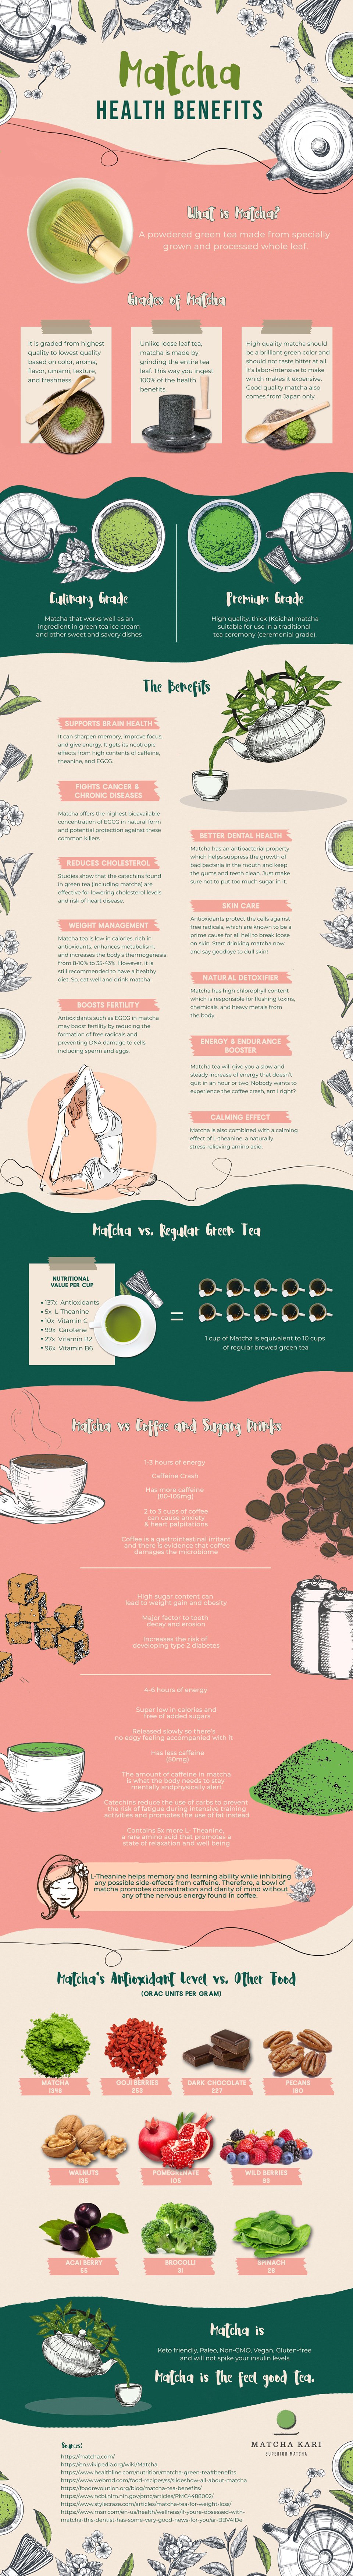
Next, think about all the places you could use this one infographic. How about for your blog to drive lead generation efforts? Or for your email campaigns? You can also use it in your web copy!
Finally, you could shorten a blog post with an infographic.
Use portions of this infographic as a blog header image, as the thumbnail for Pinterest, Instagram, Facebook, and Twitter. Add it into your newest e-book or email campaign, whatever floats your boat.
See? One-and-done!
High-quality, affordable content made easy with infographics
Once you are familiar with making an infographic, the process of creating them for your different campaigns, blog posts, or documents becomes even easier.
Not only can you save yourself a treasure chest full of gold when you create them yourself, but you can also save yourself even more time.
Infographics make it easy to get your message across without using time-consuming, ineffective content. They also make your life a whole lot easier.
Have no clue where to start? Use this step-by-step guide to making infographics from scratch.
If you need help creating original infographics, collaborate with our infographic designers. You can also start making your own infographic using pre-designed templates. And if you’re feeling more adventurous today, try animated infographics.