
Getting people to pay attention to your offers or message is one of the biggest challenges in today’s businesses, whether large or small.
While learning the ins and outs of artful storytelling can be a leverage, telling stories and creating content isn’t enough. Your medium — how you tell your story — can also make or break your internal business communications and marketing campaigns.
In this short guide, you’ll learn about new ways of communicating in business through infographics and data visualization.
How to use infographics in your business
Scroll down for the tips accompanied by stellar examples of transforming boring, text-based content into an infographic that will turn heads, boost engagement, and possibly generate qualified leads for your business!
1. Explain a complex process in a simple, easy-to-understand visual aid.
For a start, use your infographic to explain a process and to educate customers, instead of selling your products and services upfront.
For example, you could be a design consultancy agency who helps brands and businesses develop products and services that best serve their customers’ needs. A design sprint may be one of your agency’s processes when working with clients.
So, why not make an infographic about design sprints to communicate its value to clients and prospects?
2. Highlight facts and break down information into essential data points by adding a creative twist to it.
Focus attention where you want it by making facts and figures more visually appealing.
Here’s a great example highlighting where the UK government spent their money in 2016.
3. Onboard new customers and clients with an infographic that educates and entertains at the same time.
A successful customer or client onboarding process does more than accomplish your goal of getting them to use your product or avail of your service. More importantly, it should set them up for success by helping them achieve their desired outcomes and having their needs taken care of.
In this example, a fitness gym creates an infographic for the new enrollees. The infographic can either be printed for offline use or sent as an attachment in welcome emails! You can check the text-based checklist here.
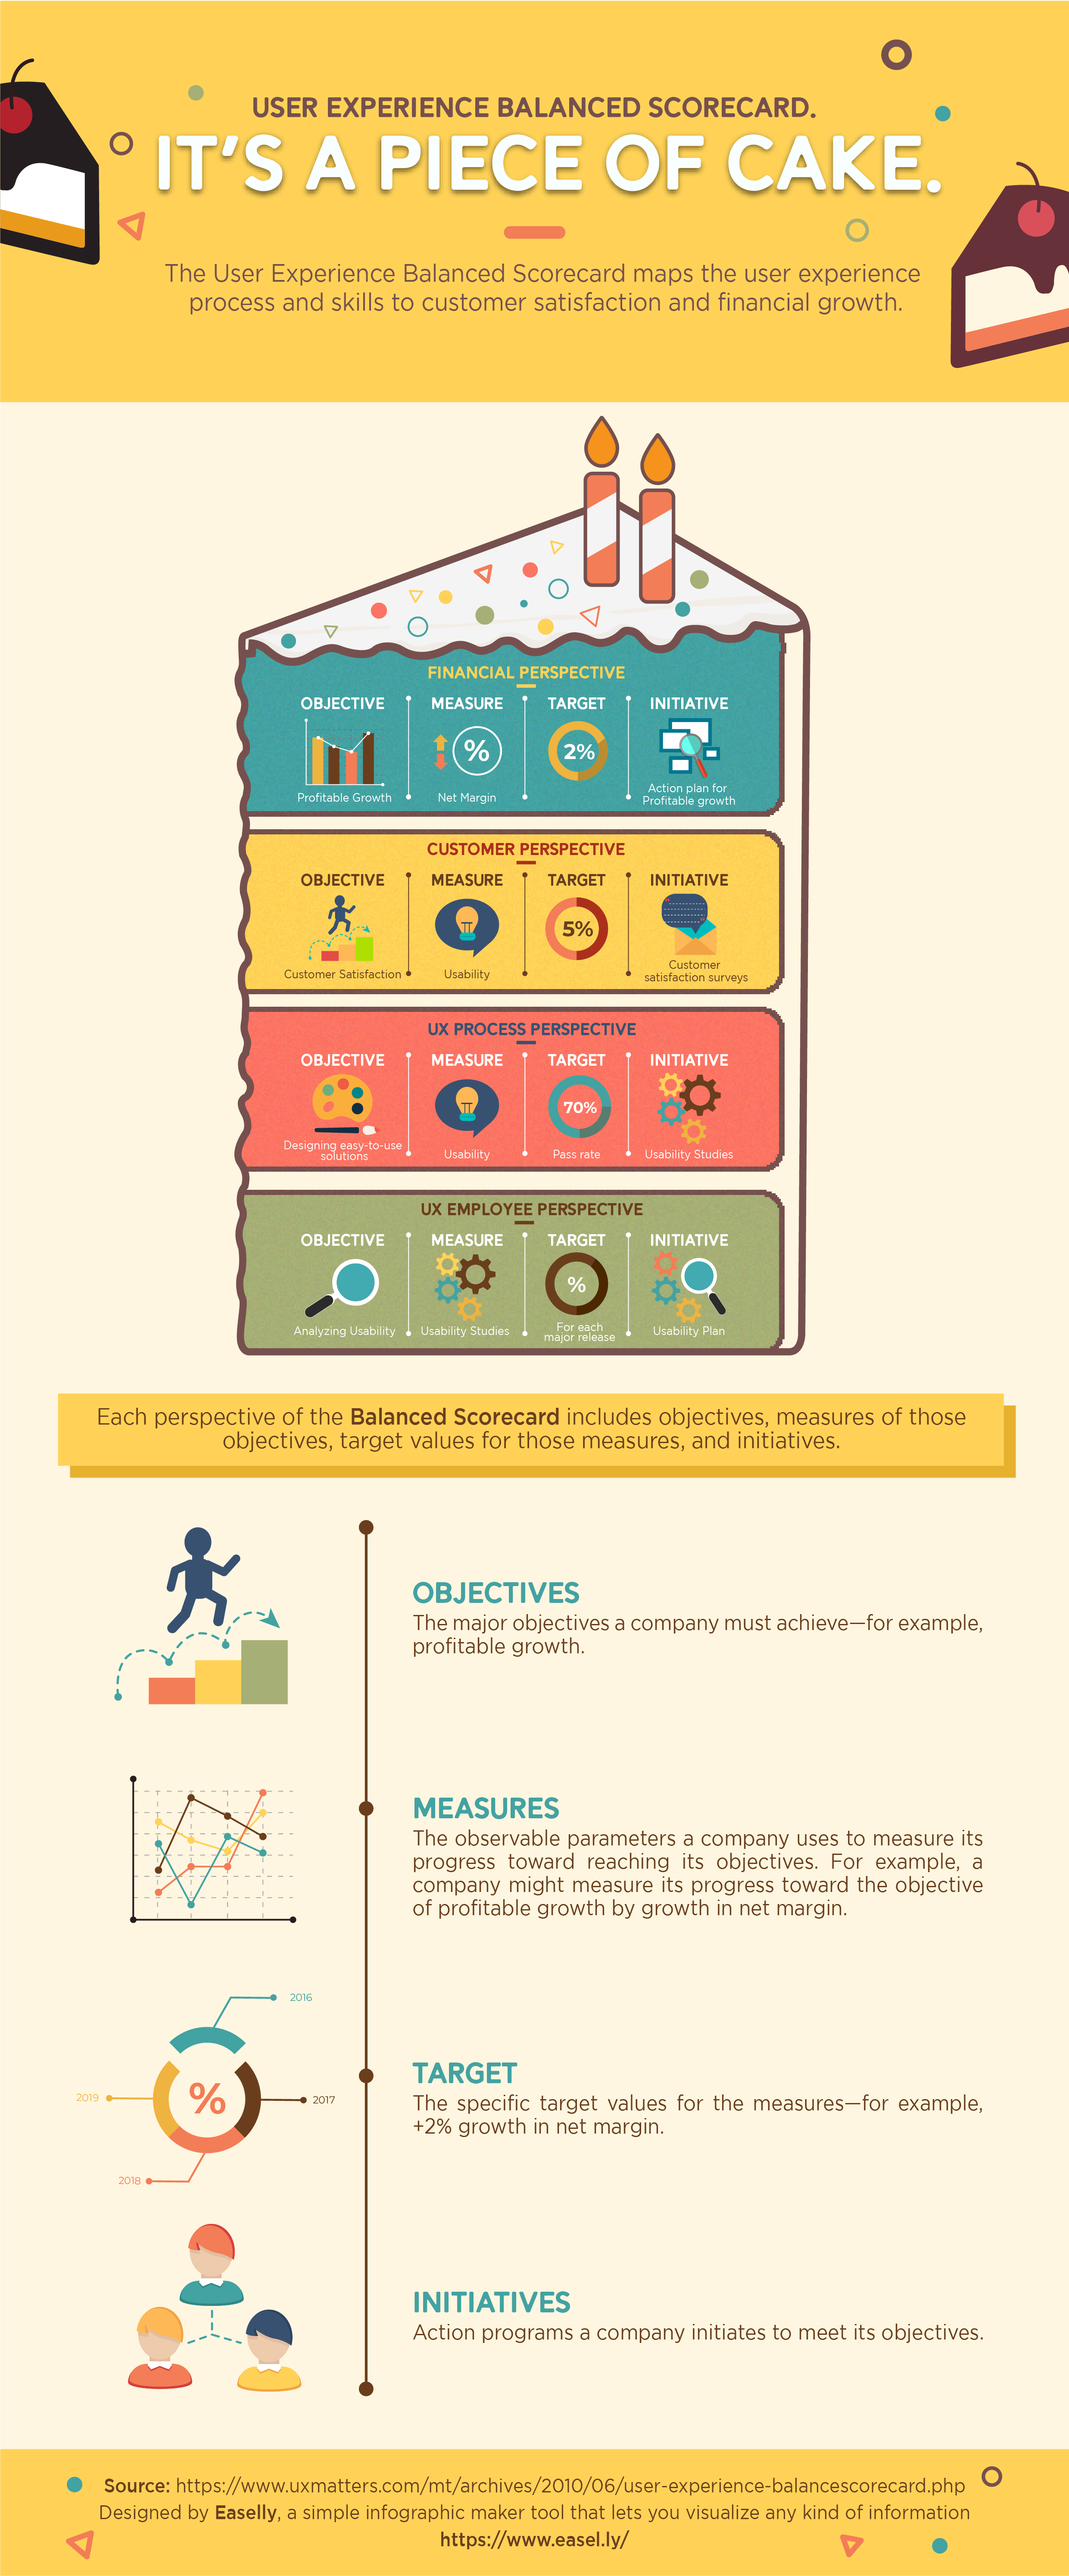
4. Implement scorecards by presenting them in a way that engages and persuades readers at the same time.
A lot of organizations and businesses fail at implementing scorecards because no one’s paying attention to it. For most people, it’s boring and doesn’t make sense.
In the example below, you’ll notice how a dull-looking scorecard turns into an infographic that will likely capture the reader’s attention.
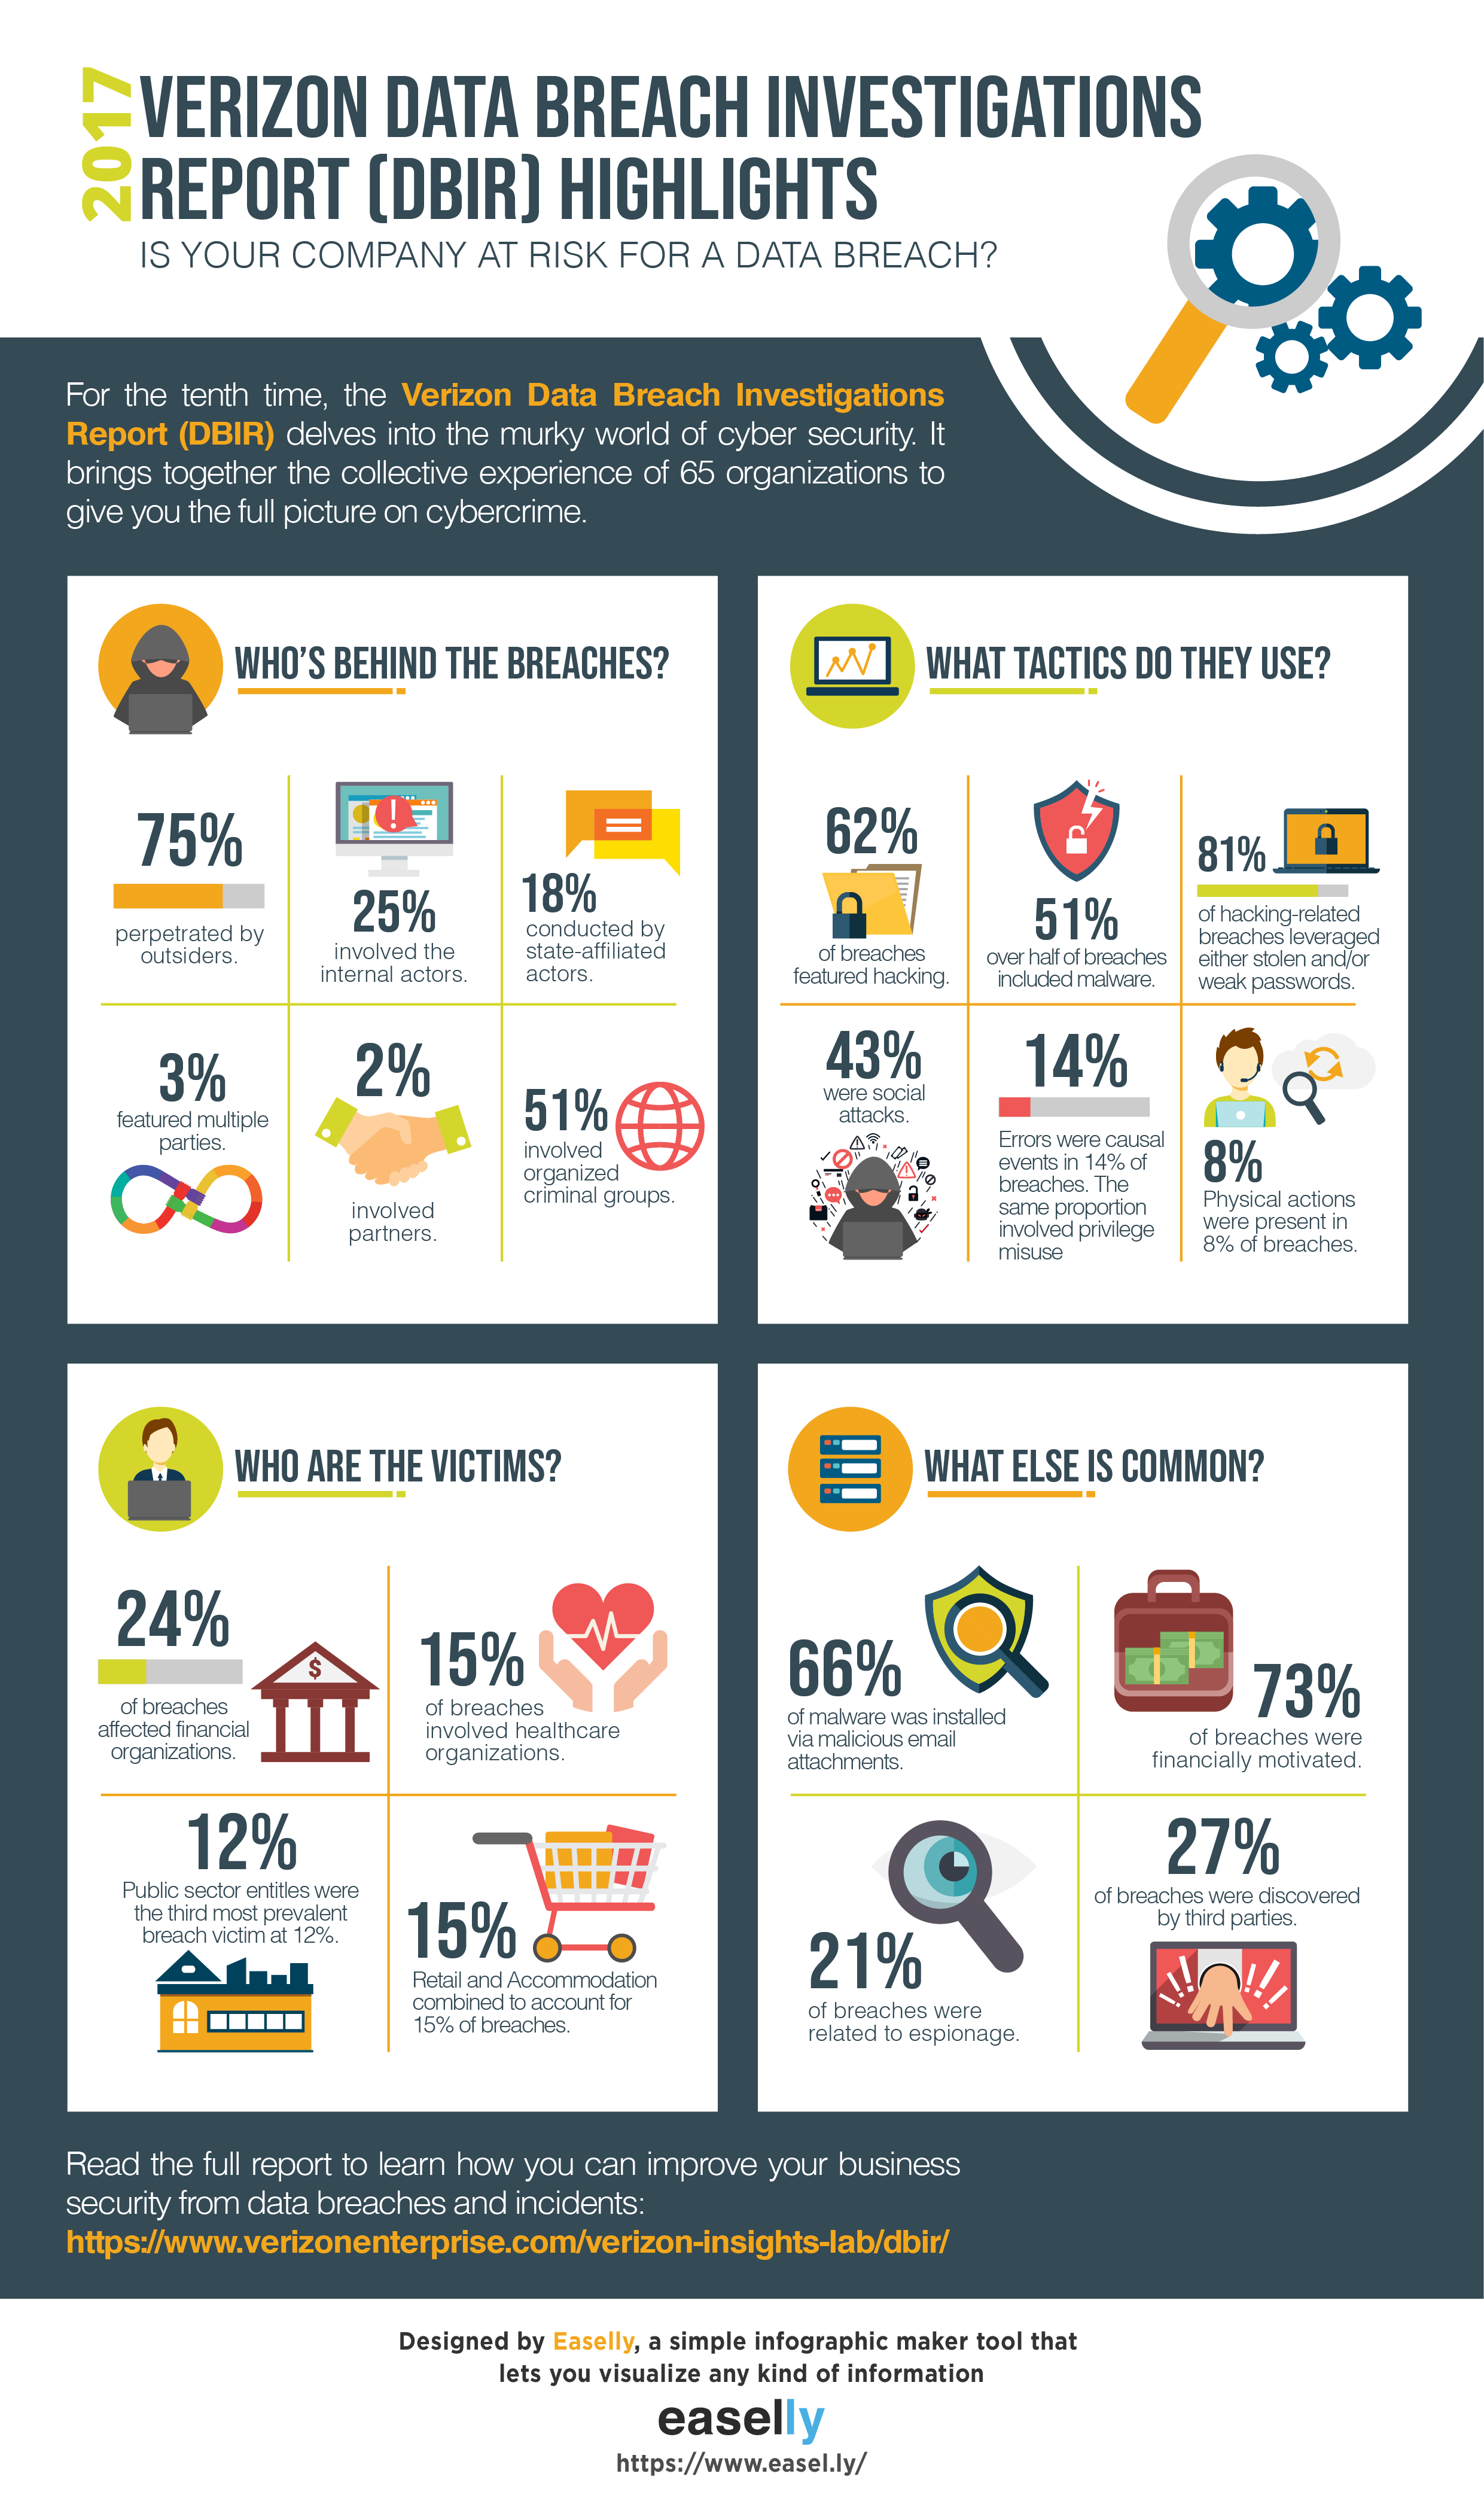
5. Craft a report that people will read rather than skim through.
We’ve all been there. You’re handed a report and think, “I don’t have time for this today. Maybe tomorrow.”
If a report overwhelms your readers at first glance, you risk losing out their attention and potential conversion. For this reason, it pays to be extra creative by visualizing your report so people will read and share it. Take a look at the example below.
Your next step: Shaping your visual storytelling strategy
Are you starting to notice bits of information and data in your business that you can create visual content around?
If you or your team are about to get started with infographic creation, you can:
1. hire an infographic designer to do the heavy lifting for you
2. you can go the DIY route through our simple infographic maker
Whichever approach you take, the last (but not the least!) vital point to remember is that your infographic should be relevant and useful to your audience at the same time.
Finally, if you’re wondering if you have the flair for infographic design despite zero design experience, this Guide to Making Infographics from Scratch is for you!
Why not learn something new today?