
Though nearly every financial service firms are starting to get into the consumer education game, only a few produce high-quality visual content like infographics.
Whether you’re marketing for one of the world’s largest financial firms or a small business loan startup, you’re well aware that consumers are looking for value.
Individual investors are seeking sound investment advice. Entrepreneurs want to build resilient businesses. A new father is curious about insurance options that are best suited for his new family.
Promote financial literacy with infographics
The abundance of information in the digital age means financial firms should focus on offering creative, valuable financial content instead of being overly promotional.
Providing value through financial literacy and building relationships with customers should be top priorities for these organizations.
Financial infographics are the perfect communication medium for an industry flooded with overwhelming information and intimidating figures.
Take inspiration from the financial infographic templates and examples below.
With these resources, you’re one step closer to building trust and educating clients on wealth management, savings, and investing!
Infographics about living debt-free
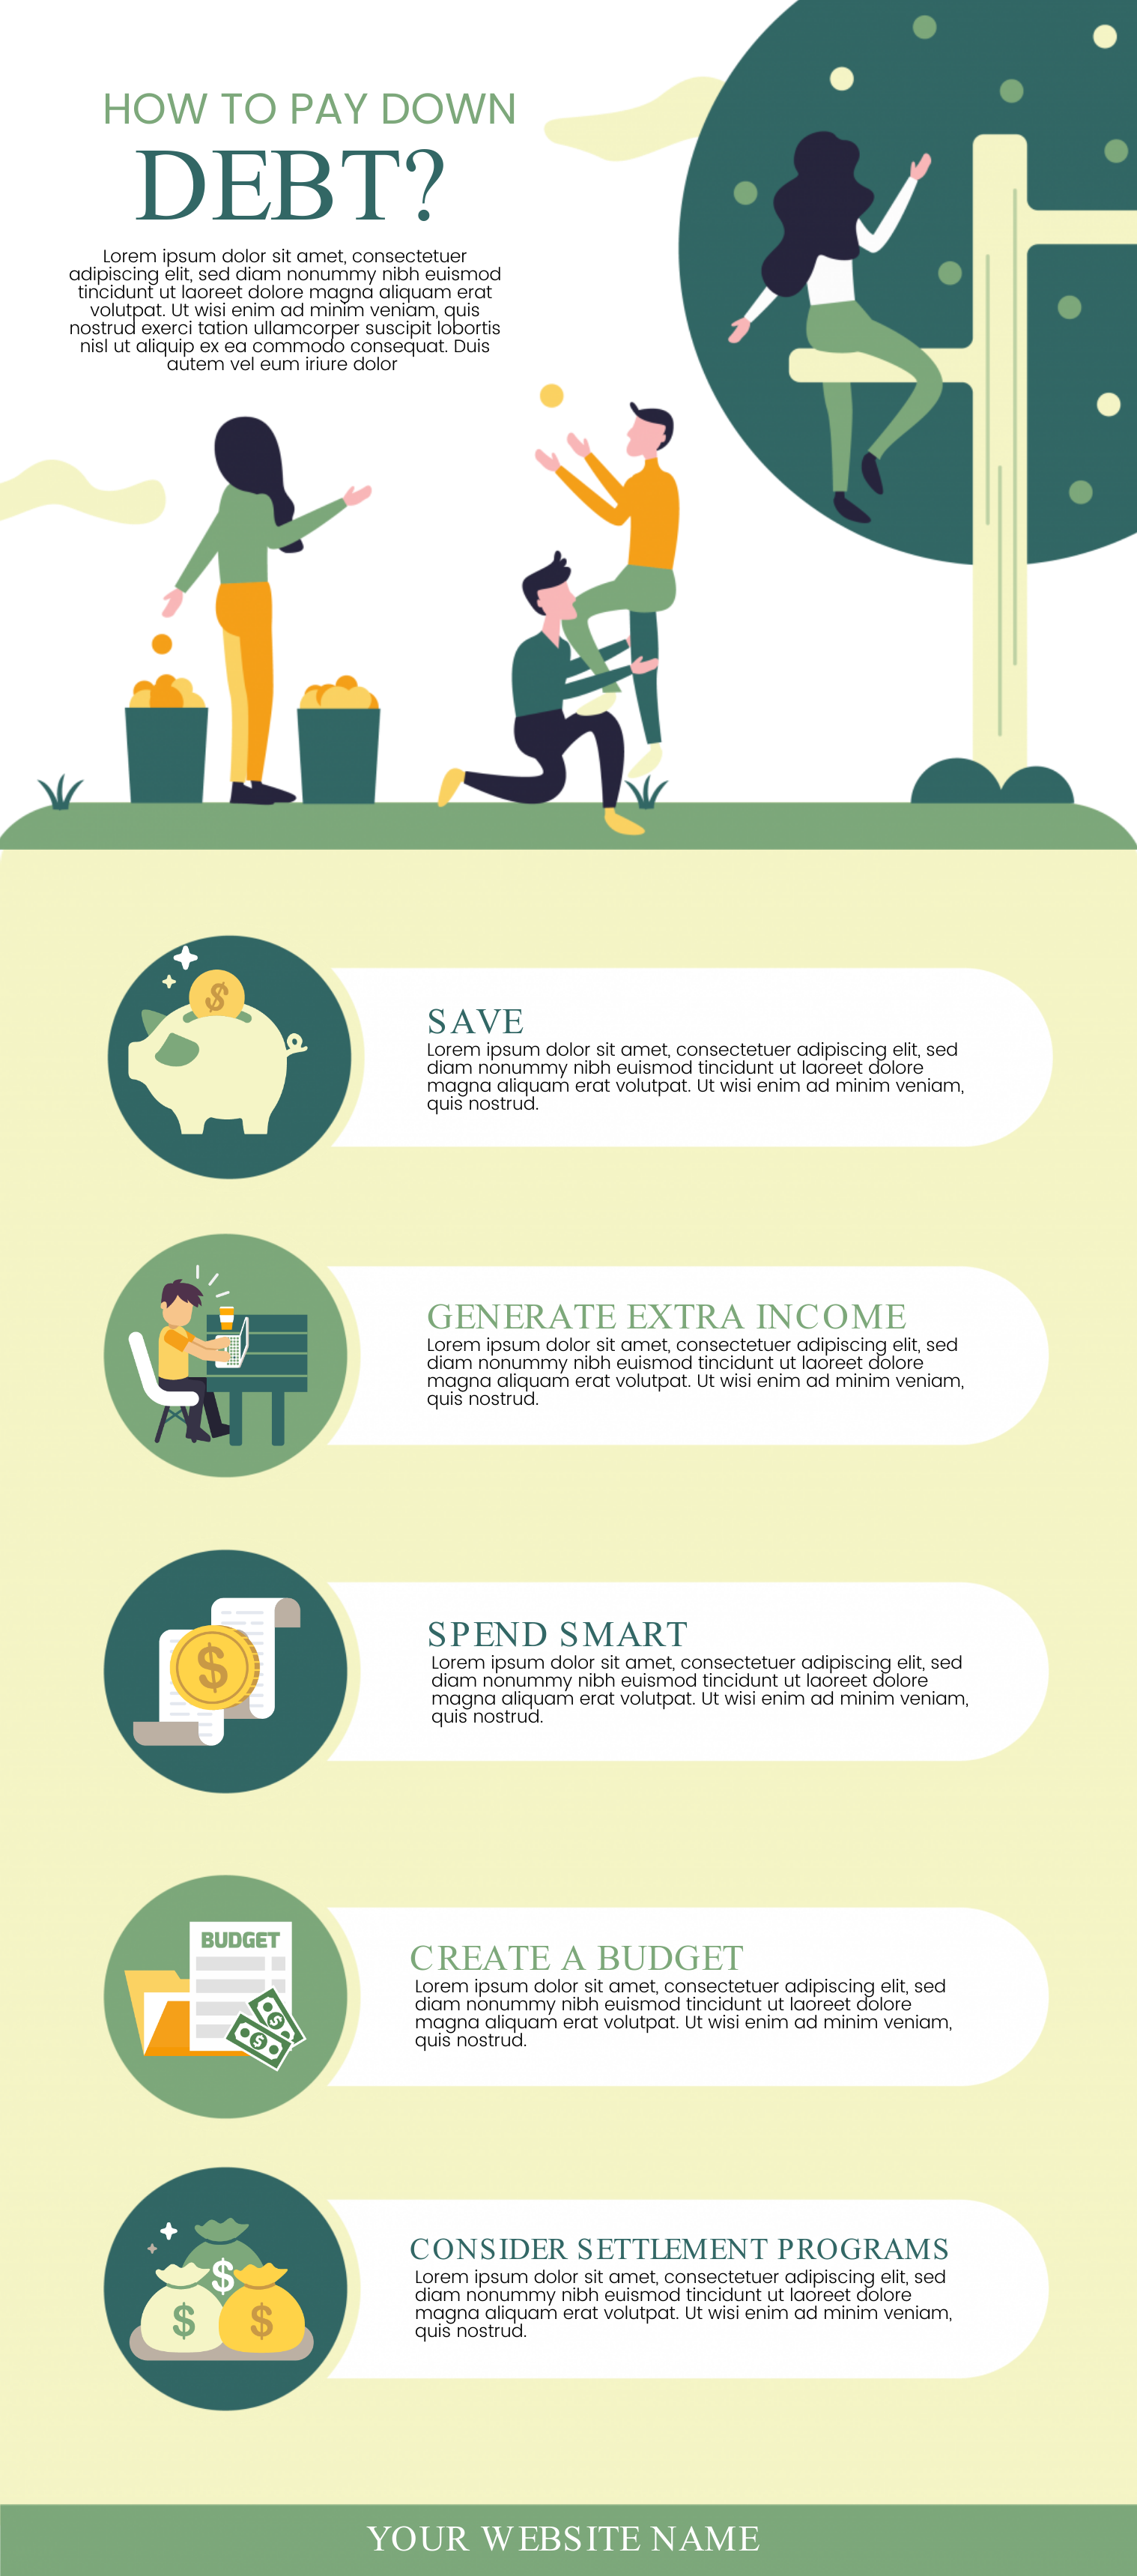
The first step to achieving financial freedom is to pay down debts.
The infographic template below lists down the concrete steps you can take to help you live a debt-free life.
Customize the template with your own rules to paying down debts ( Dave Ramsey’s snowball method is a useful reference) and bookmark/print the infographic as motivation to eliminate debts as soon as possible.
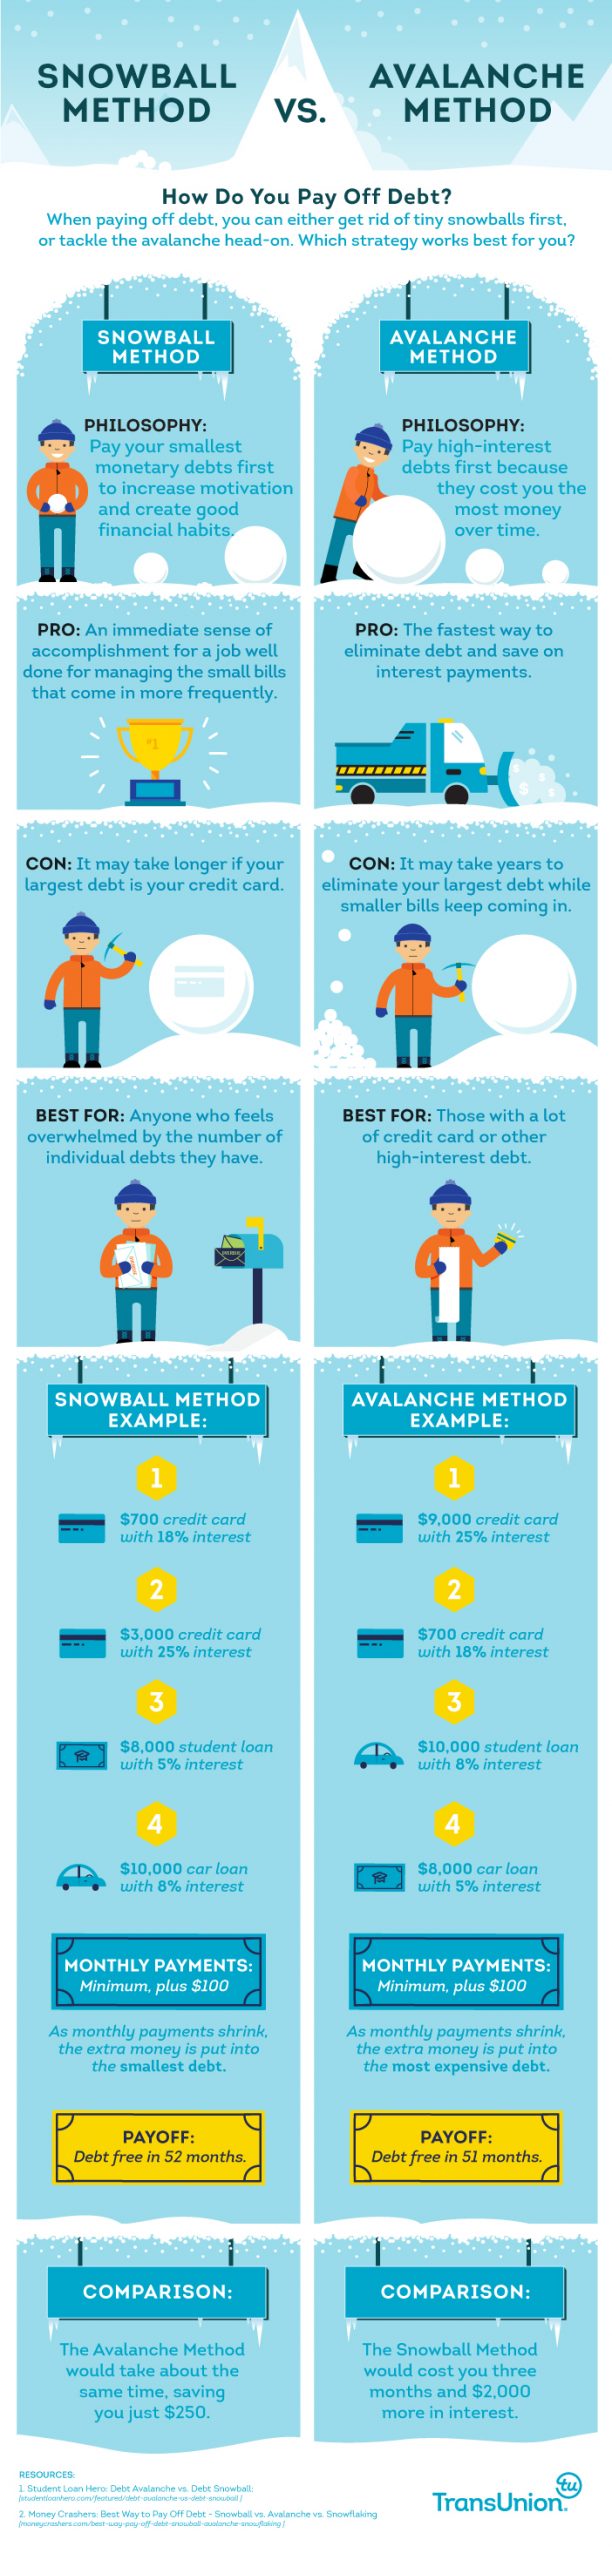
This infographic by Transunion compares two popular strategies when paying debts — the Snowball and the Avalanche methods.
Infographics about how to save money
Most of the time, getting started is the most challenging thing about saving money for short-term and long-term goals.
The infographic template below highlights the different ways that you can build the money-saving habit.


When you edit this template using Easelly’s infographic maker tool, it’s easier to adjust infographic sizes and download the infographic in your preferred formats.
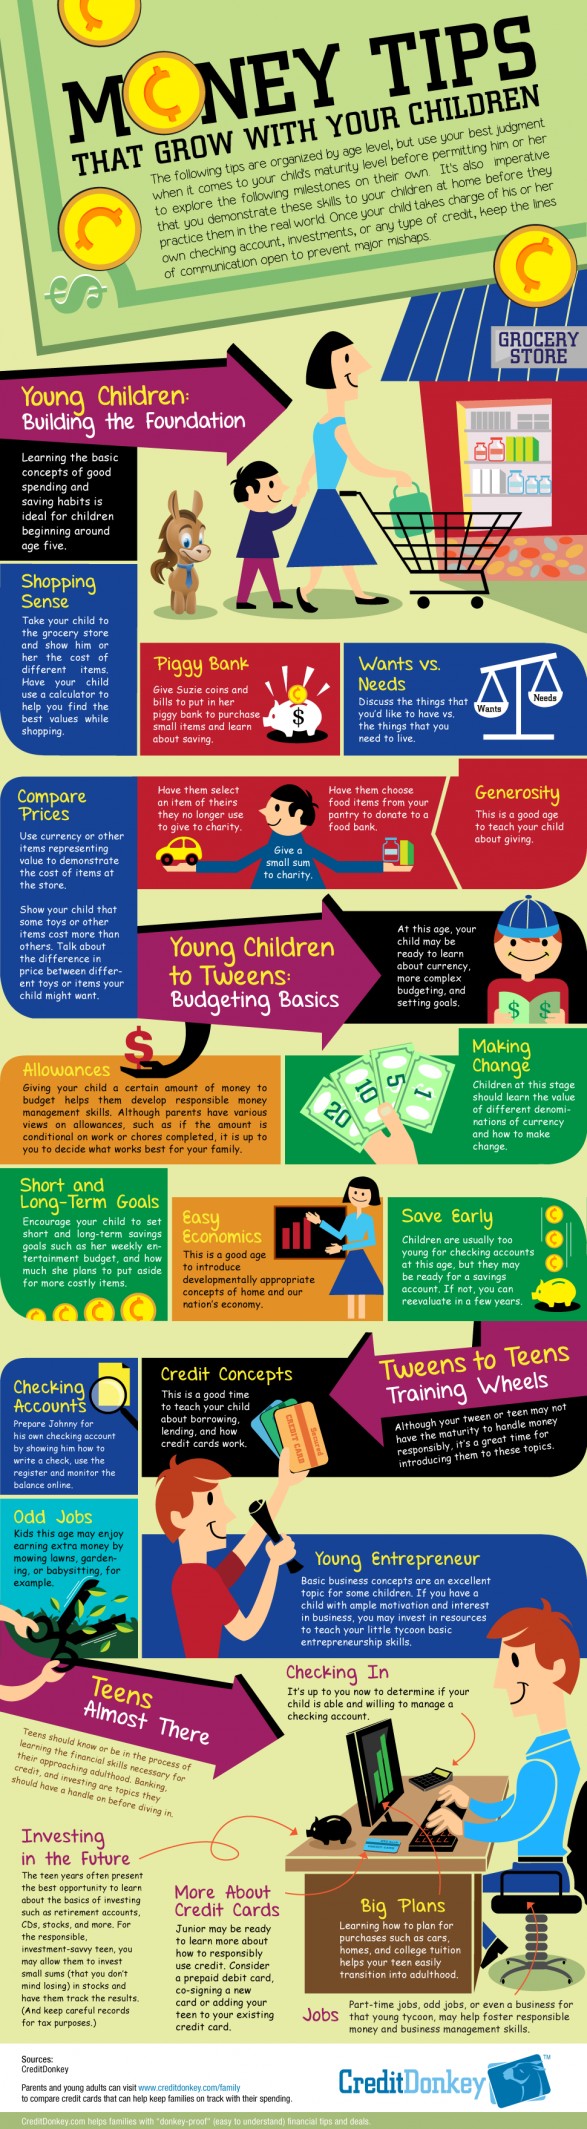
If you’re a parent and would want to help your child become a money-savvy adult, CreditDonkey’s infographic below on money tips that grow with your children is an excellent resource to get started.
Infographics about budgeting
Whether it’s a special jar that houses pennies or a savings account that everyone in the family has access to, the house budget can be a tricky pet to take care of.
Not to mention, most of it is gone in a blink – bills, house expenses, food, school tuition, toys, and Netflix.
So where did it all go? How much was spent on the occasional food-to-go?
Infographics are lifesavers when it’s time to answer these questions.
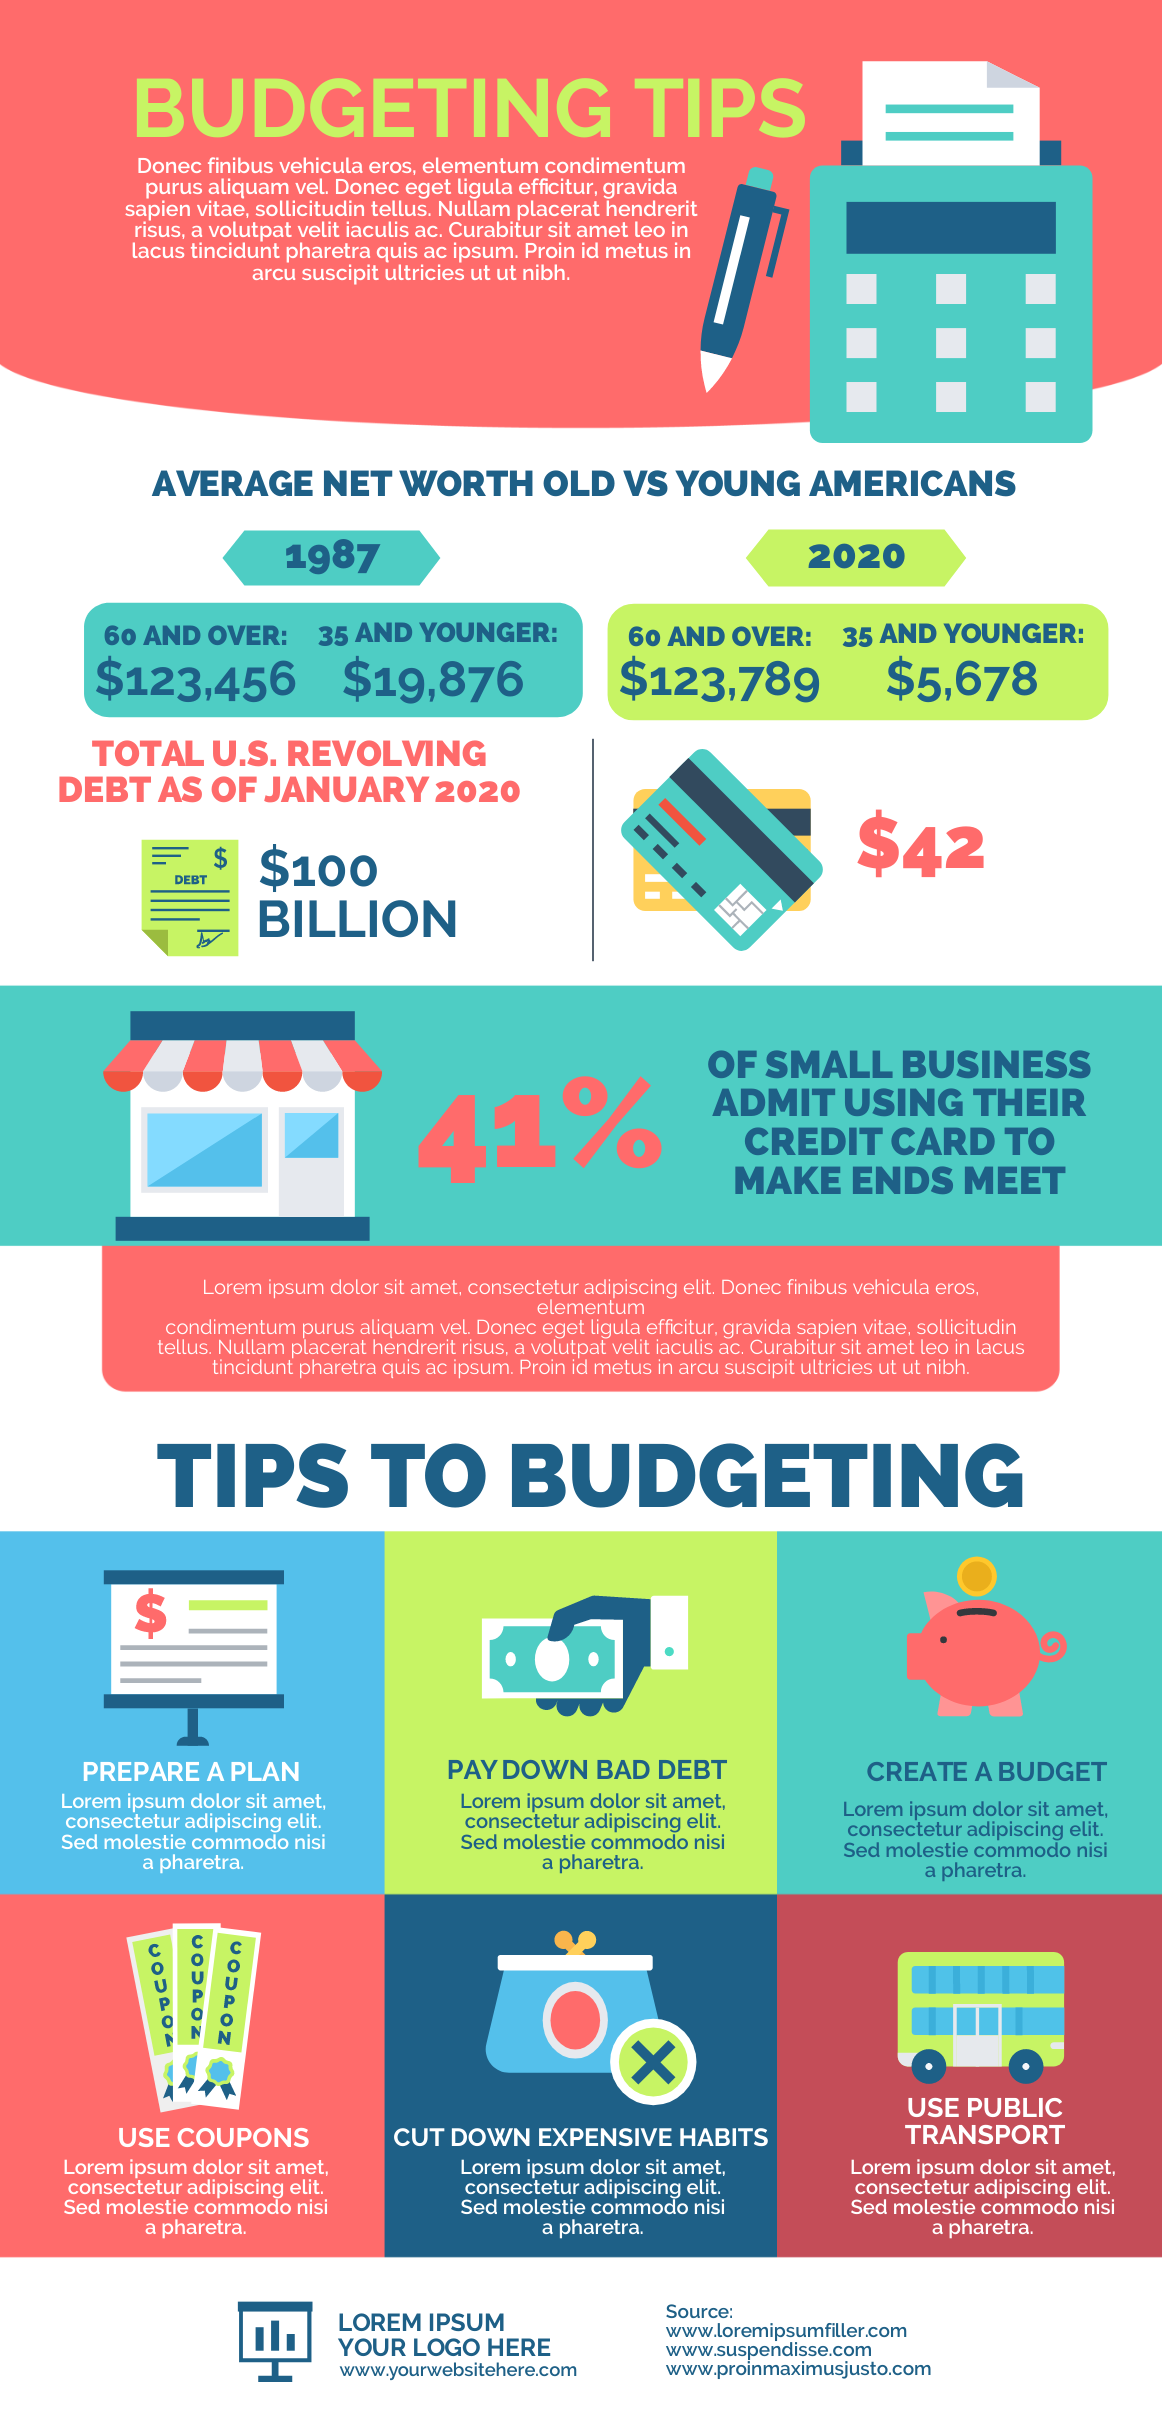
Use the budget infographic template below to get started with your own budgeting rules that work (and share it with friends and family!).
Not only do infographics make an excellent format for the account of all the expenses in, say, a year, but they can also be a great help for planning big expenses.
Use side by side comparisons or colorful data visualization to see what you spend the most on and what might need some rebalancing.
Set up a pyramid of priorities for the month or put together an elegant flowchart to help everyone follow through on a new savings plan for the year.

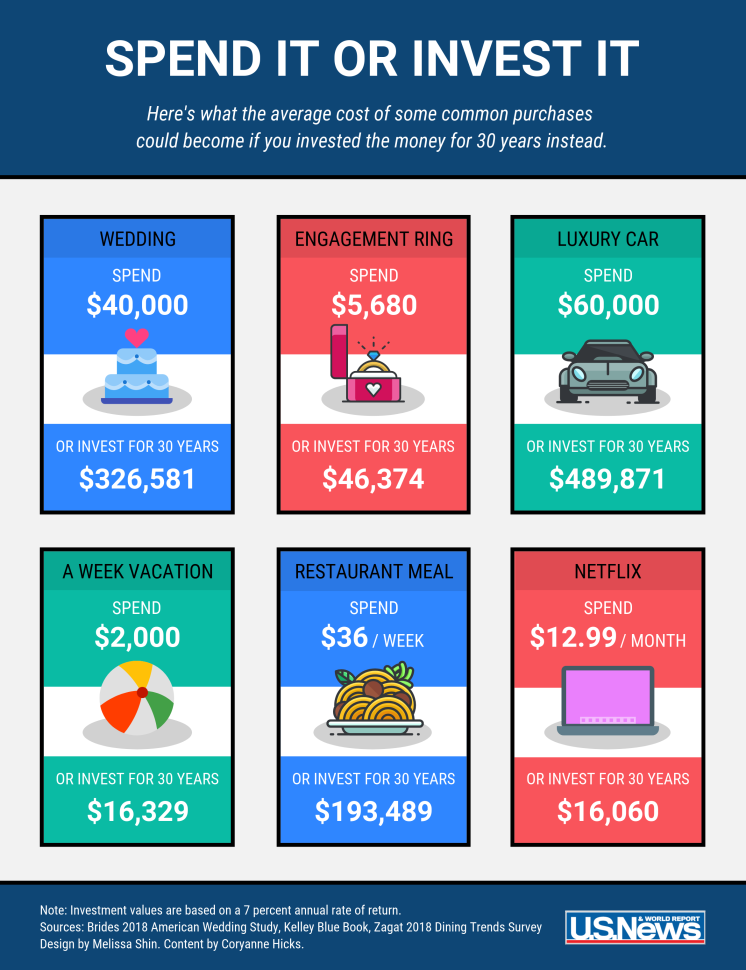
Infographics about investments
While money and wealth don’t grow on trees, it can multiply when you invest and buy assets.
The most common asset classes are fixed income, cash or money market, and equities (stocks).
You can also dip your toes into other asset classes like commodities, futures, real estate, and cryptocurrencies.
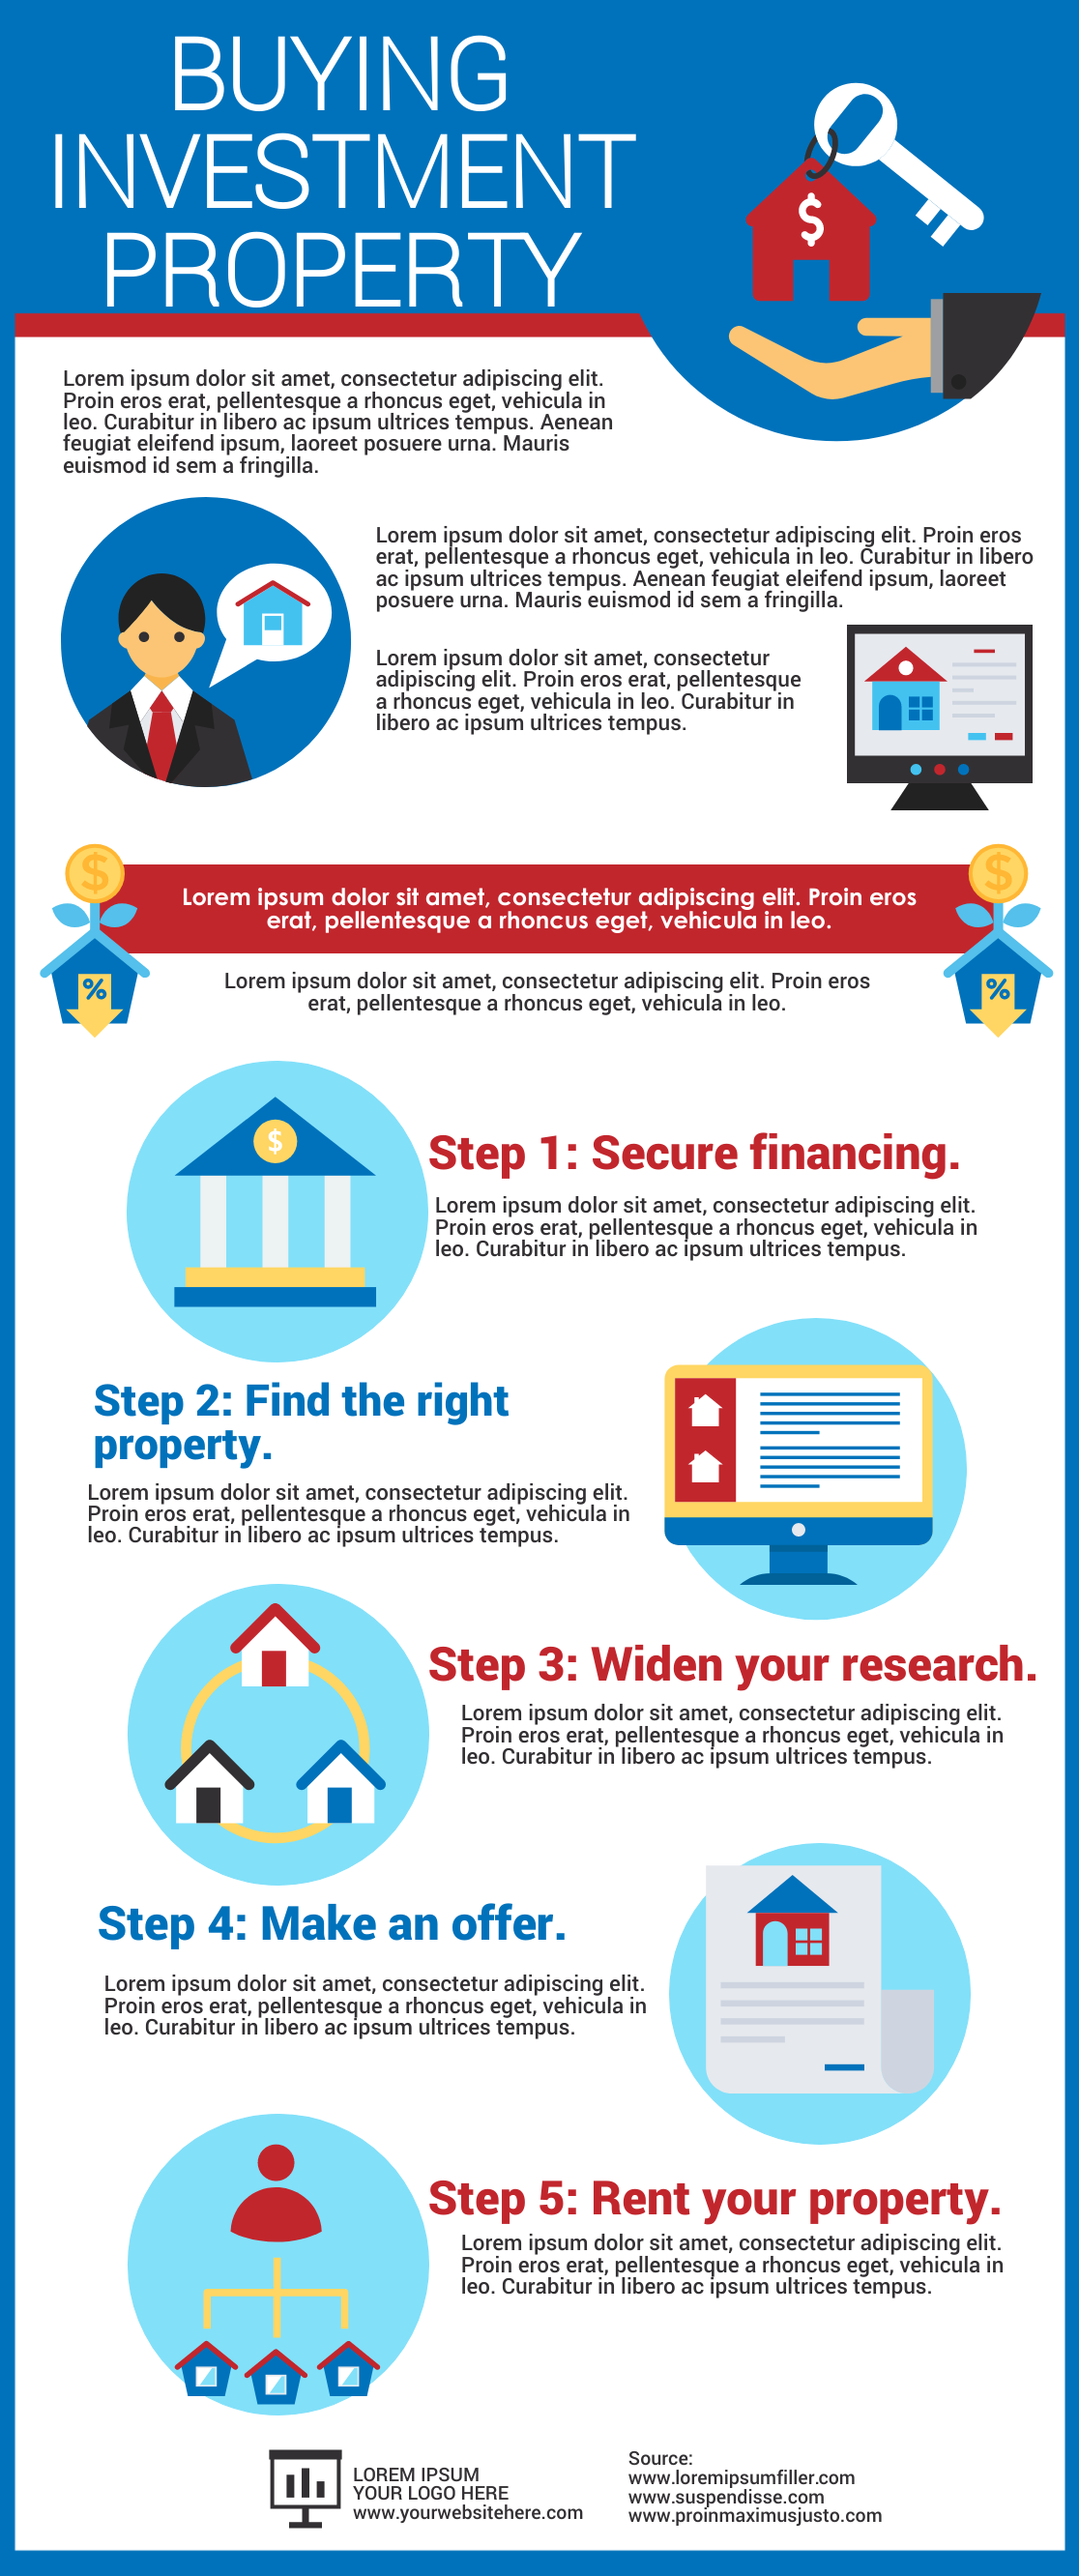
The first infographic below illustrates the power of compound interest in action while the second infographic visualizes the property investment journey.
Infographic about insurance
Accidents, health issues, and disasters can happen. Getting insurance protects you from financial ruin (and your family too!) in case of accidents, critical illnesses, and disasters.
The infographic template below answers the question, “Do I need insurance?”

Infographics about retirement
You’ve probably wondered about retirement. Do you have to retire by a certain age?
How much will you need for retirement, and where will you get it? Is it possible to retire debt-free?
You’ll find answers to these questions with the two infographics below.


Infographic for financial data
When you combine texts, icons, and well-designed charts, financial infographic templates help you cut through the noise and stand out from other financial brands who pumped out piles of reports filled with confusing figures and data.
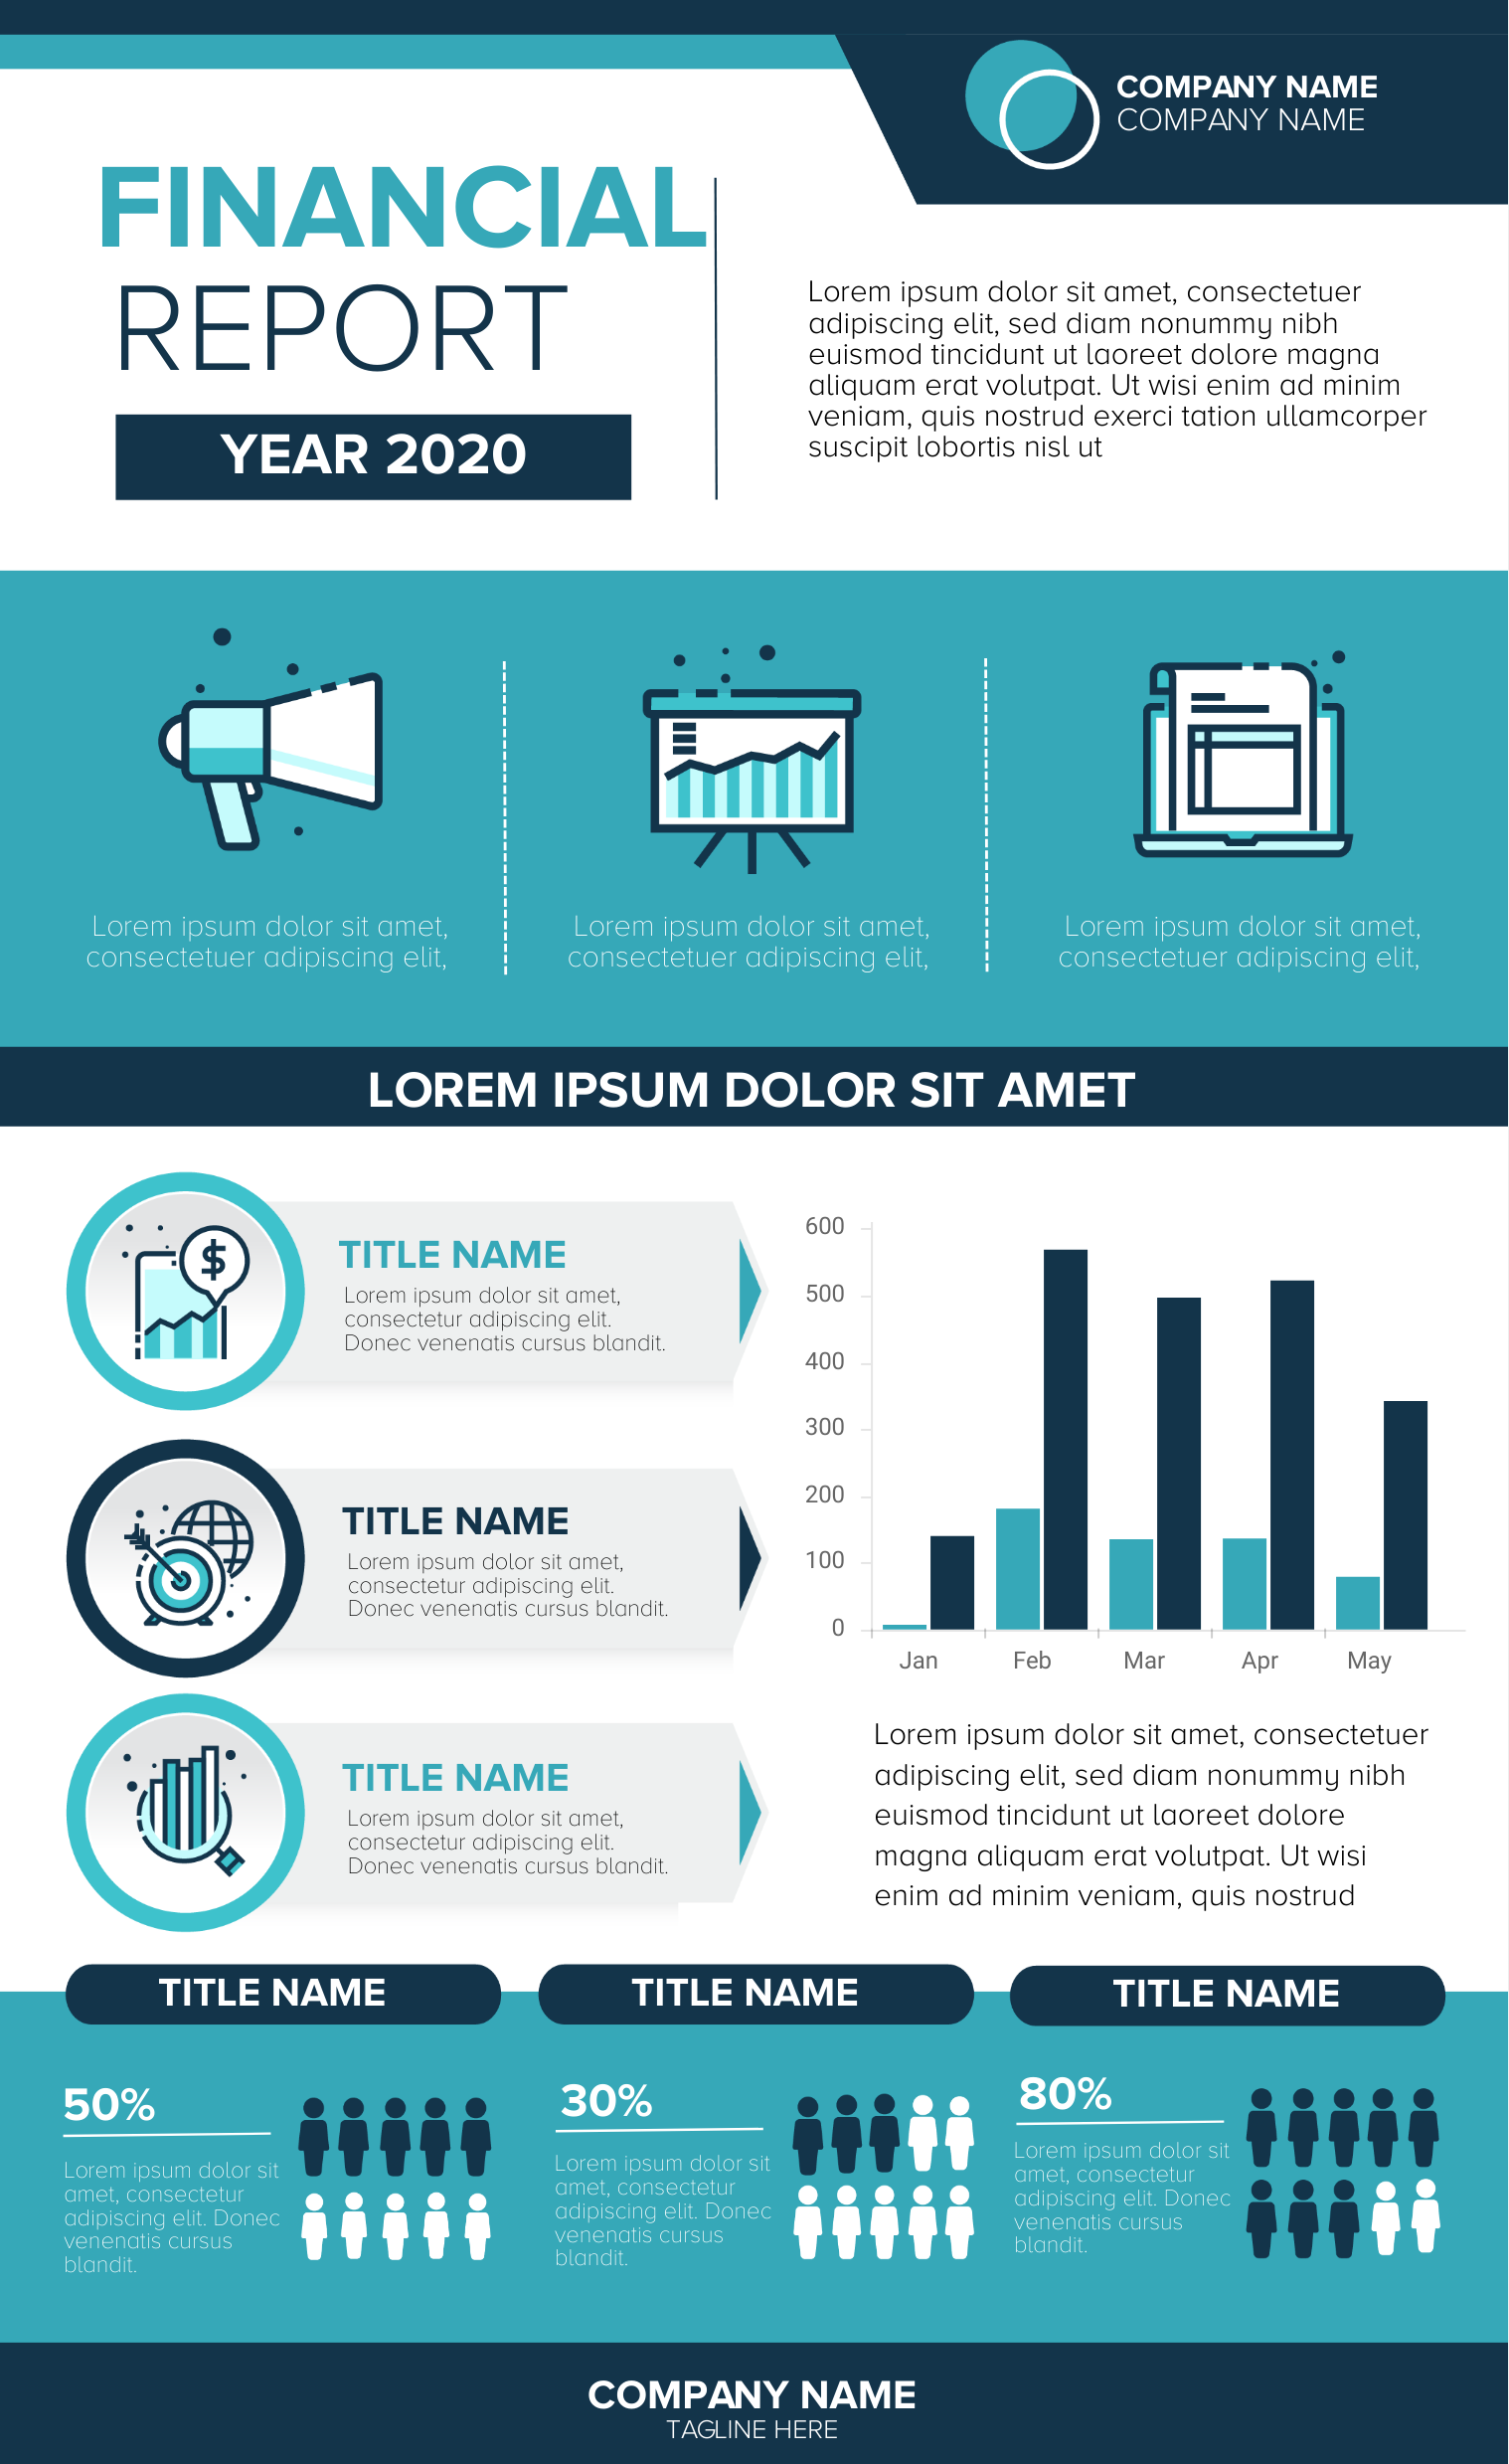
Furthermore, financial infographics are designed to help you draw the audience’s attention to where you want it. It helps ensure that the story you want to tell comes across clearly.
Ready to make your own financial infographics?
With the help of educational content through infographics, financial startups, banking giants, and wealth management agencies can establish thought leadership with a little bit of personality in their respective spaces.
Financial infographic templates can also help you save precious time. After all, time is money.
All it takes on your end is to decide on the figures, insights, or data points that you’d like to highlight on your infographic, do a few edits, and you’re all set!
So you just found the perfect infographic template, and you want to customize it with your data, but you’re not sure how to get started?
Learn from this 3-minute tutorial — How to Customize Infographic Templates in Easelly