
One of the hardest parts about marketing is boiling down your business’s services or message into one clear, attractive and dynamic point. We all know that an audience wants to know what services or products you provide without getting “the runaround,” so it’s more important than ever to make your point quickly.
And while most business owners have a few marketing campaigns to increase the visibility of their business, they often overlook the power of visuals – especially infographics.
Infographics help generate more organic search traffic and increase your SEO ranking, and they are more likely to persuade your audience to action. Some case studies even show that you can increase your web traffic up to 400% when you use infographics to share your business’s message.
So if you’re wondering how to communicate what your business does, try infographics.
With infographics, you can highlight what your business does – and how it does it – in just a few steps.
Pay attention to structure (So your audience pays attention)
If you want to really show your audience what your business does in record time, you need to structure your infographic the right way. This means:
- Making your business name or services visible at the very top of your infographic
- Including visual information about your services or business (try to find icons to replace text)
- Creating a Call to Action at the bottom or side
You can see our basic infographic structure recommendation below.
Feel free to get creative – you can even have an infographic that flows horizontally (left to right)! Just make sure that the main components are still there and that they make sense to the eye.
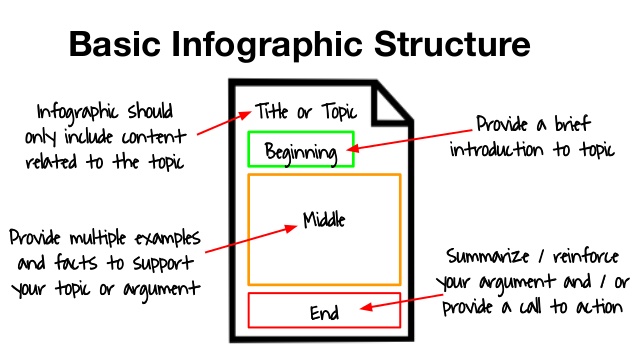
After you’ve built the top out, you can include information about you, your product, or your services in the middle. This is where you communicate what your business does, so try to make it as concise as possible.
As a general rule of thumb, we recommend sticking to minimal text (about 30% of the total image) and try to find icons and objects that match your message. For example, you can use maps to show where you provide your services, or use people icons to represent who you serve.
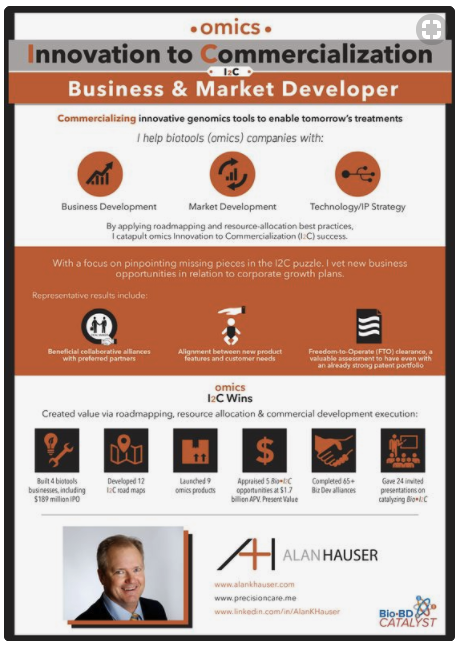
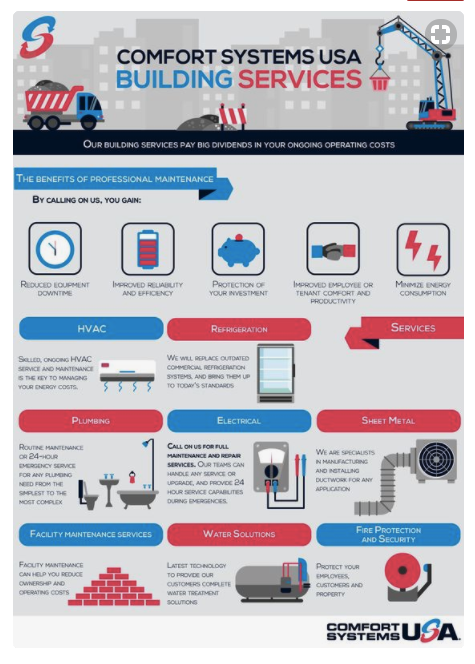
For each business, this looks very different, but here are a couple of our favorite examples made with Easel.ly:
Then, you always need a Call to Action at the bottom or side of your infographic (depending on the structure and flow of your template). Just like your business name or services, you need to make sure that this stands out. Your Call to Action is what is going to get more traffic, revenue, or clients for your business so don’t forget it!
Note: It doesn’t have to say “Call to Action!” It can just be a phone number or a key action like “See more at www.easelly!”
Stay on brand with infographics
Finally, when you’re starting to create infographics for your business, it’s always important to stay on brand. The best way to do this is pick colors that match your logo, business site, or style guide (if you’ve worked with a graphic designer).
If you don’t have a style guide, or are just launching your business, it’s really important to find 2-3 colors and about two fonts that represent your company, services, or personal brand. This way, you have a “go to” set of colors and fonts that make creating your infographic even easier! Sticking to this style guide will also help your audience recognize your visuals and associate them back to your business or services – which is all part of building your brand!
Recommended reading for business infographic creation
- Affordable Infographics to Boost Your Content Marketing
- Using Infographics to Promote Your Startup Business
- Promoting Your Small Business with Infographics: 4 Great Examples