At Easelly, we share a lot of advice on how infographics can be used to increase your website traffic, grow your business, or even just help you grow your audience. And all of the advice we give you is easy to implement, helpful, and it really works. How do we know that? We’ve seen it in action!
Infographics for social media: A case study
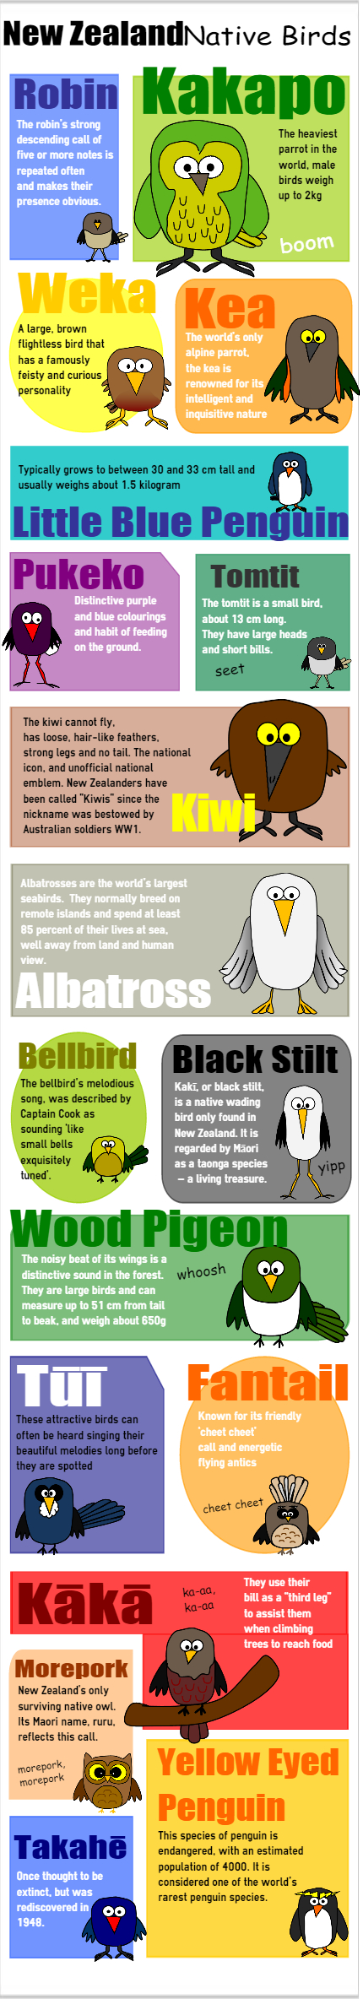
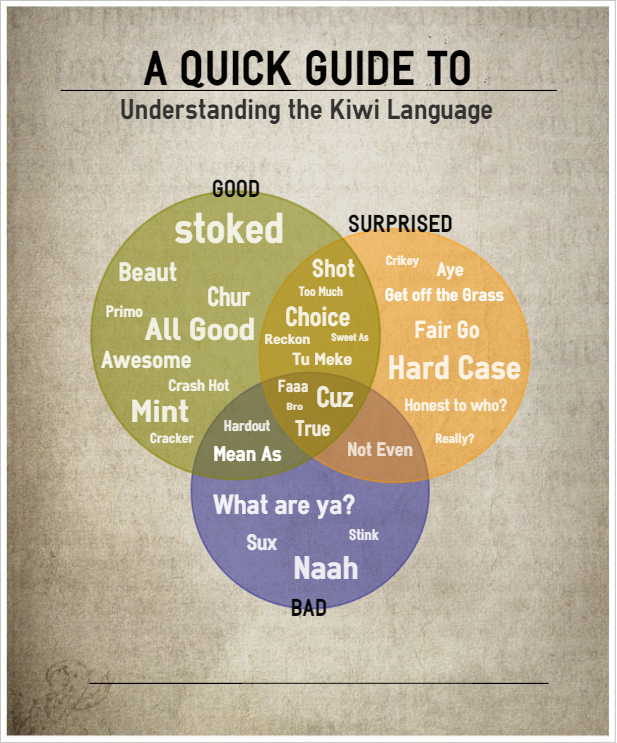
One of Easelly’s users, Claire Roper, happens to be a social media expert who runs her own website, claireroper.com. She also has a blog and Facebook page dedicated to her hometown in New Zealand, Otaki (pronounced Oar-Tar-Key), where she discusses fun things to do and content relevant to New Zealand in general.
Now living in London, though, Roper is also a huge fan of sharing her content and social media marketing knowledge with her new community.
To do so, she has started a face-to-face workshop (Yes! In real life!) called “50 Shades of Social Media” where she discusses a variety of ways to promote yourself, your brand, or your business. As part of this workshop, she teaches people about the power of infographics and how to use programs like Easel.ly to create them, share them, and more.
How Claire used Easelly for social media
Roper frequently uses Easel.ly to create infographics, either for her Otaki site or to share on her social media.
“I enjoy the pure ease of this product, it’s simple to use and you don’t have to be a creative or graphic designer to ensure your infographic looks amazing. I enjoy the simple drop and drag element as well as being able to upload my own images.”
Since introducing Easel.ly as a section of her “50 Shades of Social Media,” Roper has also benefited from a 10 percent rise in registration!
Aside from her workshop, she likes to experiment with her digital content, see what works and what people respond to, and challenge herself to create new and more relevant infographics and images. Her target audience is her best indication of what works and what doesn’t.
Increased visibility
Since starting to use infographics, Roper has seen an increase in comments and interaction on her blog and social media, and she has doubled her traffic.
“Social sharing has seen the biggest rise in statistics. Sharing infographics on Otaki Zilchoo’s Facebook page [resulted in] a 50% increase in likes on individual posts (which had the infographic) and customer reach rising from a standard 220 views to 640 views.”
Claire is a prime example of the power of infographics and visuals, especially when it comes to audience engagement on your website and social media.
If you’d like to hear more about real users increasing their web traffic, conversions, or even profit margins by using infographics and Easel.ly, stay tuned! We will be spotlighting users and their stories each month on the Show Don’t Tell blog.
Check out Claire’s website for a ton of helpful information on social media and content marketing, like her article, “Ever Wondered What Colors to Use With Your Image?”
You can also follow her on Twitter @ClaireMRoper for tips on content marketing and visual data creation! Follow @easel_ly to get updates on our latest “true stories” and to see what other great stuff we have to share.