Psychology has always been one of the most fascinating yet controversial social sciences to explore.
Why?
For one, its main purpose is to study, understand and predict behavior, in addition to investigating mental processes.
There are absolutely intriguing topics in this area of science such utilizing psychology in criminal investigations, forensic science, and what your pet of choice can say about you.
Psychology infographic examples to help understand human behavior
Psychology is a very in-depth subject, so hopefully these psychology infographics will help you wrap your head around it!
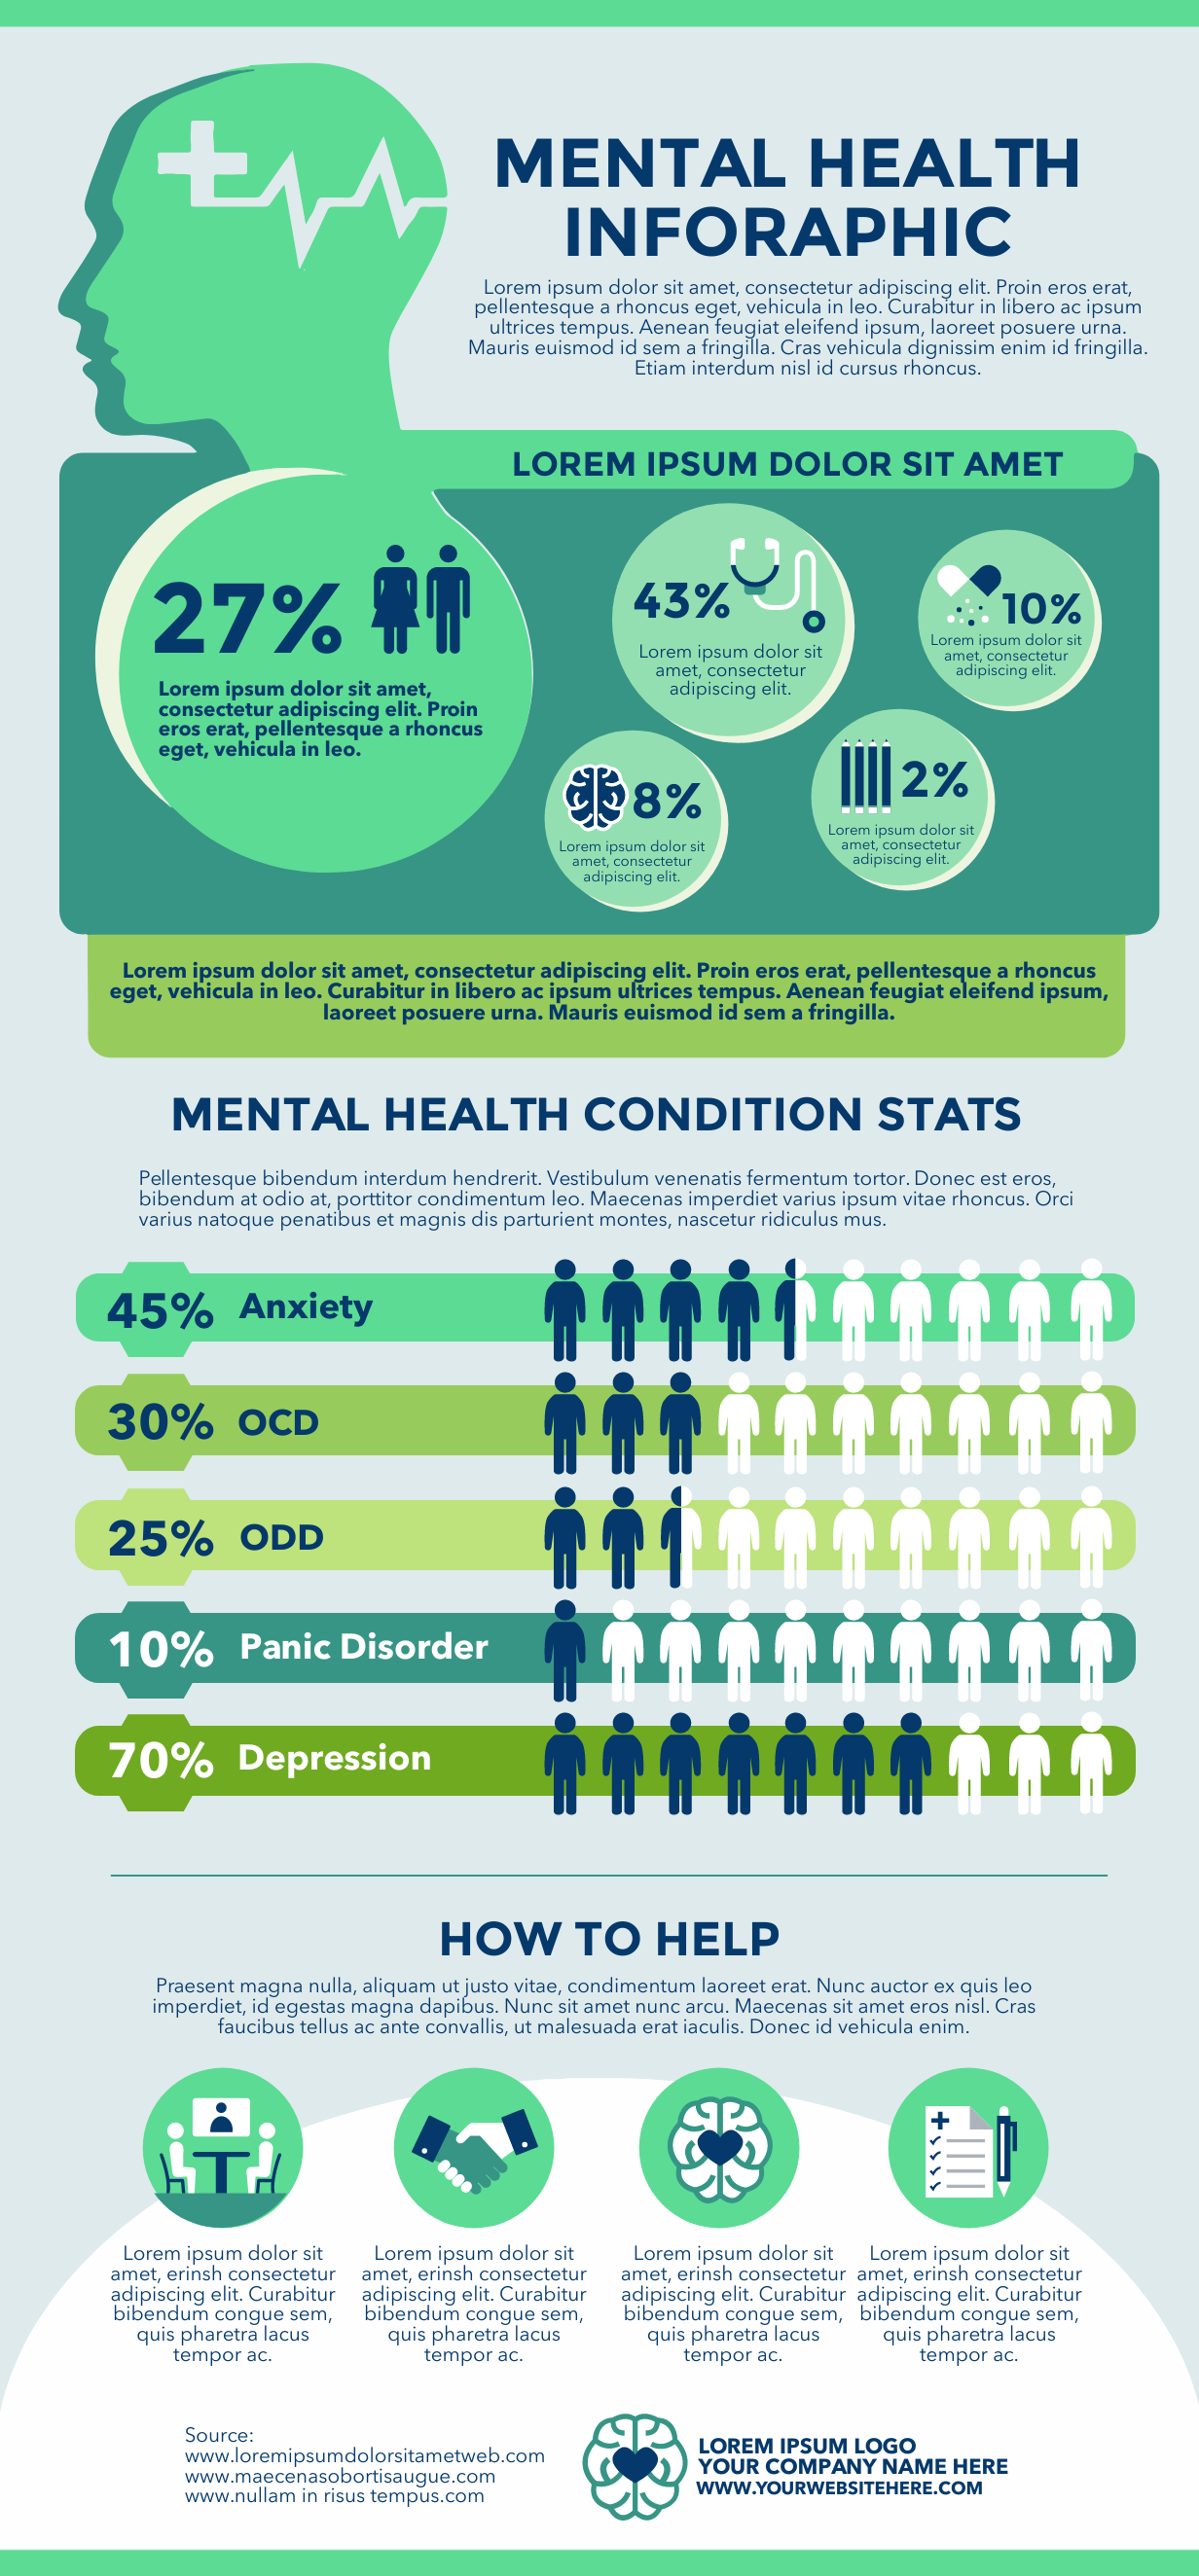
Mental health infographic
The first psychology infographic we want to share is about the socioeconomic costs and disease burden outcomes of mental health problems.
This infographic outlines the costs of mental health issues which are aren’t just confined to the reduced quality of life experienced by sufferers.
Anxiety, depression, substance abuse, and similar mental health issues can also have an impact on society and the economy as a whole.
Emotional intelligence infographic
Emotional intelligence, or EQ, has been extensively discussed by different mental health practitioners.
This comparison infographic expertly differentiates EQ and IQ or Intelligence Quotient.
What does high EQ mean versus high IQ? What are the benefits of having high emotional intelligence compared to high intelligence quotient? And how do we measure each of them? Thought-provoking indeed!
PRO TIP: If you want to get started with your own comparison infographic, use comparison infographic templates so you don’t have to make from scratch.
All it takes on your end is to decide on the data points or ideas that you’d like to compare and use the right color combinations, icons, and alignment to emphasize similarities and differences.
Psychology of punishment infographic
Another interesting topic in the field of psychology is whether spanking children is beneficial or not.
In this highly disputed spanking infographic, the psychology of spanking is laid out – whether it’s an effective form of discipline or not according to public opinion.
It also shows the US states that allow spanking in schools, the kind of parents who approve of it, and the effects of spanking on different age ranges of children.

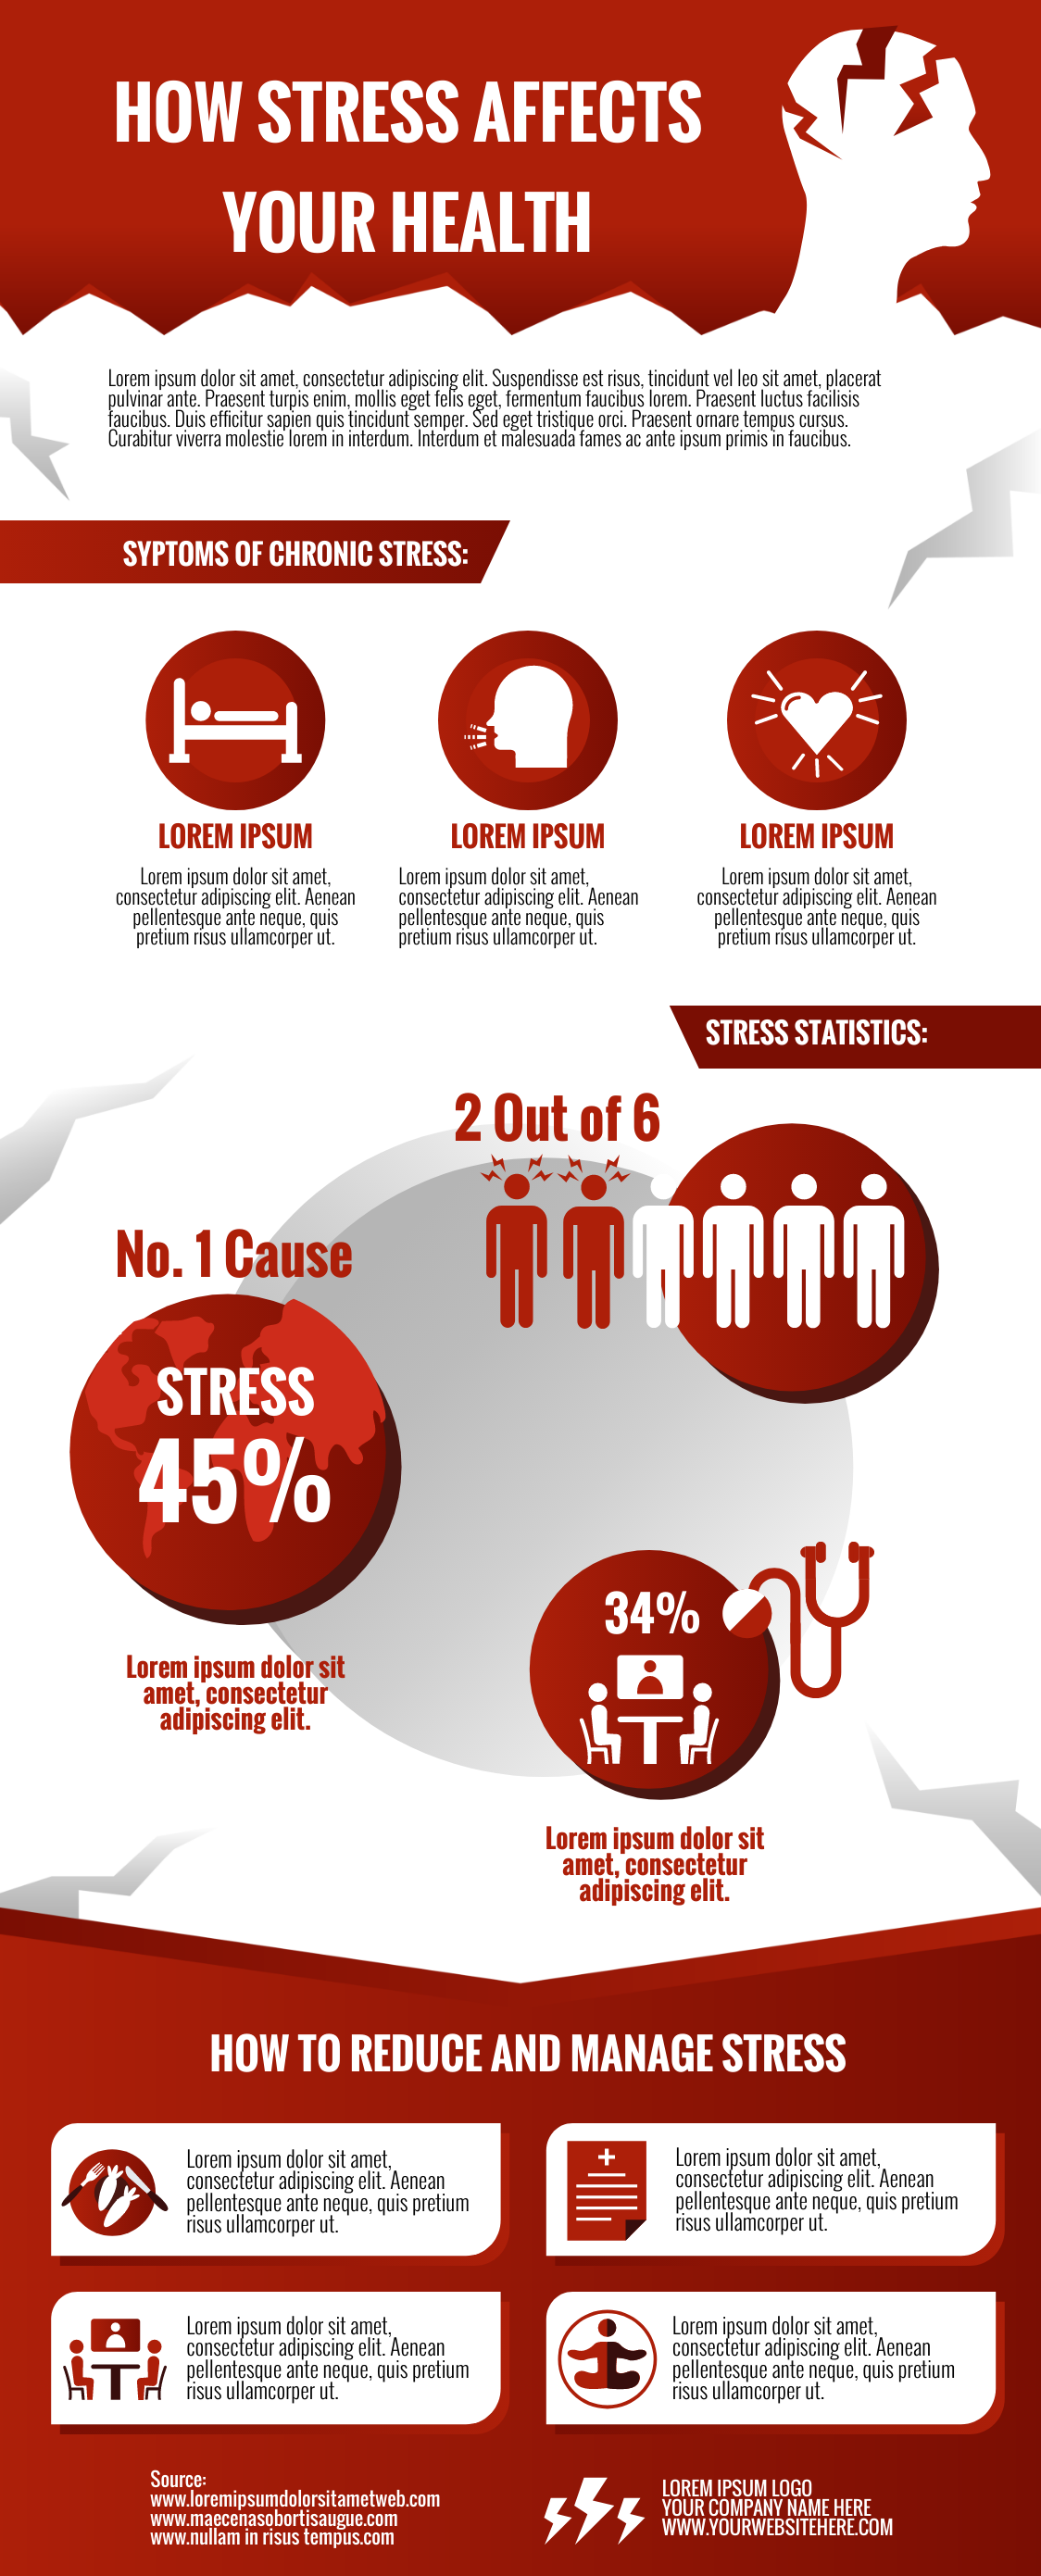
Stress infographic
We have heard a lot about stress — its causes, symptoms, and how to manage it.
This very detailed infographic talks about what stresses most people out, how prone each person is to stress and even top ways to cope.
What’s great about this visual aid is that it not only educates us, but it also reminds us to take care of ourselves from time to time.
Want to make your own stress infographic? Customize and download the stress infographic template below.
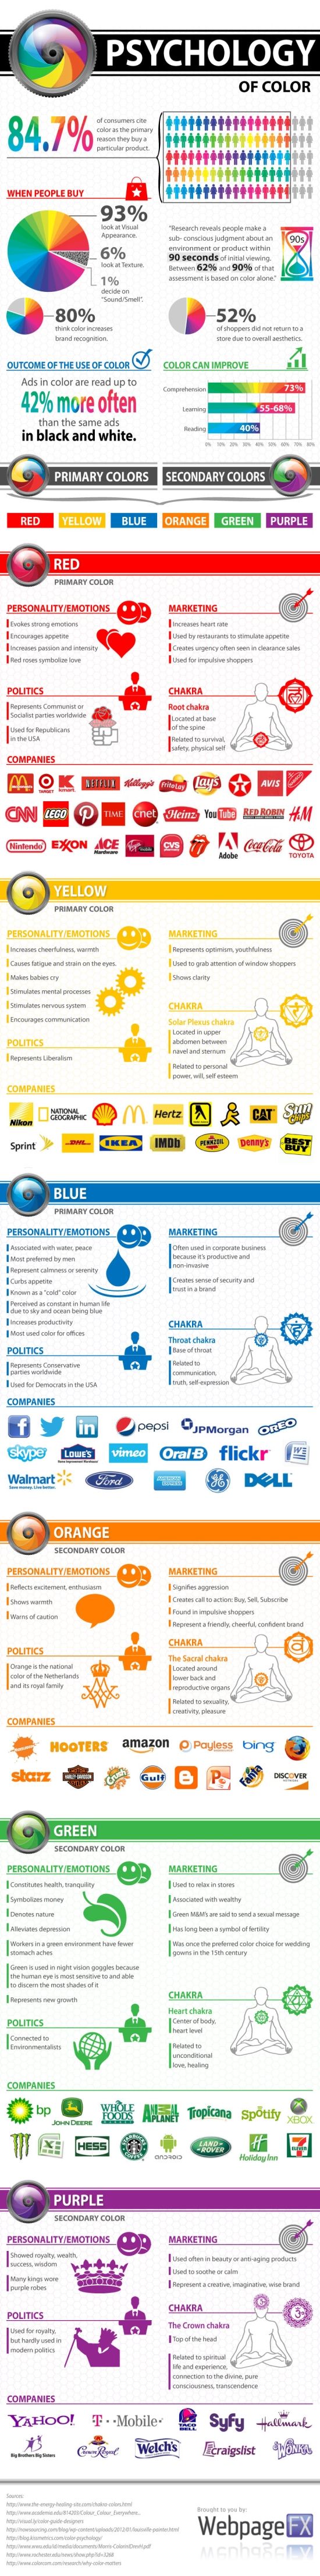
Psychology of color infographic
This psychology of color infographic is a fun and captivating way to understand branding and marketing.
This infographic shows the different meanings a color can have – from emotions to personality to politics and marketing.
Thanks to this breakdown, we can see why most food and beverage companies use red in their logos and why blue is the main choice for corporate businesses. Selling beauty products? Choose purple!
Getting started with your own psychology infographics
Looking for psychology infographic templates with people icons, photos, or illustrations?
Scroll through Easelly’s library of infographic templates and unleash the inner designer in you by creating eye-catching visuals quickly. The creative possibilities are endless with these ready-to-use templates!
Here are a couple of examples from our collection:
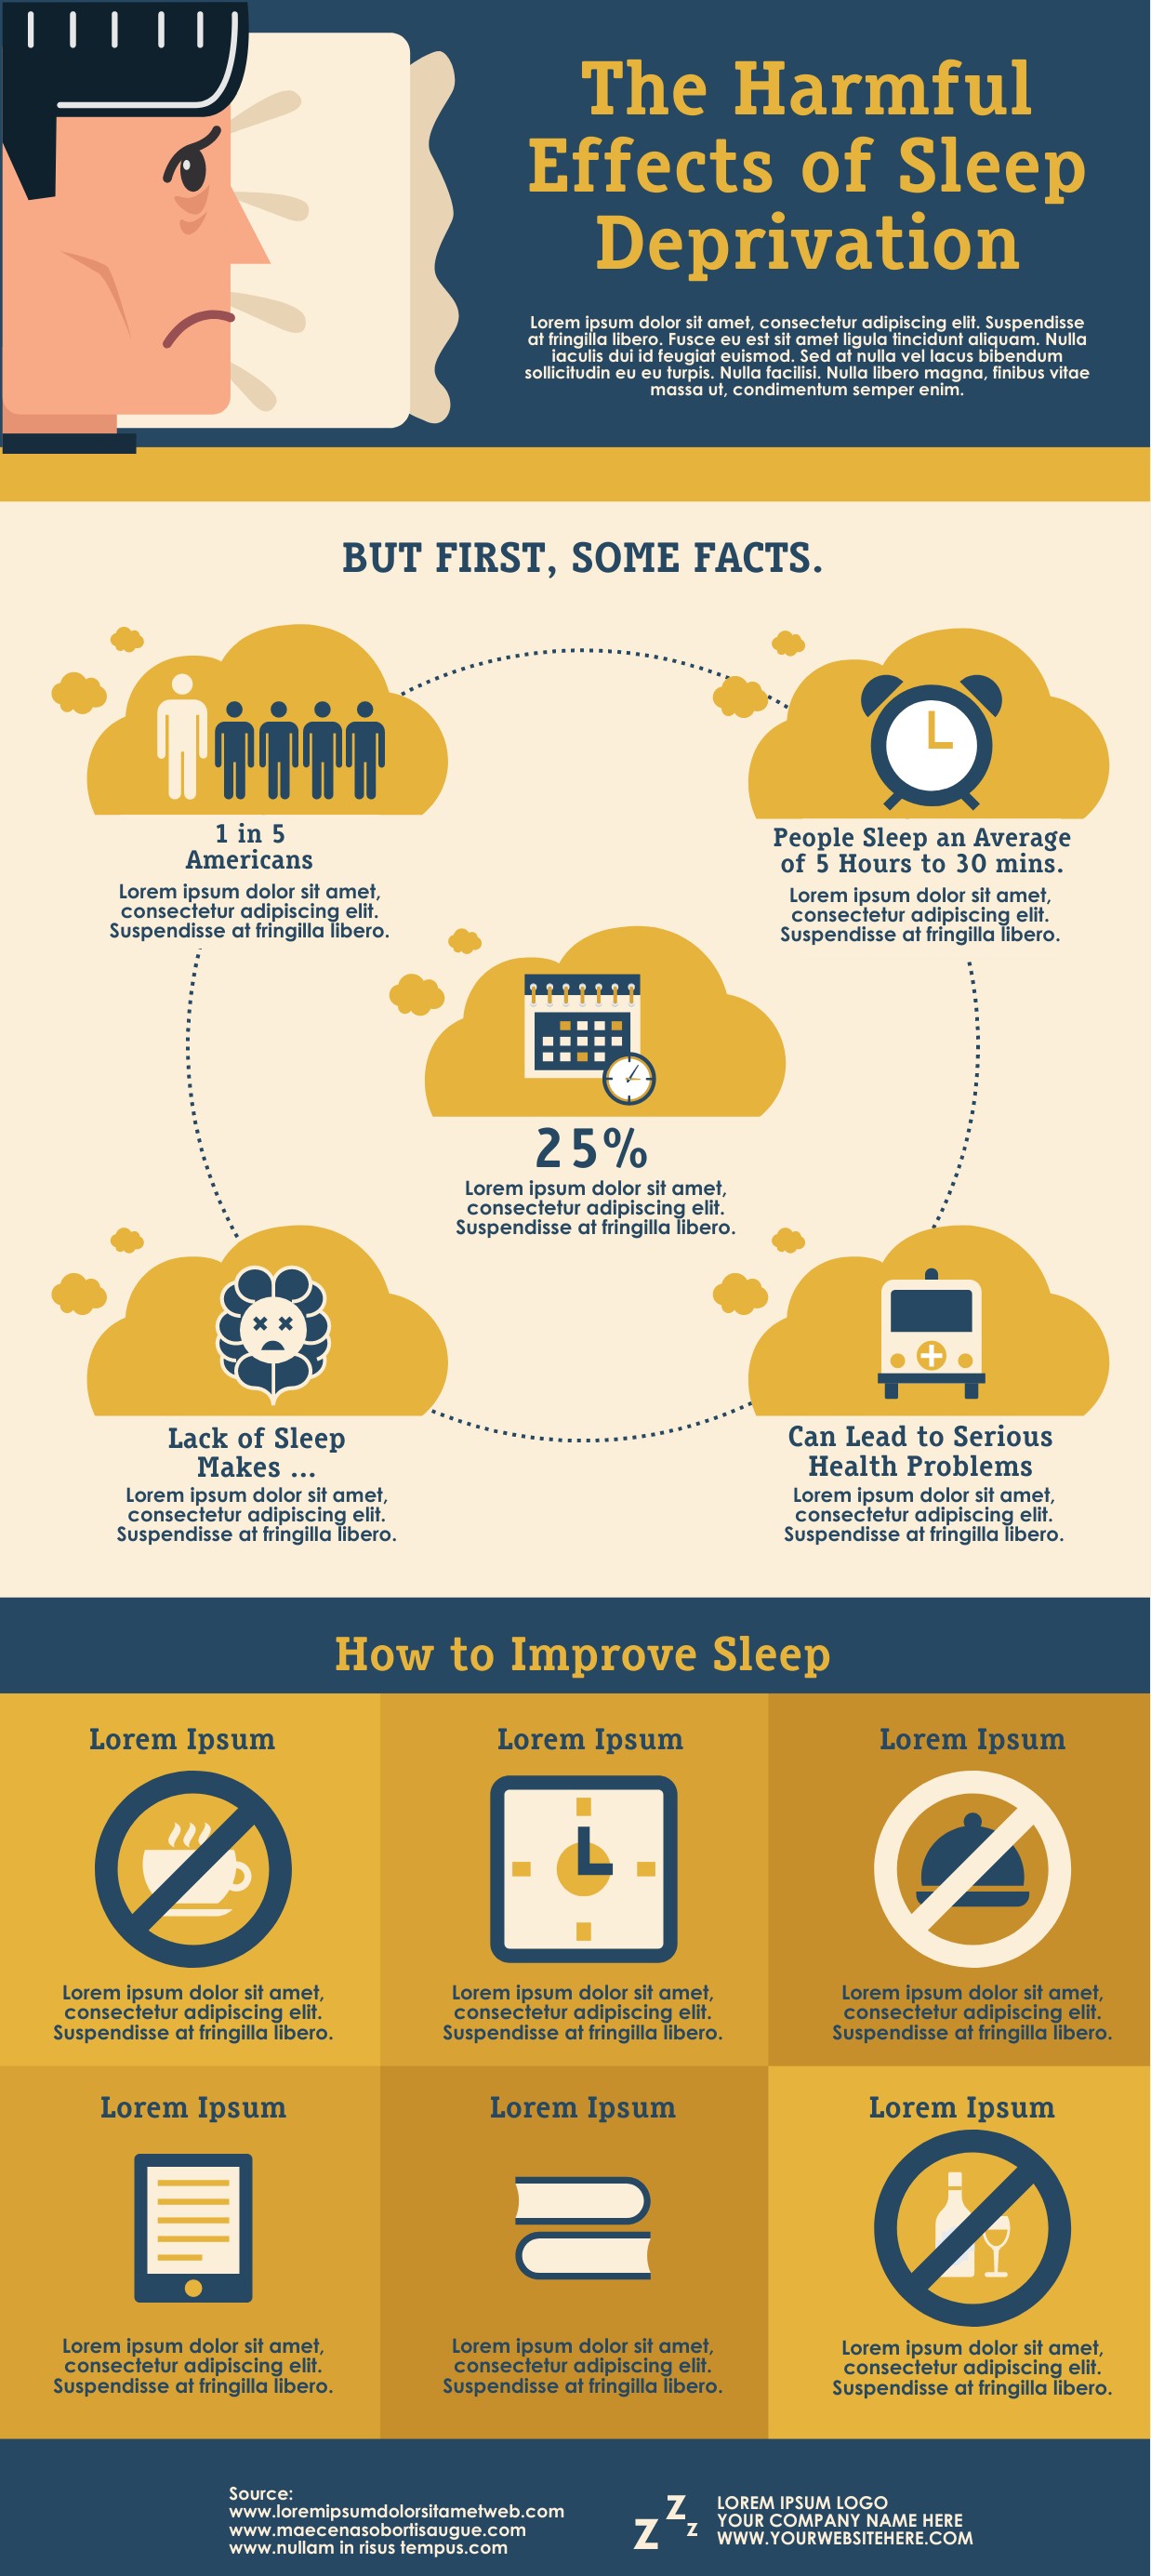
Sleep deprivation infographic template
Mental health statistics infographic template
Watch the short tutorial below to learn you can customize infographic templates using Easelly’s simple infographic maker.
Before you know it, your infographic is ready to keep your class engaged and fascinated with the wonders of science!
Finally, if you’re truly pressed for time to make infographics from scratch or edit a template, our infographic design team would be happy to help you out!
*Editor’s Note: This blog post was updated on May 29, 2020 for accuracy, new updates, and comprehensiveness. It was originally published on Feb 21, 2018.