
Recently, The Indiana Council for Economic Education offered 4th through 12th grade teachers the opportunity to have their students participate in the Indiana Stock Market Program.

Here, students kept track of investments using a stock simulation and participated in an infographic competition.
Students were allowed to choose from ten different investment-related topics to create an infographic and were graded on a very specific rubric (see the bottom of this article).
The Assistant Director of the Indiana Council for Economic Education, J.W. Fansler, recently shared the details of the competition with Easel.ly.
The Indiana Council Competition
“During the spring semester, over 210 entries were submitted and students again received prizes for elementary, middle, and high school divisions. Any student who competed in the Smart Indiana Stock Market Program could submit an infographic into this competition,” said Fansler.
Once the infographics were submitted, they were judged by a panel of investors from the financial industry. Three student teams from elementary, middle, and high schools were given a monetary award and recognized at an annual banquet by the Indiana Council for Economic Education and the Indiana Secretary of State. Winning images were also made into banners and displayed at the annual program in May, and will be included in conferences throughout the year.

Fansler shared that, by using infographics, both teachers and students learned a lot about stock market diversification and the educational influence of infographics.
How Teachers and Students Used Easelly
“We recommended two options for the students,” Fansler said. “They could either use PowerPoint or they could use Easel.ly [to make their infographics].” Many of the students chose to use Easel.ly “because it was much easier to use,” he explained. The only instruction the students were given was to research ‘infographics’ on Google, then use PowerPoint or Easel.ly to create their own image.
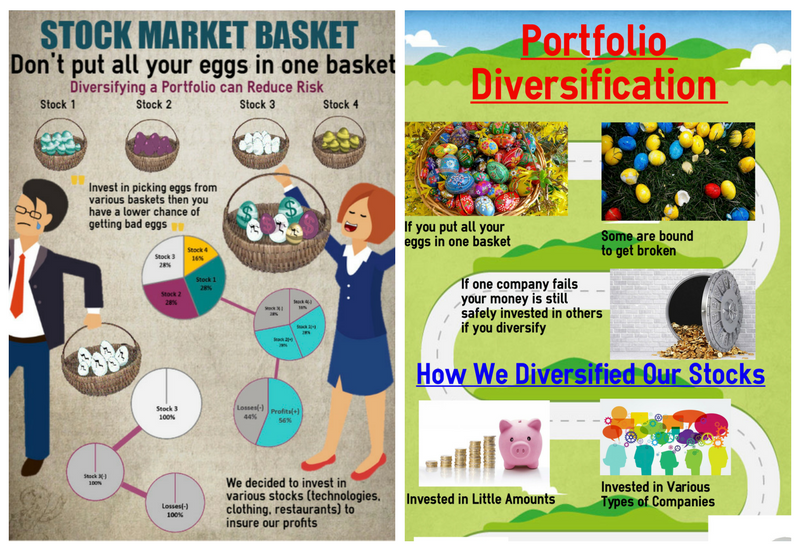
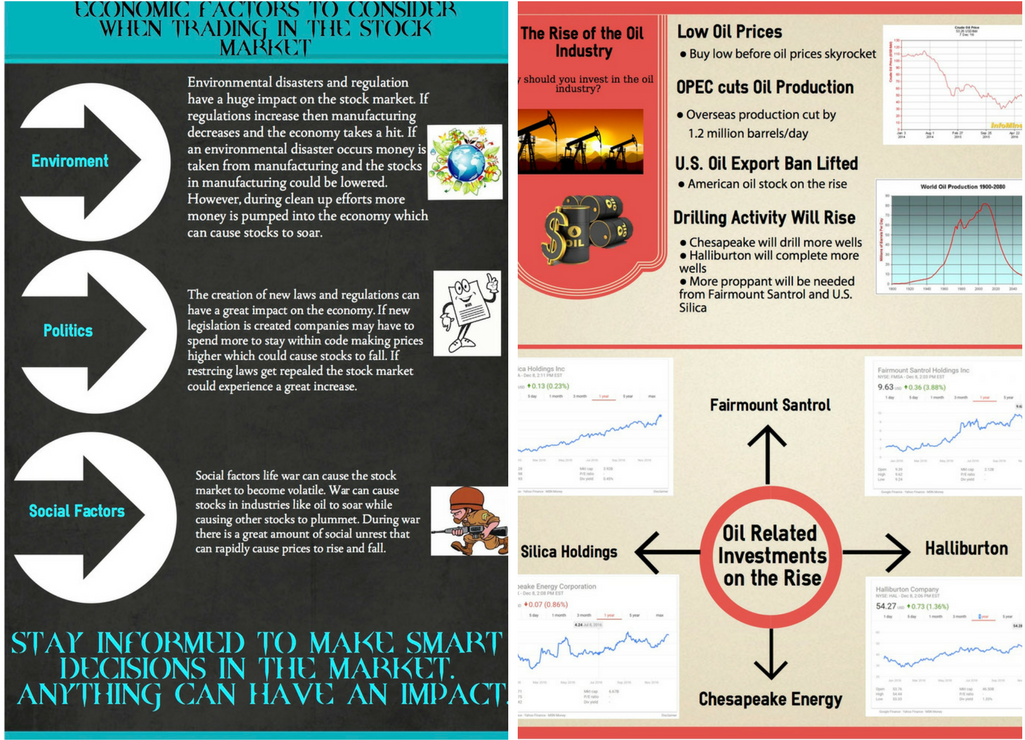
If you ask us, the students did an amazing job!
Here are some of the infographics they created for the competition:
Introducing Infographics into Classes
When the council invited teachers and their students to take part in this competition, many teachers shied away from it because they had never used or taught infographics before.
“Most of the teachers were brand new to this type of thing,” JW shared. But by encouraging teachers and students to engage in the competition, he explained that the council hopes to help teachers realize that creating infographics is an important skill for their students to learn.
Many of the economics teachers didn’t know anything about infographics before this, but they soon found out that it was a great way for everyone to learn about infographic concepts – themselves included! Teachers who participated can now have their students use infographics as a way to display knowledge they gain throughout the semester, unit-by-unit.
Why Infographics Matter in Education
According to Fansler, the Economic Council believes that “it is important for students in K-12 education to learn how to create infographics.” Training younger students on how to visually depict a concept is very important, as it will continue to be a skill they use as they grow up, go to college or find jobs.
“Students need to be able to take mass amounts of data and turn that data into something that is visually appealing and that can be understood by the general public,” he explained. Understanding the information and then being able to interpret it visually also helps students absorb information and may lead to increased test scores, comprehension, and overall success in class.
“Students need to be able to take mass amounts of data and turn that data into something that is visually appealing and that can be understood by the general public.”
Create Your Own Infographic Competition
Thanks to Fansler and the many participants in the economic infographic competition, we have some great tips for designing and grading infographics that reflect learning and comprehension.
With little guidance, these students managed to create infographics that won them a place in the Indiana Council’s competition – that is a true testament to how easy infographics can be. Teachers can let students explore infographic tools like Easel.ly without needing an in-depth introduction; let them play and learn! Easel.ly’s templates, as Fansler said, make it easy for students because they don’t have to create anything from scratch. They can use our favorite templates to quickly and easily insert their own data. This makes it SO much easier for students to absorb the information they’re handling, as opposed to just dumping it in the Creation Tool while trying to figure out how the Creation Tool works.
Easelly’s templates, as Fansler said, make it easy for students because they don’t have to create anything from scratch. They can use our favorite templates to quickly and easily insert their own data. This makes it SO much easier for students to absorb the information they’re handling, as opposed to just dumping it in the Creation Tool while trying to figure out how the Creation Tool works.
As our friends over at EdTech Magazine say, it’s also important that students engage in active technology use, rather than just passive use. Students can think critically about the data they collect for their infographics and “drive the point home” by using visuals to represent their interpretations.
Infographics in education are a highly underestimated tool, one that many more teachers are discovering. If you’re interested in learning about how to use infographics in your classroom, check out this list of resources:
- #NYCSchoolsTechChat – Resources, Images & More!
- Improving Data Literacy in Schools
- Infographics & Writing Standards: Standards and Purpose Process
- VIDEO: Using Easel.ly to Create Infographics in the Classroom
- The Rise of EdTech and How One Teacher is Making the Most of It
And for a general rubric, Fansler’s panel used this simple outline:
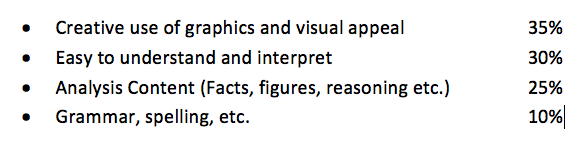
Infographics don’t have to be perfect, and as Fansler said, “Easelly makes this process easy even for students who are not overly artistic” or who don’t have much technological know-how.
Start creating today or let your class explore Easelly’s infographic templates. You’ll be amazed at what they come up with!