With the push on STEM and students collecting all kinds of data, my teacher colleagues often ask for ideas to allow students to present the data in different and more interesting ways. I often share the idea of using an infographic to display the students’ data. Infographics are everywhere! We see them used in TV commercials, Internet ads, and many other places to visually display data in ways that make it easy to understand. The infographics are very pleasing to the eye.
Easelly is a great infographic creation site to use with students at any grade level! The students I chose to work with first had collected data about the amount of trash being created in their school. They collected data for 5 weeks by weighing the trash in the 8th grade classrooms at the end of each day. I created a group for the students to join in Easel.ly and selected a specific background for them to use. Using the data recorded each day, students found an entered the average of the trash collected each week on the infographic. Once the infographics were complete, they were displayed so that everyone in the school could see just how much trash they were generating.
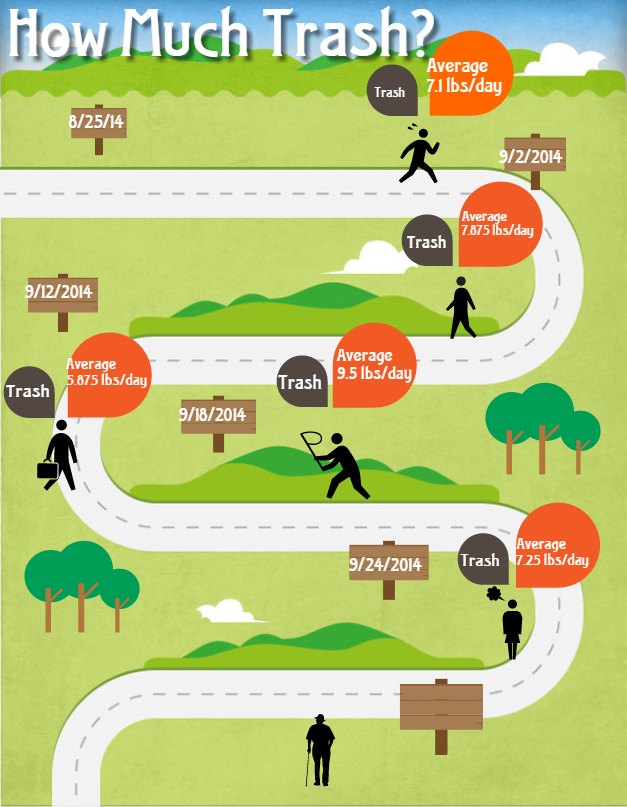
This was a great way to have students create presentations like those being used in the business world. The students enjoyed making the infographics and looking for ways that they could help reduce the trash created in the school and headed for the local landfill.