As an increasingly visual society, it makes sense to relay information in a visually concise manner. Infographics are great for this. It’s much easier for people to digest information when text is coupled with an illustration — but if you’re trying to create an infographic, it’s hard to know which kind to use. And if you’re relaying hard data or statistics, it may be difficult to decide how best to organize that information visually.
What are the best types of charts for an infographic?
Luckily, there are all manners of charts and graphs in Easelly to choose for your infographic.
Here are a few tips for choosing the best charts and graphs for your needs.
A piece of the pie chart
A pie chart is arguably the most commonly known chart for infographics. If you have a simple piece of data to convey that can be broken down into percentages, this is a good way to go. However, if that data is all roughly the same percentage, a pie chart may not be the best option, as there isn’t enough of a striking difference in the “slices” of the pie.
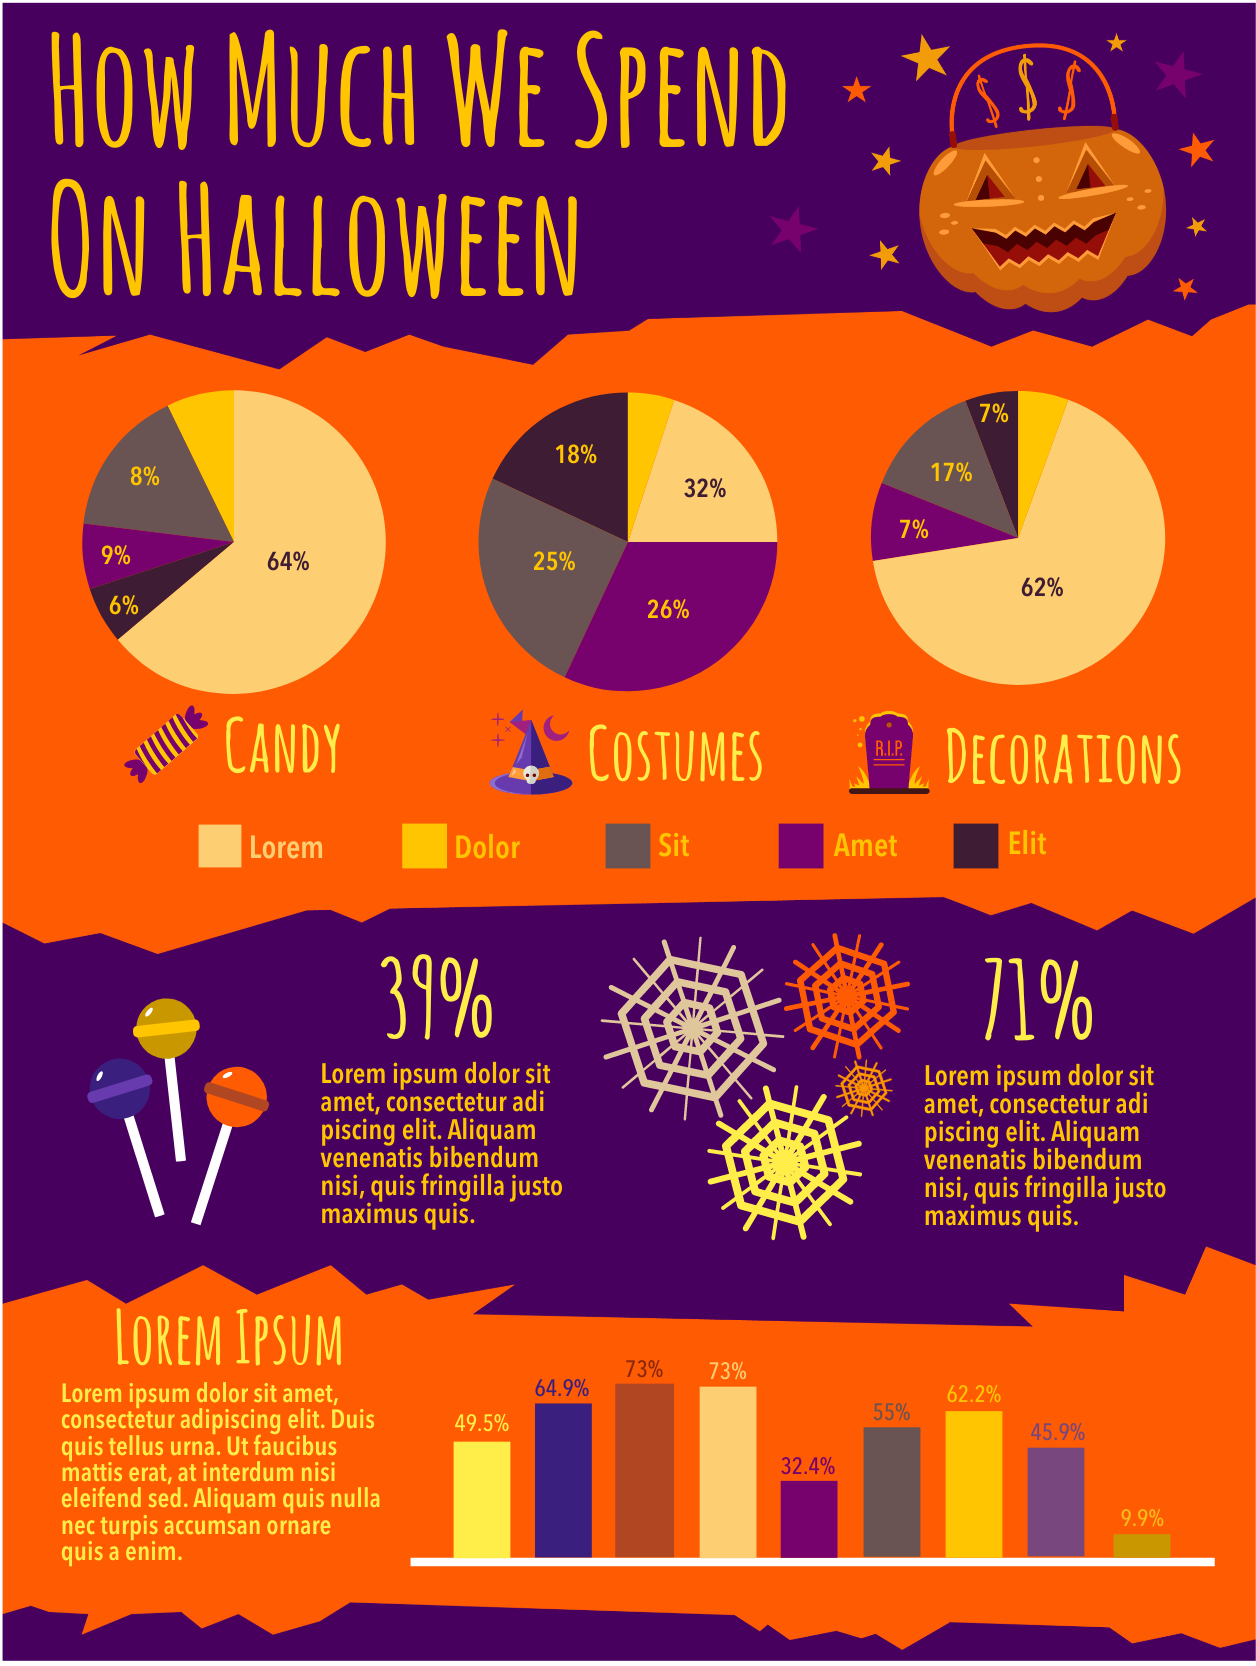
Customize this Halloween infographic
Meet you at the bar
When comparing two or more sets of data, a bar chart is a great choice. These can be presented horizontally or vertically and work very well when you want to visually contrast information, as the eye can easily interpret the different heights of the bars. Bar graphs are also a striking way to get people to remember information.
PRO TIP from our designers: Bar charts don’t have to be boring graphs! They can be icons representing the number of people/items in a data set, colored in icons, etc. Look at the image below. Not only are there “traditional” bars representing drug classifications, but also a horizontal “bar” with people icons. You can have fun with traditional bar charts for your infographics!

Customize this medical infographic
Lean on the column
Using column charts in an infographic is great for representing amounts like units of time and distance because they are presented horizontally. You could say that the only difference between bar charts and column charts is that vertical vs. horizontal difference and you’d be right on principle if not in practice. Column charts look good when comparing around five items at most. Beyond that, to avoid visual clutter a bar chart is better.
This image does a great job of using the many types of charts/graphs. The “Sales by Agent” section shows how a column chart can easily show sequential differences between
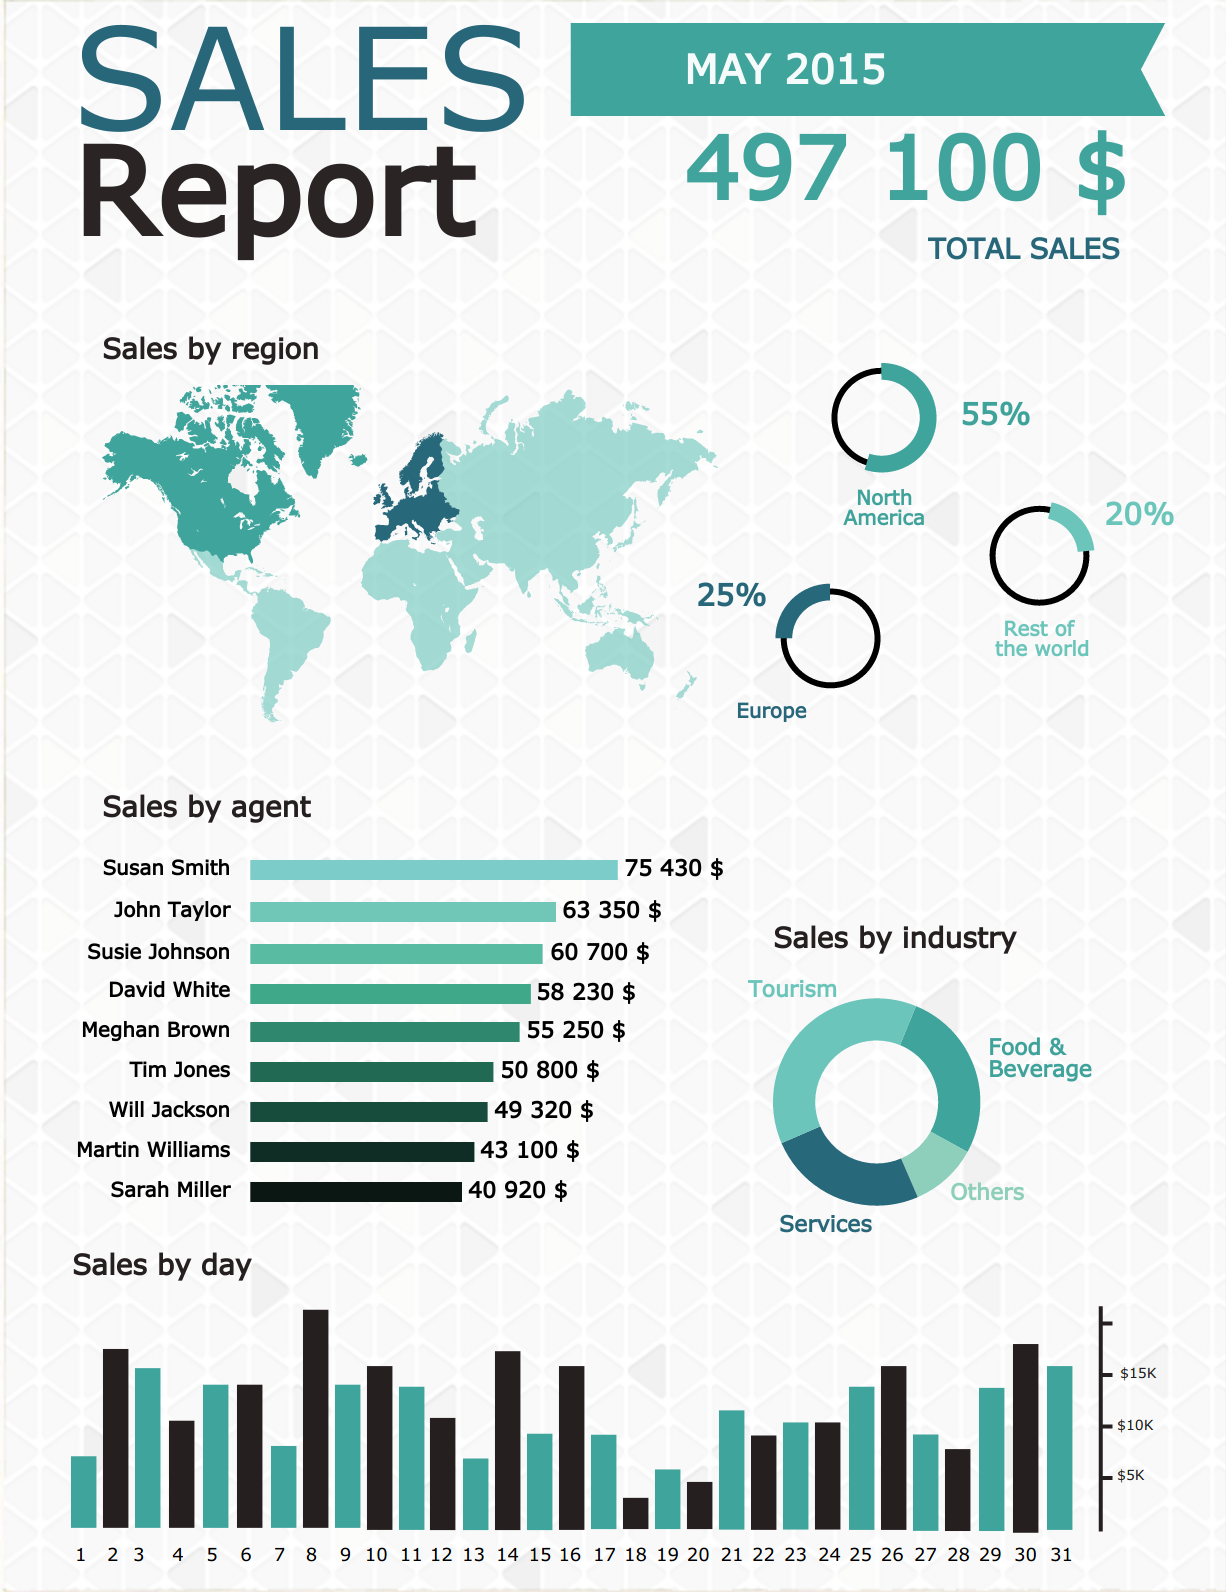
Customize this sales report infographic
The Great Pyramid
Choose a pyramid chart when the goal is to represent how data is related to one another. Think of the food pyramid most kids were taught in school. It laid a foundation of healthy eating but all lined up because the overall joining topic was food. Using the triangular shape and fun colors, a pyramid infographic imbues a sense of continuity about a topic.

Get in line
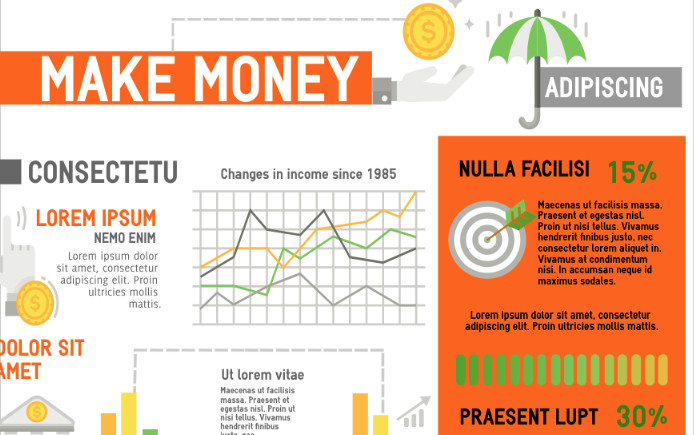
Line charts are a great way to show changing trends over time, as well as compare multiple data sets in the same view. For example, you can use line charts to show how much income has changed in the years since 1985, with different lines representing genders, races, or even geographical locations.
Which chart or graph is best for you?
Infographics are easily shared across multiple platforms and mediums, and they’re great at making news and ideas easier to digest and remember. Choosing the correct chart or graph for your infographic means considering the sort of message you would like your data to evoke in the viewer. Sometimes, you may need to play around with different infographic templates to see what feels right. Ultimately, the right chart will be one that is visually striking, memorable and concise – it’s up to you and your data to know which one works best.
Get started with our infographic maker tool and choose from our library of pre-designed infographic templates.