
The following post was written by Claire Roper of Zilchoo who managed to grow page views 3x by using infographics created through Easelly.
“Tell me, I forget. Show me, I remember. Involve me, I understand” – Chinese proverb
Images are paramount when engaging with any audience, allowing your followers to consume information in bite-sized pieces. Infographics can be your secret weapon, by using them you’ll be able to deliver ideas, thoughts, stories and marketing messages in a way your audience will find visually appealing.
Finding the Perfect Infographic Tool
I’d been searching for a long time to find an online tool which was able to quench my thirst for producing infographics to a high standard. My search is now finally over, I came across Easel.ly, signed up for free and now there is no stopping me.
To date I’ve created four infographics, Global Flip Flop Migration, A Quick Guide to Understanding the Kiwi Language, New Zealand Native Birds and How to kill Halloween Monster.
Creating infographics with Easel.ly was not only fun but as their snappy name suggests, easy. The user interface is extremely user-friendly, with simple drop and drag features and several handy built in images. Creating the Global Flip Flop Migration I used a pre-existing template, as I liked the image of the map, the other three infographics I created my own images and upload these directly into Easelly.
On the Move – Mobile Devices
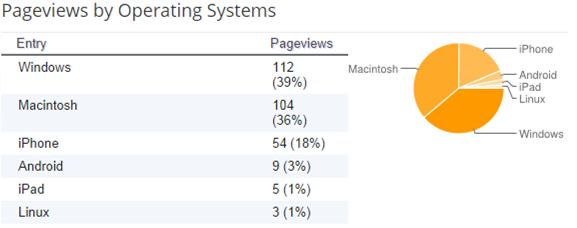
In creating the New Zealand Native Bird infograhic, I decided to use the mobile background option supported on Easel.ly, with the rise in the use of mobile devices increasing, this was a perfect choice to engage with my followers. As you can see in the graph below, taken from my blog statistics 30/10/2014, the rise of iphone, Android, ipad and Linux are 23% of my overall views, so catering for these followers is vital.
Results
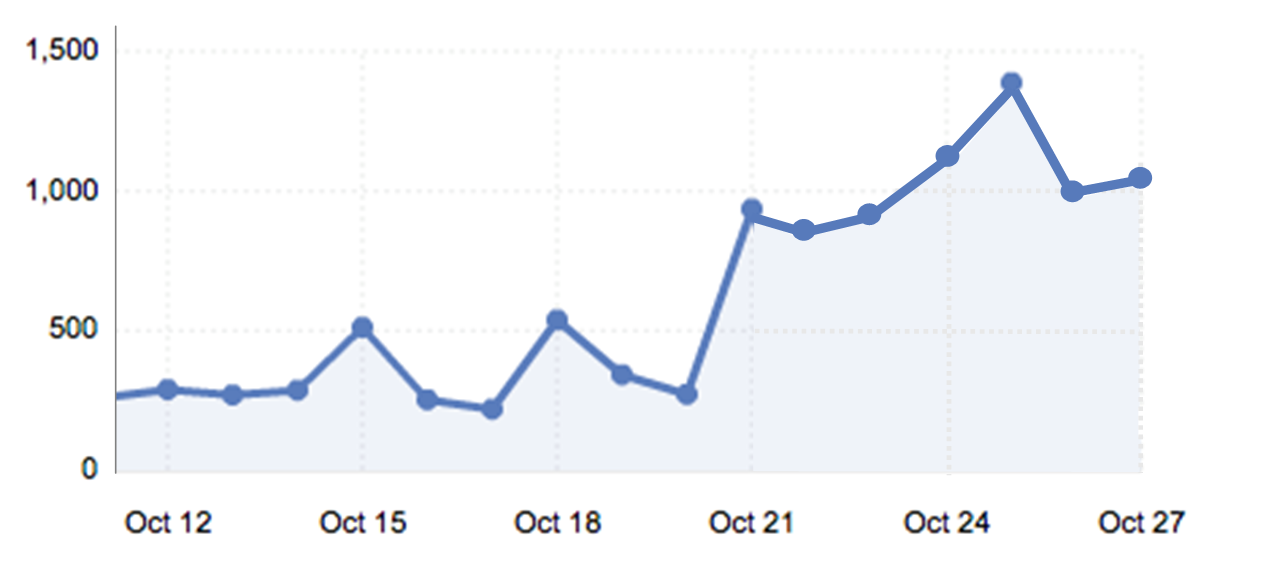
Of course, when it comes down to it, it’s the results which I was most interested in, and wouldn’t you know it, the results exceeded my expectations. Publishing infographics have seen my pageviews triple, as the graph below shows.
I’m thrilled and will be continuing to create Infographics using Easelly!
- Understanding the Kiwi Language
- New Zealand Native Birds
- Boo Halloween Monsters and How To Kill
- Global Jandal Migration
Feel free to contact us if you’d like to write a guest post for us!