
“Infopreneurs” are a new class of entrepreneurs providing their knowledge and expertise through e-books, email series, and e-courses.
As anyone who has ever designed, created, and launched an e-course will tell you, half the battle is coming up with great content that people just can’t resist (and will pay for). The other half of the battle is wrapping all that information up in a visually-dynamic and beautiful package, ready to deliver. These infopreneurs and their launch teams know the power of great graphic design and visual content when trying to get something like an e-course off the ground.
Once again, this sounds like a job for… (insert superhero music) Infographics!
How Infographics Attract Paying Subscribers
You know you need to have great fonts, color schemes, and even attractive worksheets or templates for your course students, but have you given much thought to the visual appeal of the information you provide?
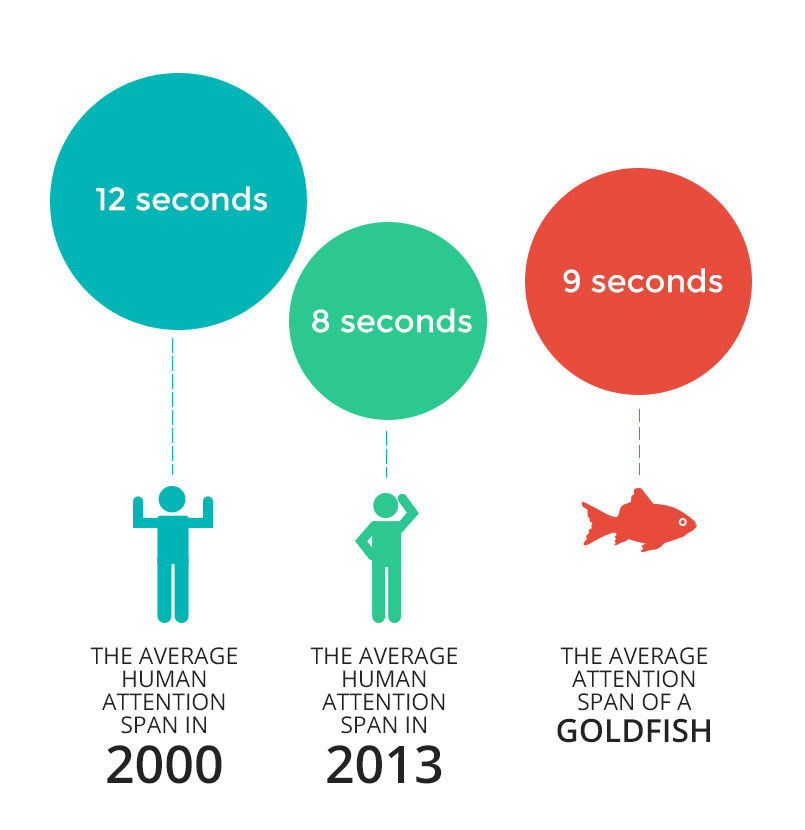
The average human attention span on any new website (no matter the content) is about 15 seconds, while some studies say our overall attention span is as low as 8 seconds. Naturally, interest is hopefully a bit higher in students who have paid for or are highly engaged in your materials, but those numbers are striking.
Are you wondering how you cut through this red tape with your e-course to make sure people are actually paying attention, absorbing the content, and then telling all their friends and family to hurry and sign up for the course, too?
Visuals Cut to the Chase (and Make You Smarter)
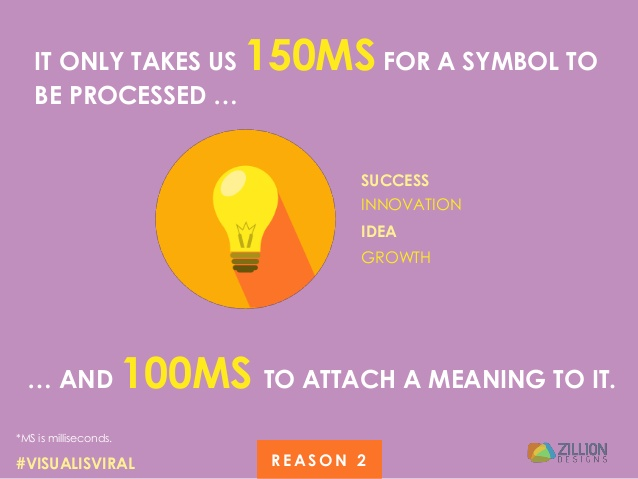
It takes about 250ms for a person’s brain to assign a value and interpret an image it sees. That means you’re well within that 8 to 15 second attention span window when you use something like an infographic to get the message across even faster. For your course, this may mean making a point with a single symbol or image, or drawing their attention to a set of information by using a colorful infographic.
People also report being 40% more engaged and more responsive when a visual piece of information is provided, rather than a piece of text. All of this is to say that your course participants, even before they sign up, will be interested in what you’ve got to say because you’ve shown them in a way that appeals to their brains.
Not only will your course participants be visually attracted to your images, but they will also absorb and retain nearly 65% of the information, as opposed to only 10% of what they read through text. This means they will spend less time engaging with your material but more time learning from it, which is what they’re paying for after all!
Infographics Activate Emotion (and Action)
Another often overlooked aspect of infographics is their ability to tie a call to action, information/data, and bright colors together. Any resource that can do this is a highly valuable one because it appeals to the rational and emotional centers of the brain.
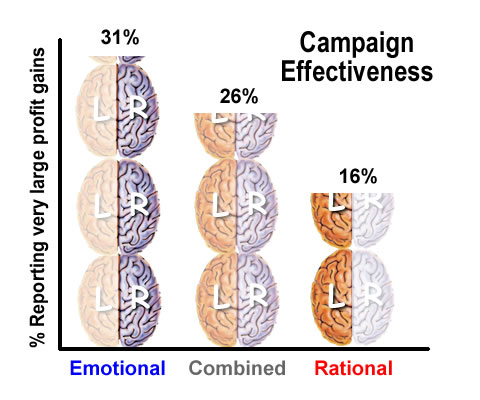
Emotions are strongly tied to images, as anyone who has seen anti-drug or animal abuse ad campaigns can attest. You’re selling information, yes, but what will make it sell is by appealing to the visual centers of the brain that trigger a person’s desire to act.
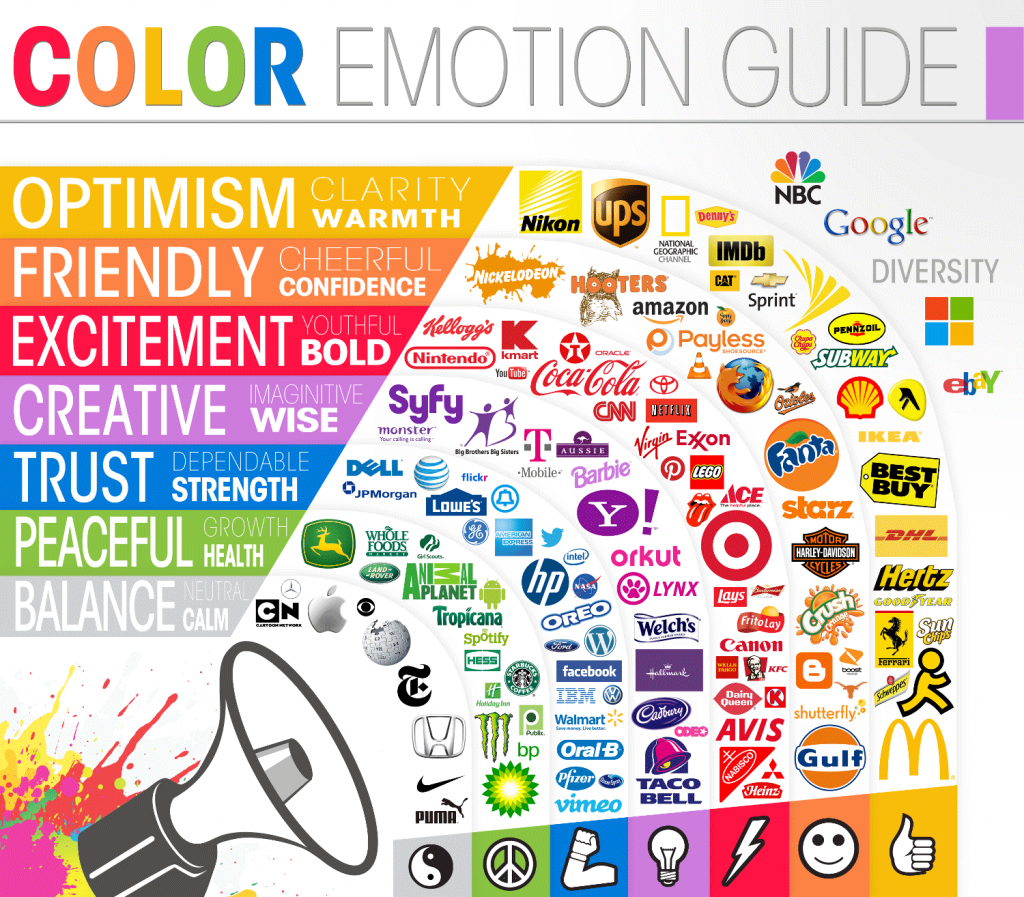
And while a lot of this depends on what your infographics show, it’s also a reflection of the power of colors. There has been plenty of study on the effect that colors have on emotions, and within your e-course, color is (hopefully) a major determining factor in design.
With the right color and a thought-out set of data, your infographic can give your students the excitement to continue with the course, the trust to learn from your content, and can encourage them to let their creativity flow. All it takes is a commitment to creating quality, colorful infographics.
It’s Not Just a Way to Help Students Learn
The great part about infographics is that they are downright versatile. You won’t be able to find another piece of content that can be used in so many different ways, on so many different platforms. When you use the right infographic creation tools (like Easel.ly), you can create .jpeg or PDF files, but you can also embed links and URLs that allow you to create video infographics or shareable images. You can use infographics in your course modules themselves, yes, but there are many more ways to “get your money’s worth.”
This means that, when you create an infographic for your e-course, you can include it as part of the marketing campaign you use prior to launch, or as a social media/email link to get people to sign up for your course. You can also use infographics as printable resources for your students, or as video tutorials within the course. Some people even include them in their advertising banners! The options are endless. Could you do all that with text? Not with the same results!
“I don’t think I can use infographics in my e-course.”
Are you worried that infographics just aren’t a good fit for your e-course or your audience?
Odds are, you have a different (and more narrow) definition of what an infographic is. There are tons of different templates (timelines, charts/graphs, and pre-made Vhemes that cover just about every subject) on Easelly, and you can make an infographic as simple or detailed as you like.
Instead of finding stock photos that don’t really match your message or don’t look all that great, create images that relate to your content and drive the point home. Boost your fantastic content for your e-course when you use infographics; your students will love saving the images for future reference and you’ll love how many times you can use the same piece over and over!
Why not have a marketing and teaching tool all wrapped in one? Start creating infographics for your e-course today, and notice happier students, increased registration, and even clearer content!
Have you used infographics in your e-courses? Are you going to start? Let us know in the comments or share your story via Twitter.