Editor’s Note: This is a guest post by Dr. Samantha Fecich, Ms. Alicia Vanderhoof, & Mr. Derek Witmer
What is Easelly?
At times as an instructor, it is necessary to display information in creative ways. For instance, a teacher can document factual information through infographics. Easelly is a tool that can be used to create infographics. This technology tool allows an instructor to add pictures and symbols as well as graphs and charts to present information in a bright and colorful format.
Tech class project
Students selected an educational topic, some examples include:
- Topics related to a student’s home environment
- Poverty
- Child abuse
- Divorce and effects on education
- Teen media use
- Education related issues
- Graduation/dropout rates
- Literacy outcomes
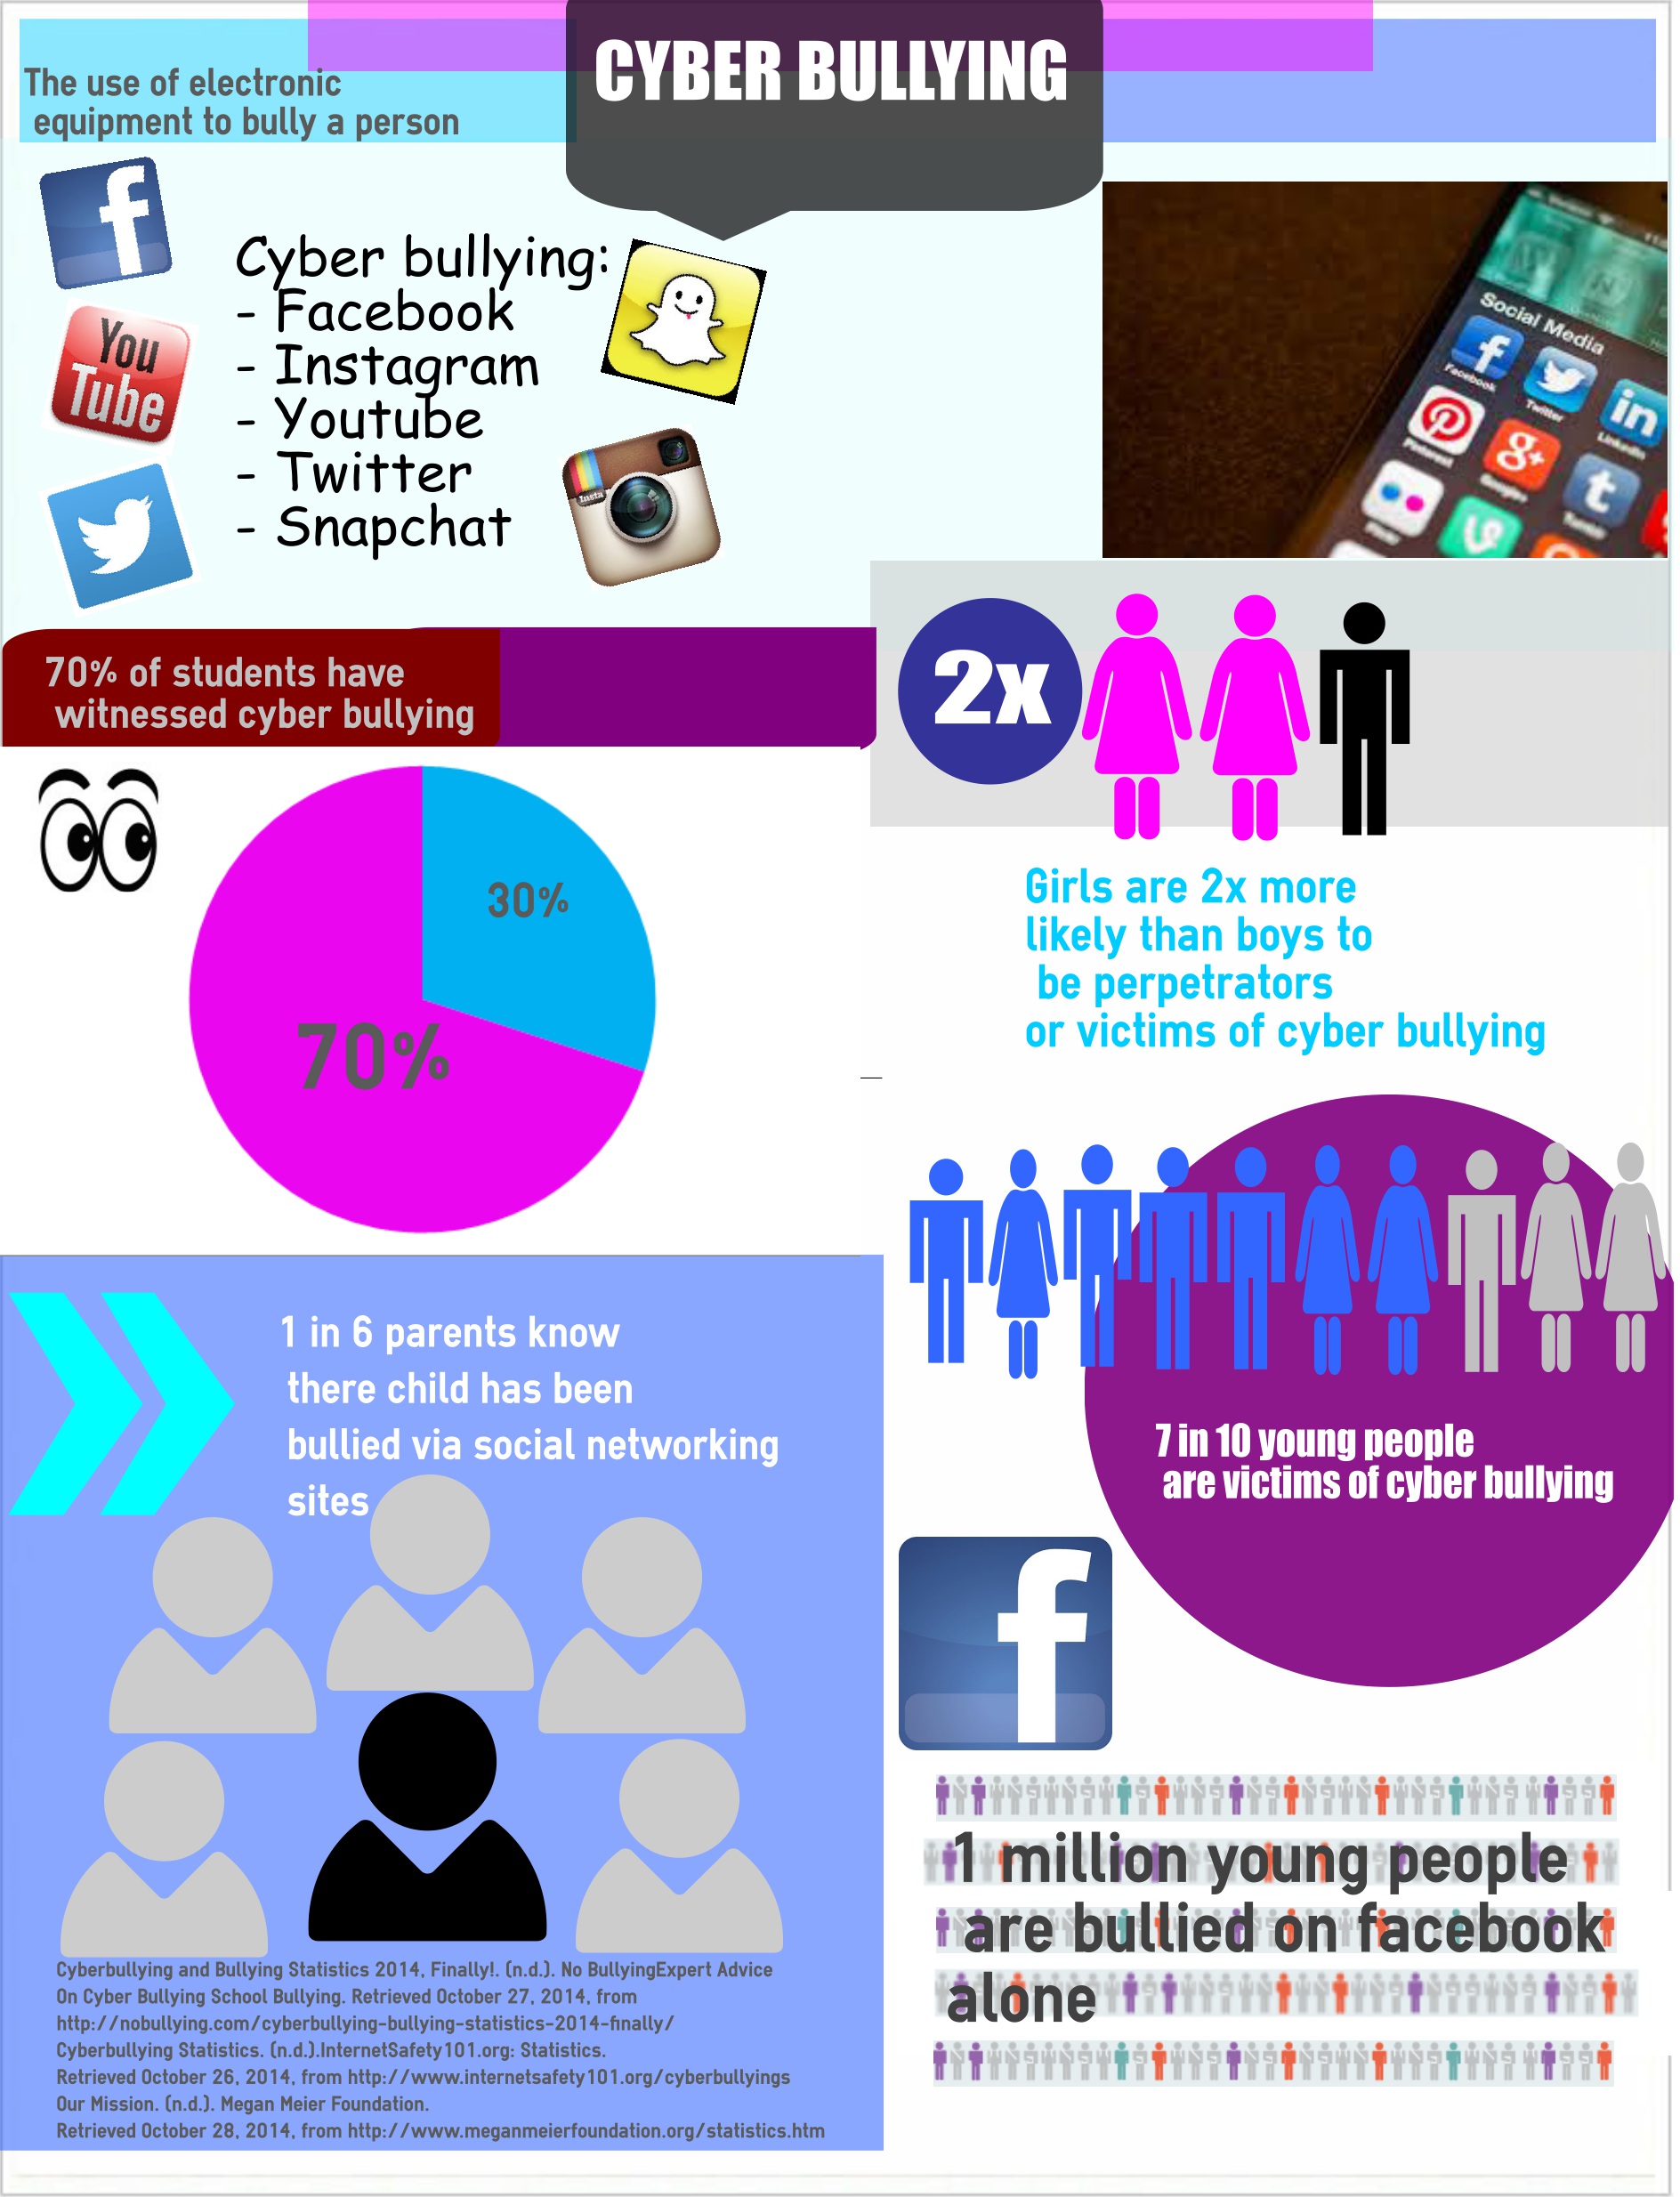
- Bullying and cyberbullying
- Plagiarism/cheating statistics for high school and middle school students
- Gender segregation in educational settings
- Students with special needs (Autism, Down syndrome, English Language)
- Students used Easelly to create an infographic for a subject area of their choice.
- Students were required to identify and display 5 facts about their topic in a visual manner.
- They were also required cite their resources and images (if not used from the gallery in easel.ly).
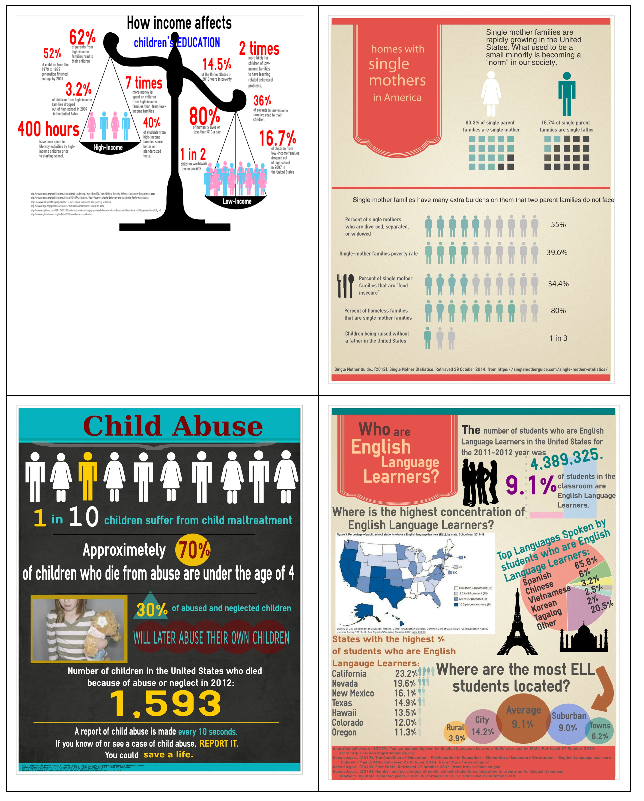
Here are some examples of infographics by students:
Student’s reflections on using Easelly:
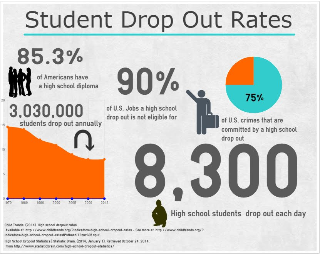
“Here is the Infographic I made for class. It was to present the information on student dropouts. As an education major, I will be using Easel.ly in my future classroom. Being that it is so easy to use and understand, I will be able to make posters for my classroom presenting classroom rules and procedures as well as other types of posters to hang around my classroom.”
-Derek Witmer (PreK-4th Major)
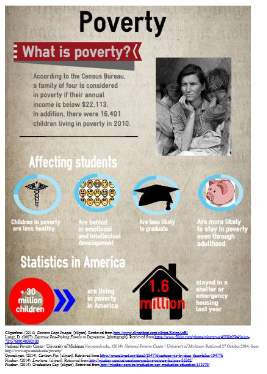
“The infographic two of my classmates and I created was about poverty and how it affected education. With Easelly, a teacher can clearly and creatively present a topic with pictures, graphics, statistics, colors and more. This can be used in the classroom to encourage learning and creativity, and also to communicate with parents and the entire school when reflecting on what the students accomplished or announcing an upcoming event. I had a lot of fun creating with Easelly and highly encourage teachers to use this tool for their classes.”
-Alicia VanDerhoof (Middle-Level Major)
How to integrate Easelly in the classroom
PreK-4
- Post classroom rules
- Roles for groups members
- Daily activities-for smooth transitions
- Expectations for the year
- Promote class event to families and entire school
- Job chart (paper passer, pencil sharpener, line leader, etc)
- Create a timeline of historical events in a history class.
Middle/Highschool
- Assign student to make infographic about a research topic
- Follow and map out a book’s plot
- Promote a school event or club by making a poster
- Display statistics in a visually appealing way
——
Done creating infographics with your students? Share it with us on Facebook and Twitter. We can’t wait to see!