Printing Your Infographic
“How do I print my infographic?” is one of the most frequently asked questions we get here at Easel.ly. Because of that, we’re going to highlight how you can print your infographic step-by-step. We’ll provide directions for printing from your office or home computer and through third parties like Office Depot or other printing companies.
Downloading your infographic for printing:
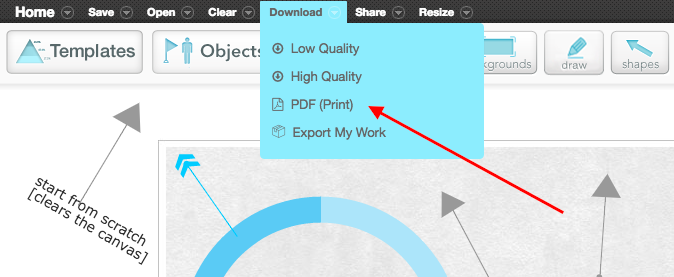
The first step is download your infographic as a PDF – see below:
What you need to know about printing with Easel.ly:
- PNG VS PDF Printing
If you want to print an infographic, it’s important to know that it’s easier to print a high quality PDF image than it is to print a PNG. To print your infographic, please download your infographic as a PDF then open your PDF once downloaded. From there, use the printing options on your computer.
If you’re going to use a third party for printing, they also prefer to use PDF rather than PNG because they have more flexibility in terms of print sizing and quality.
- Printing your PDF
When you print your infographic, make sure and select “Scale to fit” within your printing options. This will scale down the image to fit perfectly onto your 8.5 x 11 page.
- 96DPI vs 300DPI
DPI (dots per inch) is the indication of the image’s resolution when it prints. The vast majority of time, you won’t need an infographic that is 300DPI, so the default is set to 96DPI. We have tested this by printing some of the most complex infographics at both 96 and 300DPI – they were very close to being identical.
If you’re using a normal office or home printer, you won’t be able to tell the difference. If you’re using a company like Office Depot, you have to look really hard to notice the difference, as most professionals will use high definition printers.
Using 96DPI also keeps the file size smaller, meaning you can email the infographic to your local printer and share with friends easier. Changing it to 300DPI will grow the infographic 15 to 20 times larger and the file size will be too large to use!
Why does my infographic still not look great when I print it?
If you’re using the images and templates that Easel.ly has provided, your infographic will look great once you print it. This is because we use SVG (Scalable Vector Graphics) and each PDF is constructed to leverage this technology.
The only reason something wouldn’t look great is if you’ve uploaded low resolution images. Keep in mind that you need to upload the best quality images you can find.
Help! There’s a white border around my infographic!
If there is a white border around your infographic, this is more to do with the printer (all office, home, and art printers will have this issue) than the infographic. If you get your infographic printed at your local Office Depot or other printing company, you can ask them to scale the image to remove as much of the border as possible, but there will still be a very small border.
The only way to remove this border is to do “Full Bleed Printing,” which probably isn’t going to be available at your local printing store. If you ask your local printing company, they can remove the white border by cutting the paper. You can do this at home, as well.
Why aren’t there crop or bleed marks?
If you’re used to crop or bleed marks (lines marking where the print stops but the design continues), you’ll notice that your Easel.ly infographics don’t have these. Simply put, we don’t believe you really need them.
In 4 years, we’ve only been asked a handful of times for them, and your printer will be able to trim your border very accurately without them. Printer manufacturers have it down to a science!
Note: We hope that this article was helpful! If you have any questions, you can contact us at support@easel.ly. We will do our best to answer any questions you have.