
We had a ton of fun with all of the great people who engaged us today on Twitter. The #NYCSchoolsTechChat raised a lot of important questions about how infographics can impact education.
Since we know things get a little crazy during a Twitter chat, we created this resource for all of you so you can find everything in one place easily (get it?).
What are types of #infographics you might use in your school?
We loved seeing all of the examples that educators shared on the Twitter chat. In case you’re just starting out with your infographic lesson planning, here are a few basic infographic types we see in classrooms:
- A List infographic supports a claim through a series of steps. It is best used to support a specific claim or process.
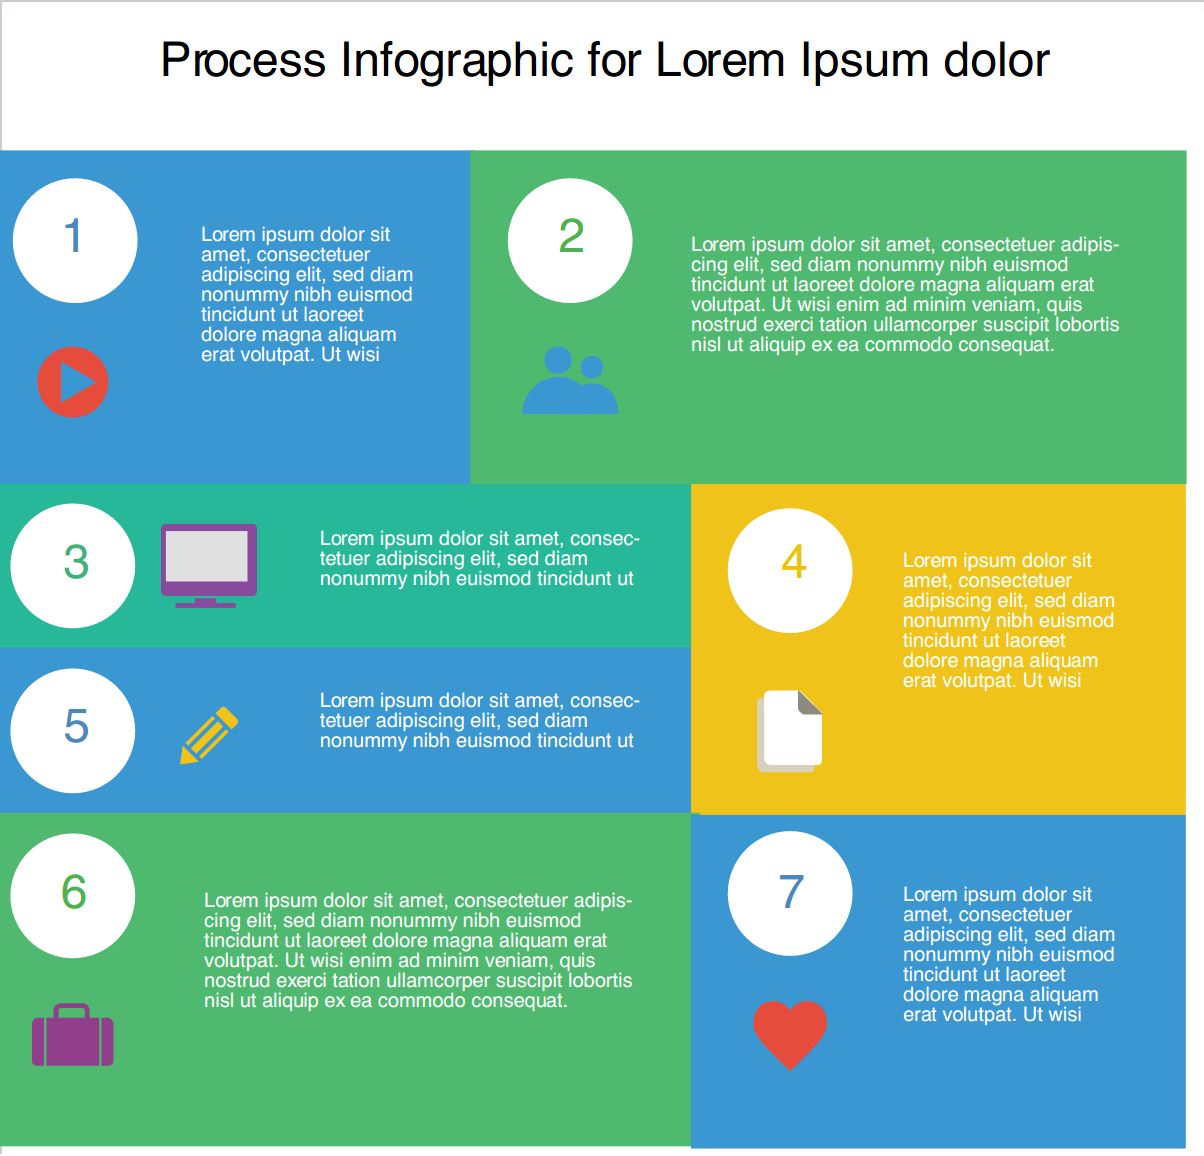 https://www.easel.ly/infographic/zx80wt
- Comparison infographics show differences between 2 similar things or similarities between 2 unlike things.
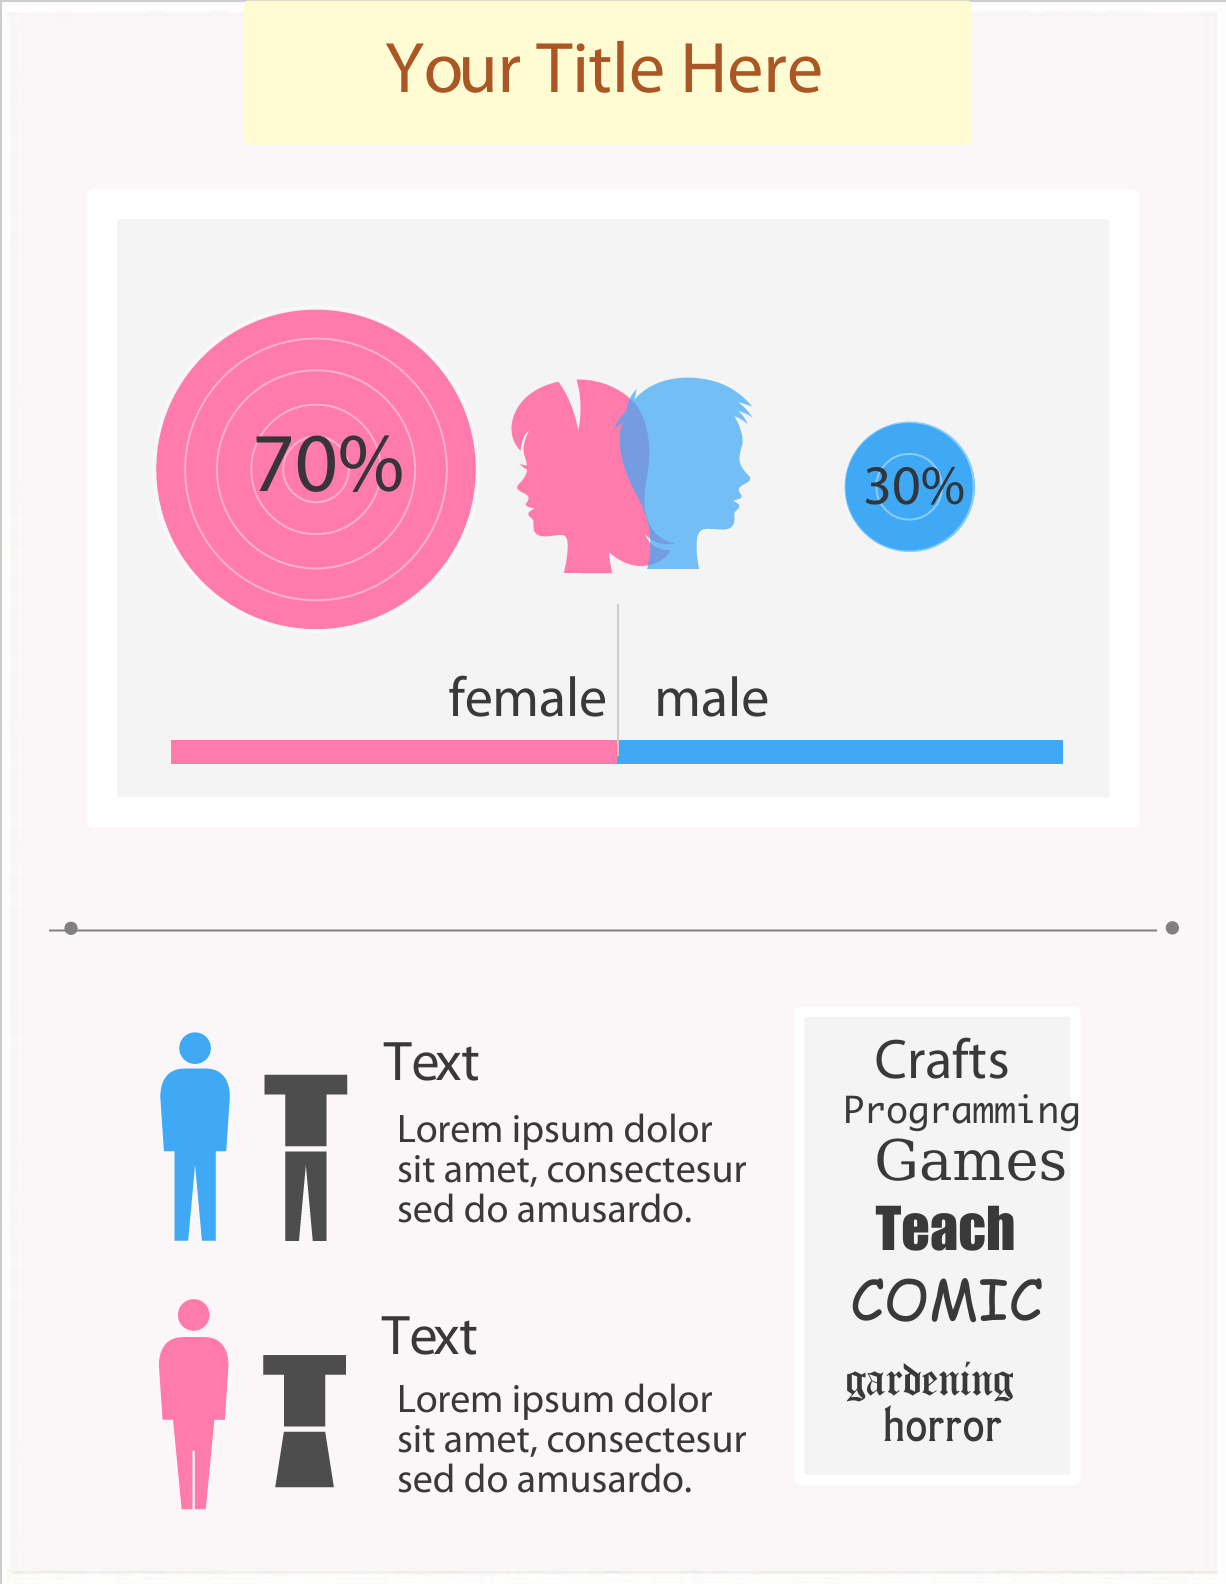
https://www.easel.ly/infographic/7xb3po
- Flow Chart infographics provide answers to choices; shows how multiple situations can reach the same conclusion.
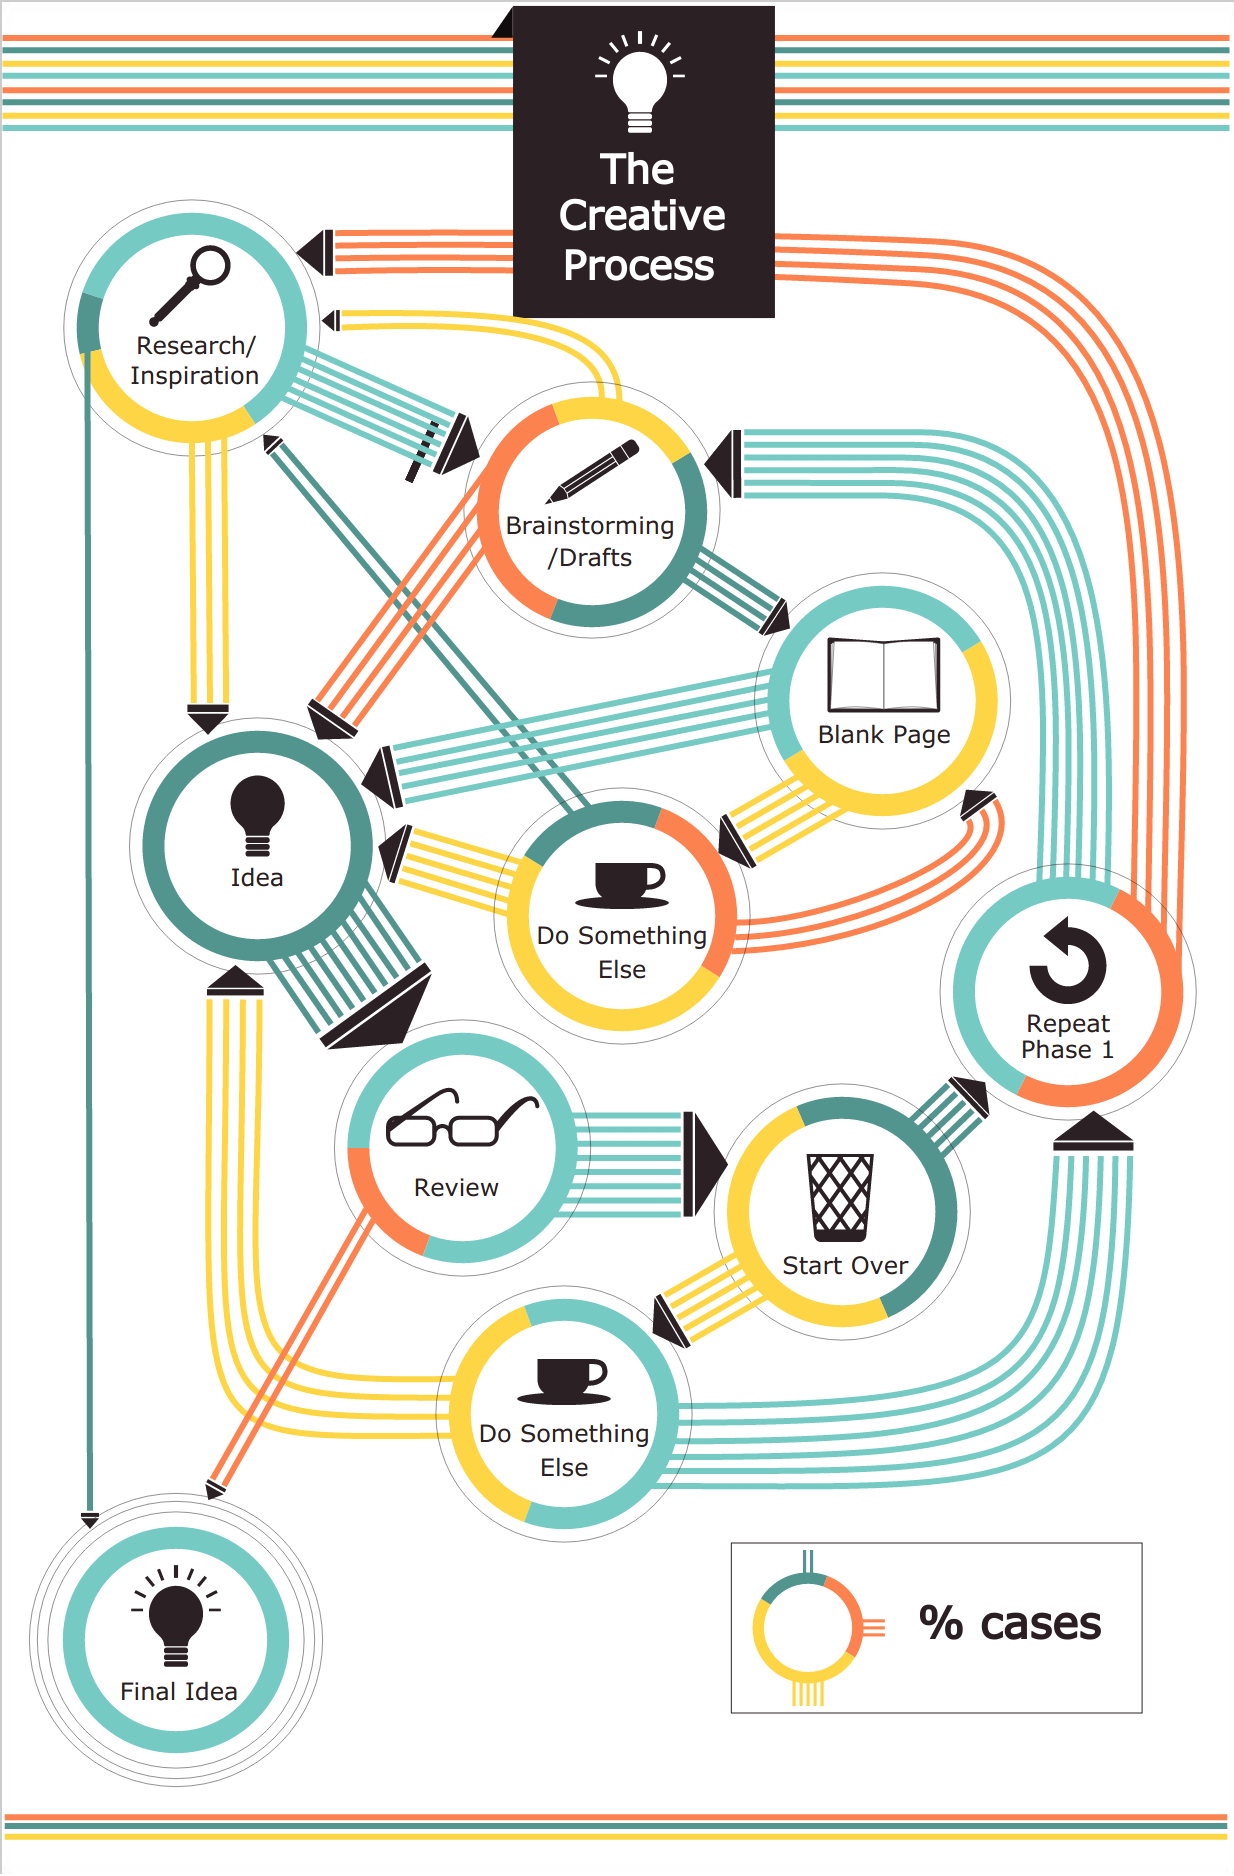 https://www.easel.ly/infographic/zai3ea
- A Visual Article infographic makes writing more visual, more interesting, and enjoyable. Many teachers can use this idea to have students create a comprehensive picture of one unit, story, or subject.
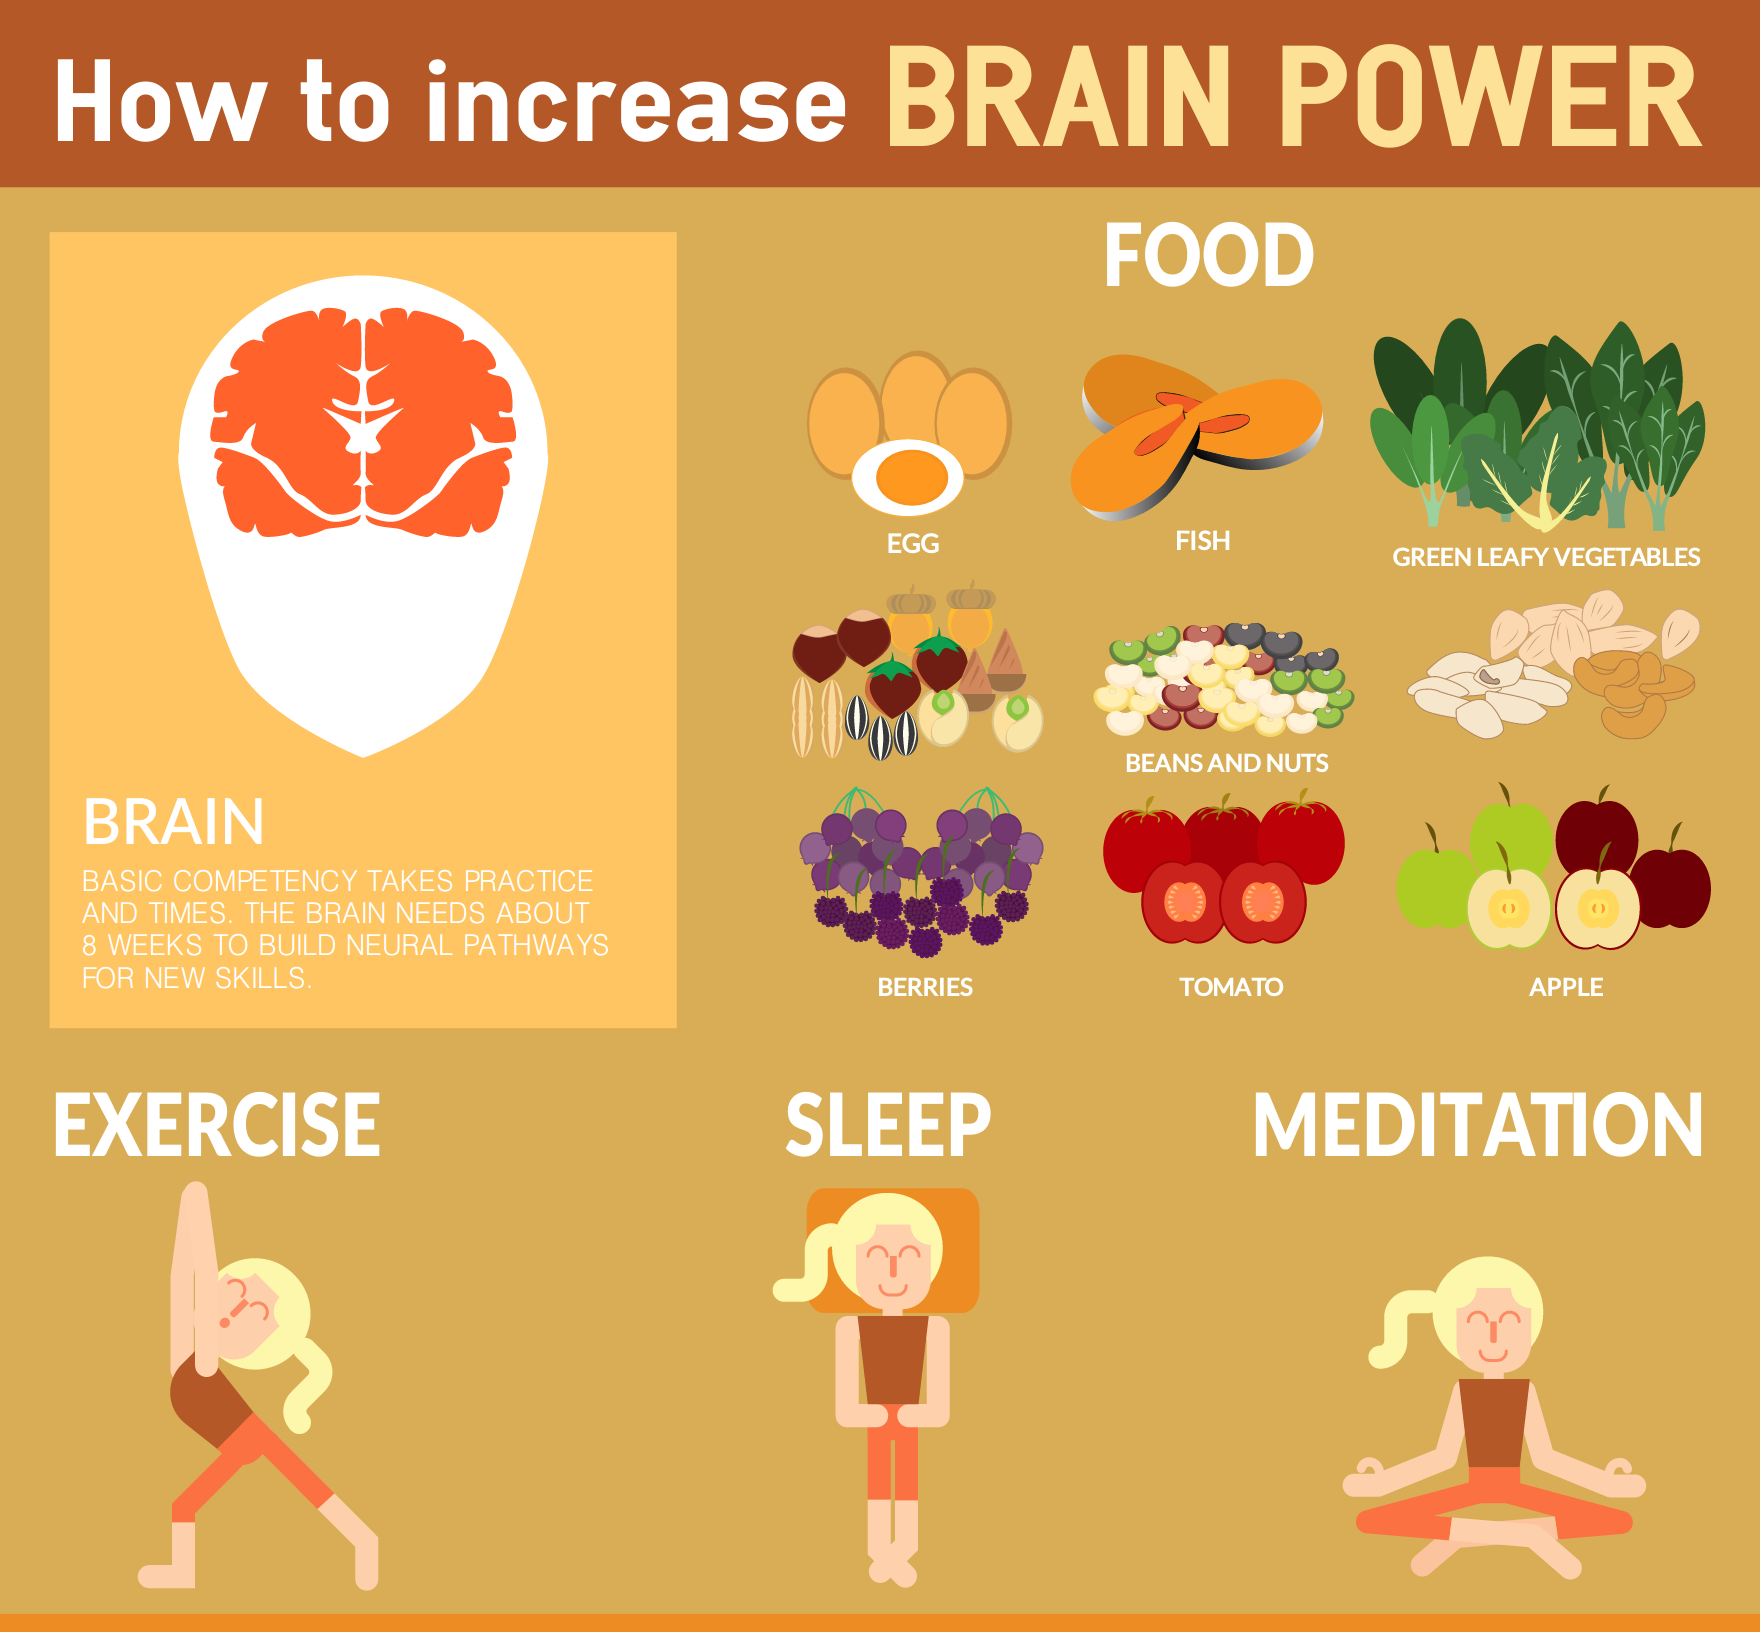
https://www.easel.ly/infographic/5qex7v
- The Map Infographic showcases data trends based on location and geography. Use a Map infographic to compare places, culture, and people through data & demographics.
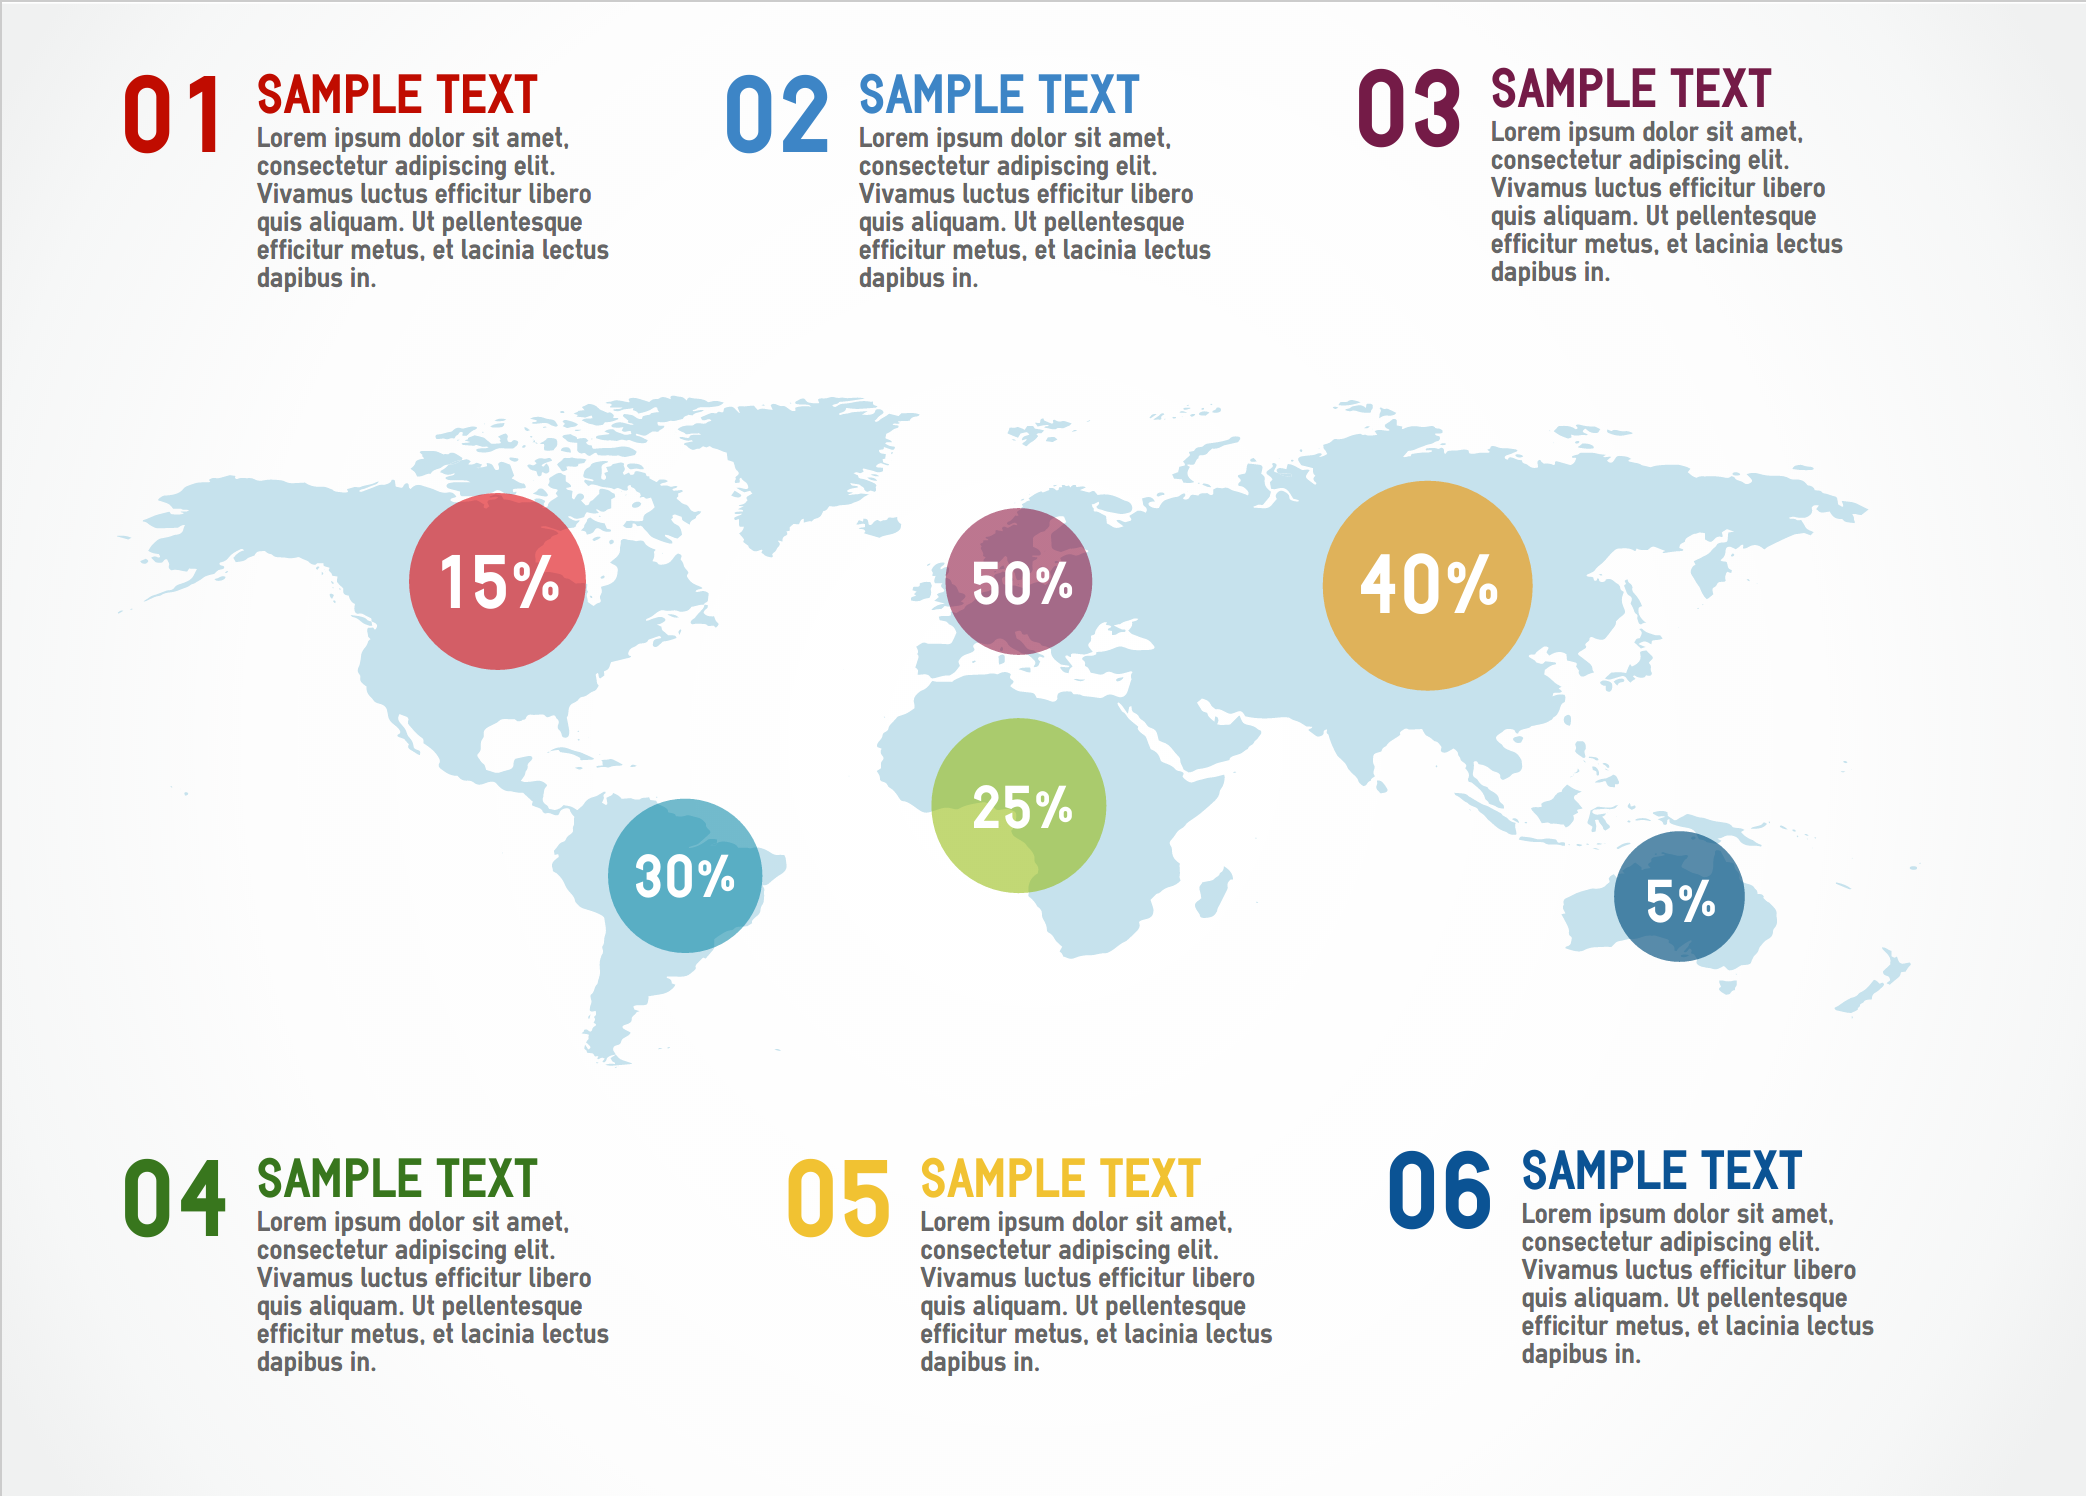
https://www.easel.ly/infographic/zx80wt
- A Timeline infographic tells a story through chronology. Use a Timeline infographic to highlight events, change over time, or make a long story easier to understand.
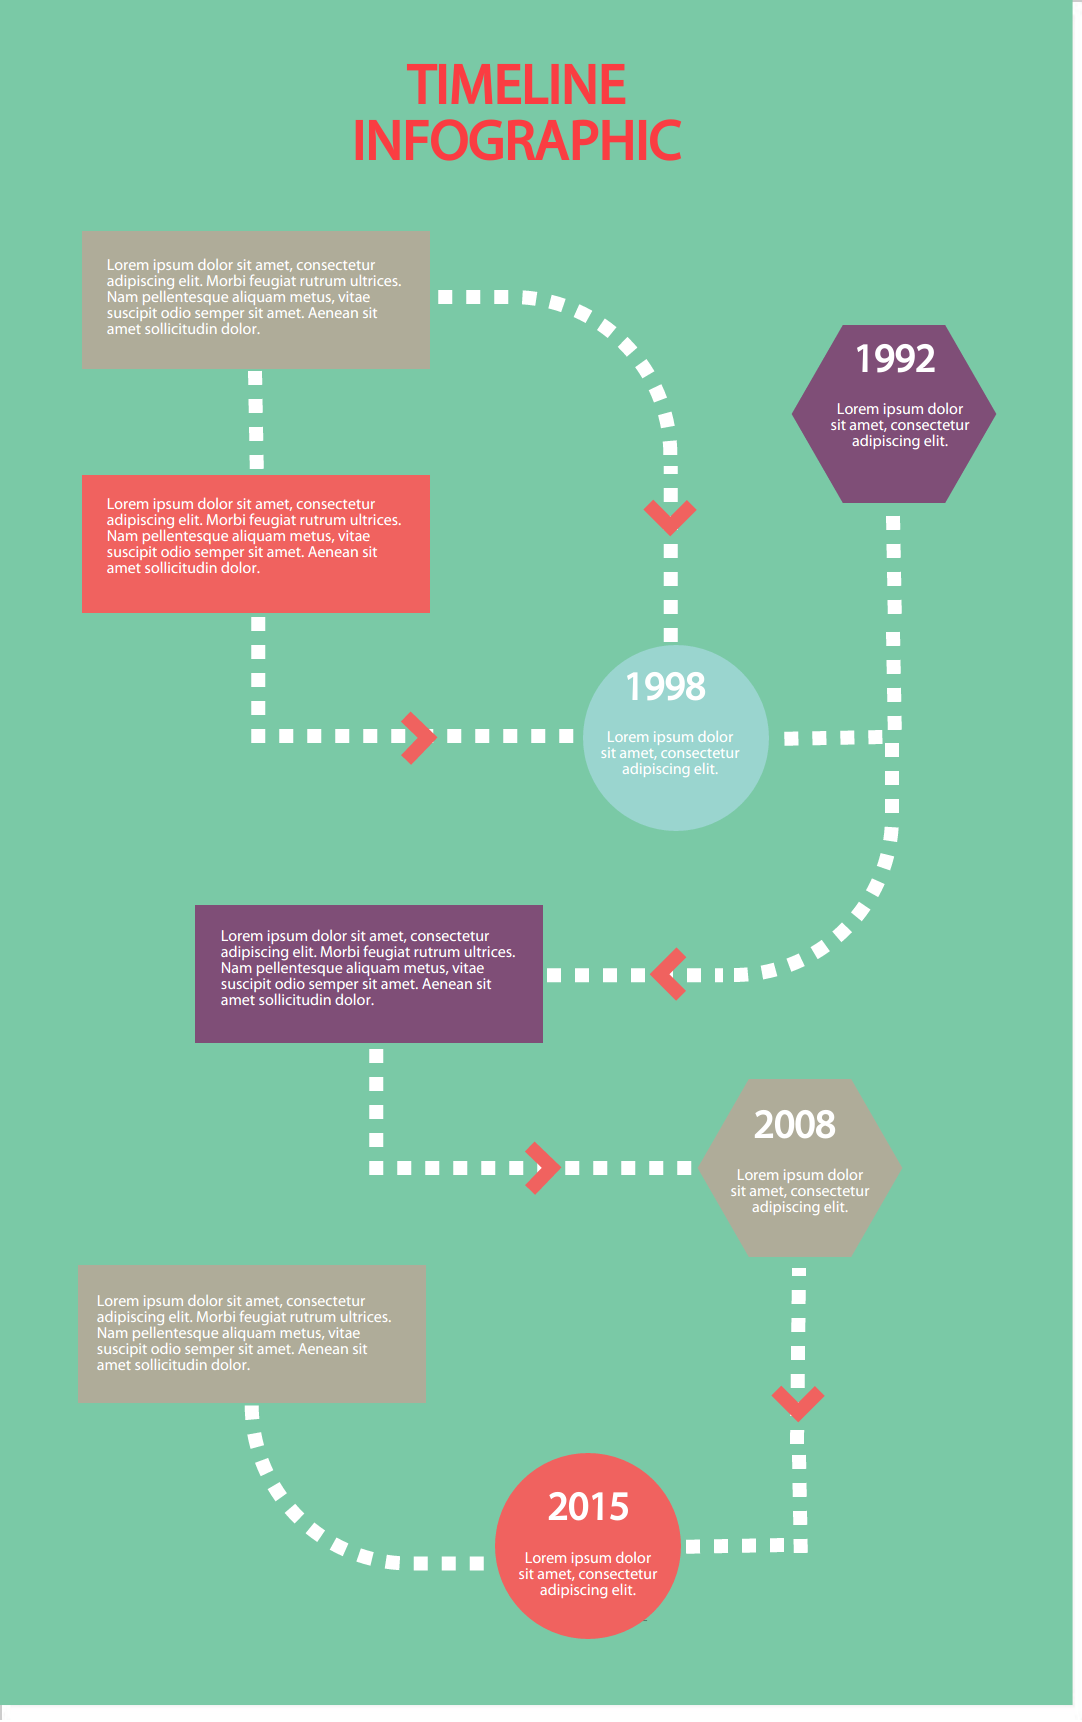
https://www.easel.ly/infographic/595jl1
- The Data Visualization infographic communicates data through charts & graphs. Use a Data Visualization infographic to make facts or stats easier to absorb through visuals.
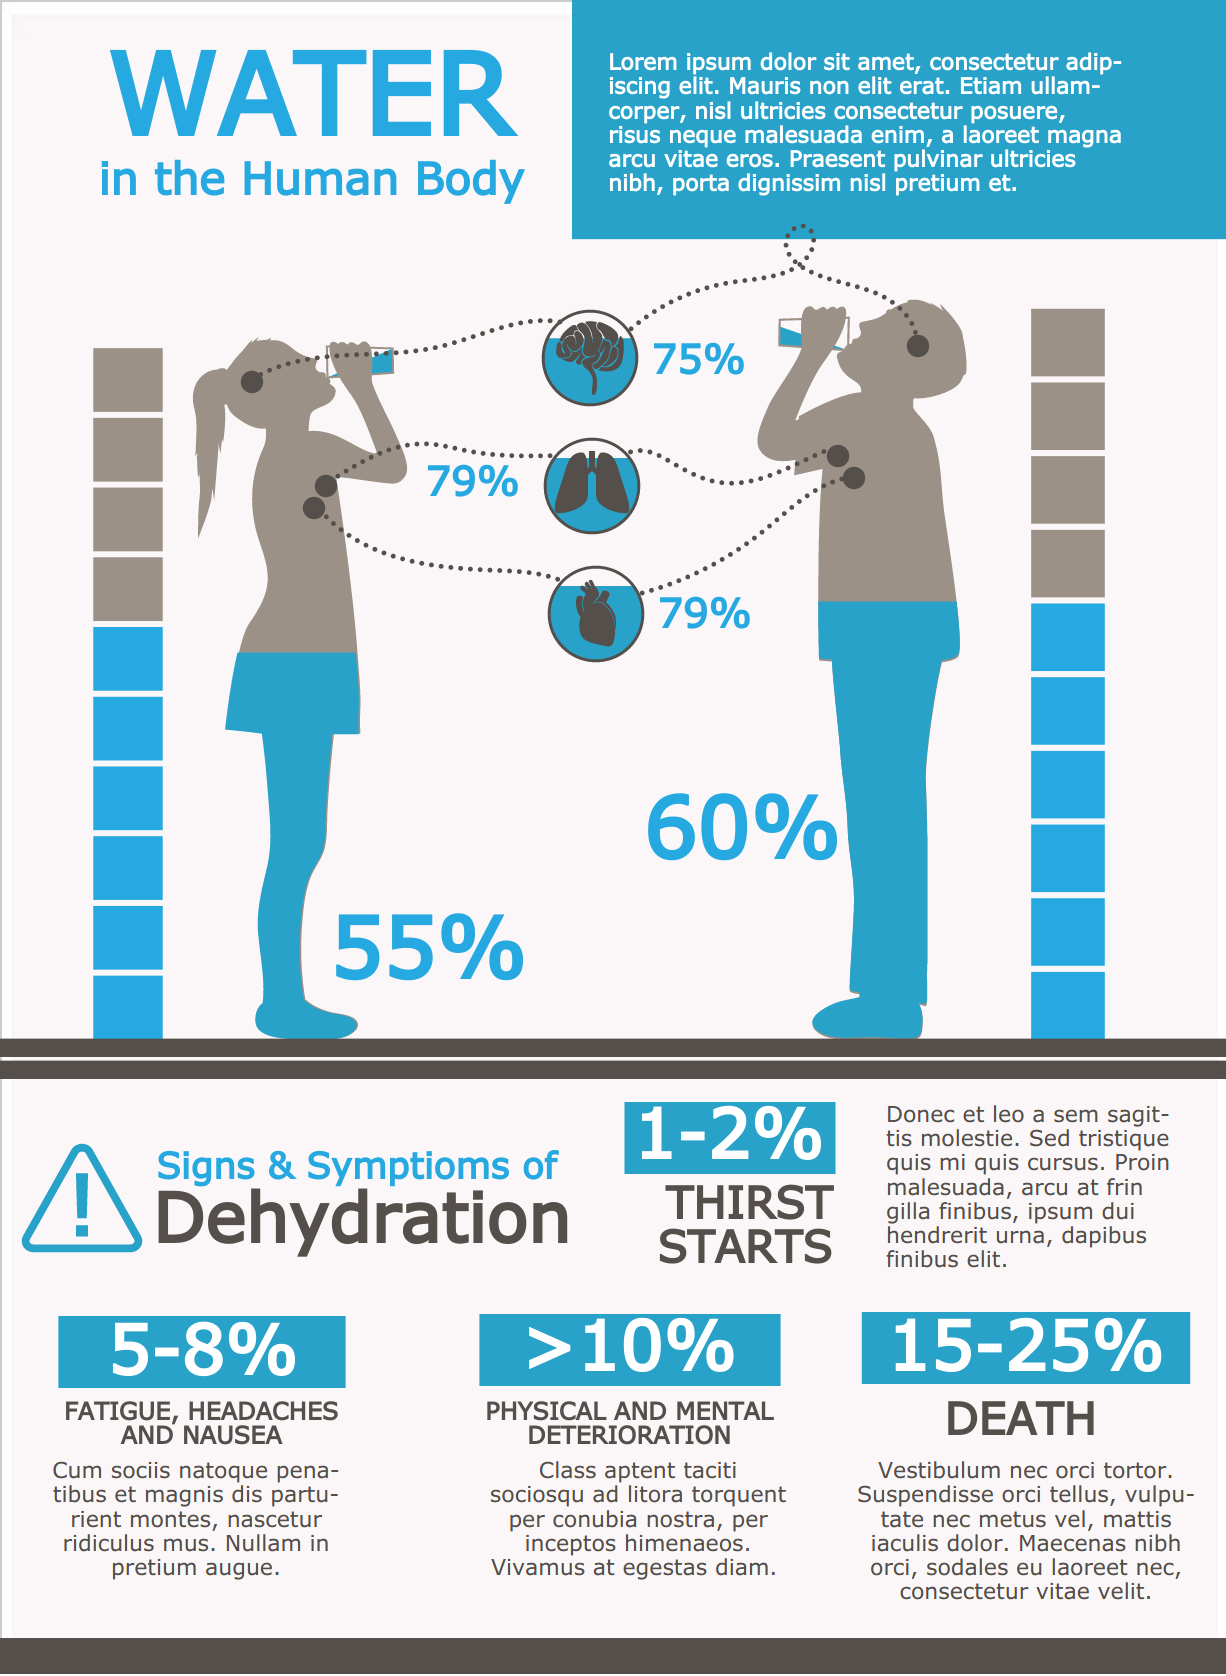
https://www.easel.ly/infographic/pb7egn
- Photo Infographics use photos to visualize a story or information. Use Photo Infographics to answer questions, guide readers, or explain something using real photos.
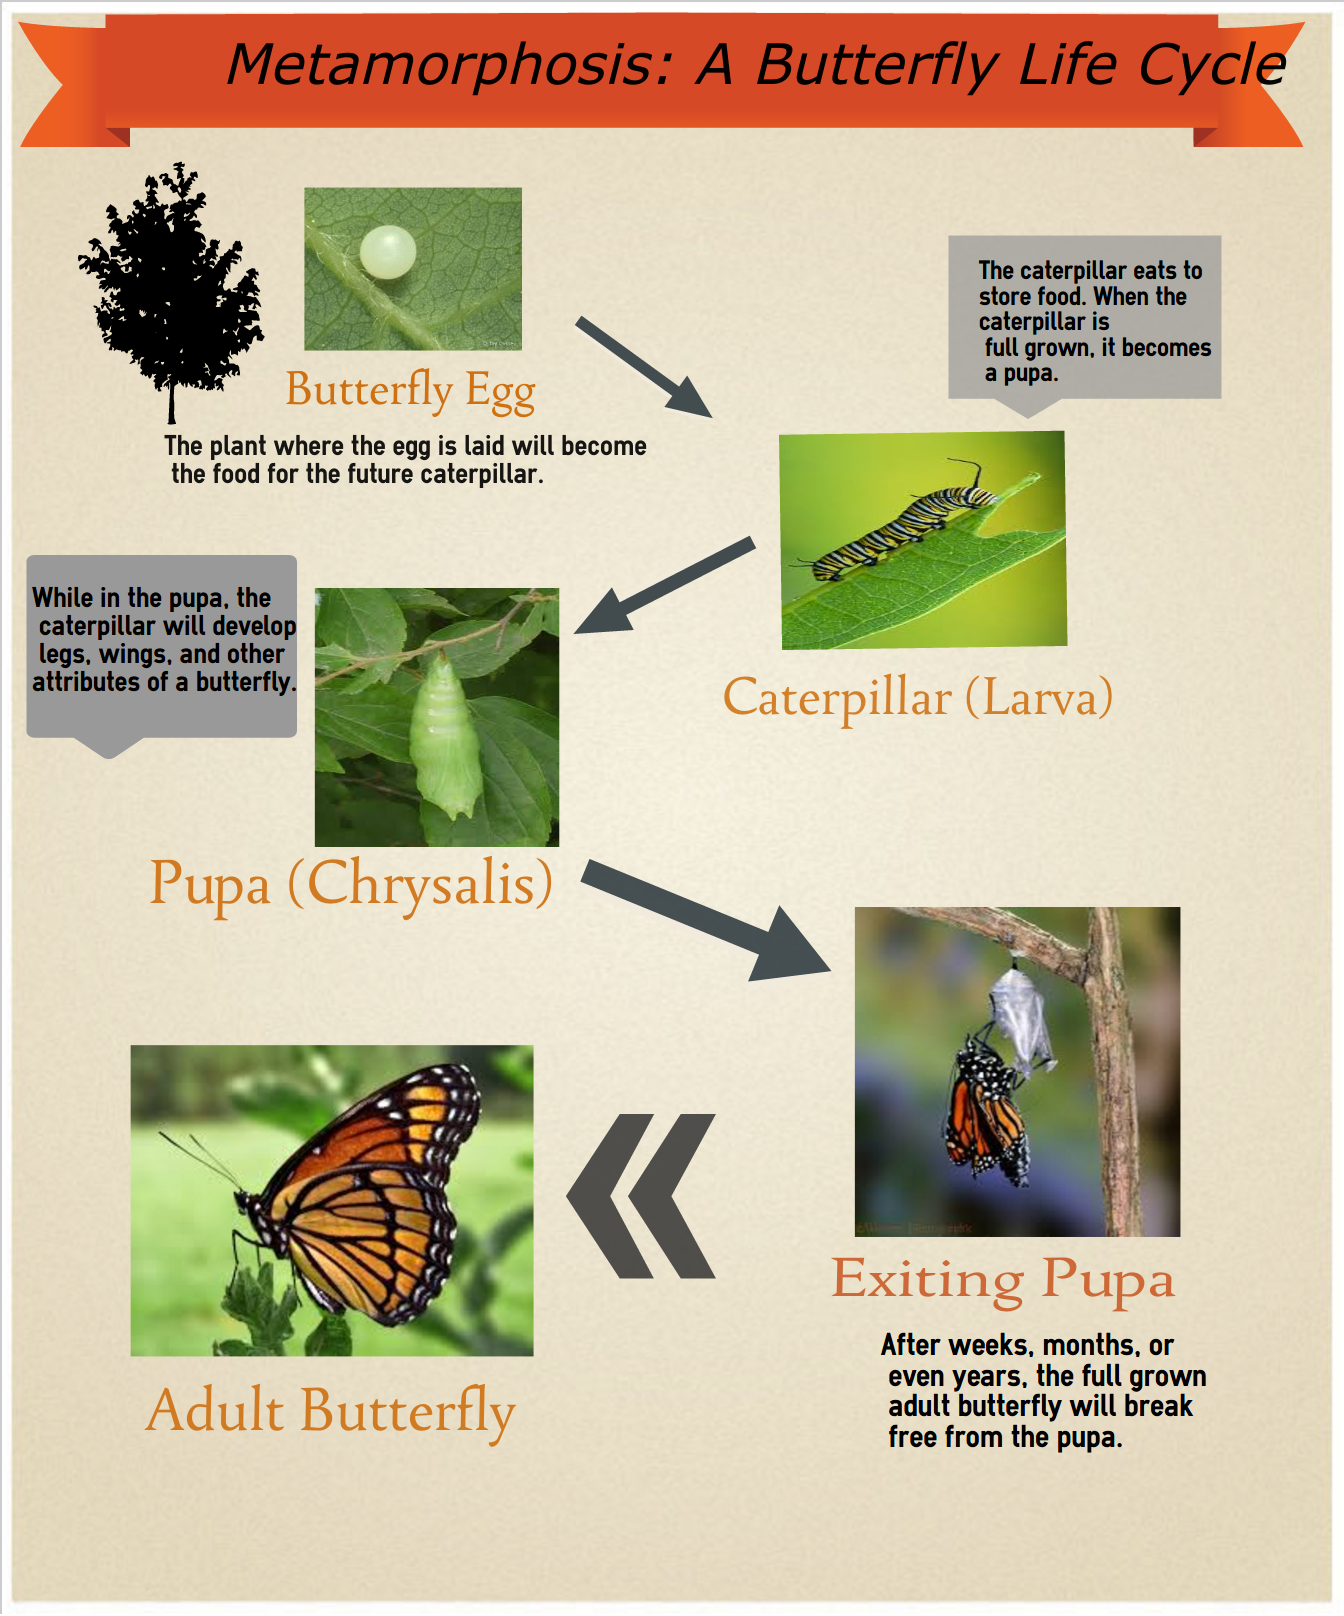 https://www.easel.ly/infographic/j2sa5c
And for brief visual review of our 7 Common Types of Infographics, this video: https://youtu.be/A6_7zC0mB9w.
Why are #infographics an effective tool to support student learning?
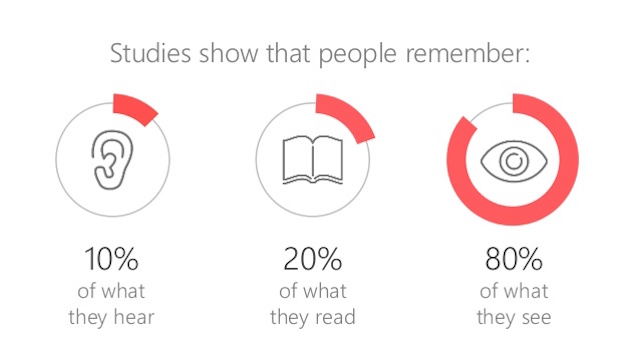
Humans are visual creatures and visuals improve learning by up to 400%! We can process visuals 60,000 times faster than text and the average person only remembers about a fifth of what they hear. Most students (about 65%) are visual learners, which means using infographics to relay information is a very powerful (and effective) teaching tool.
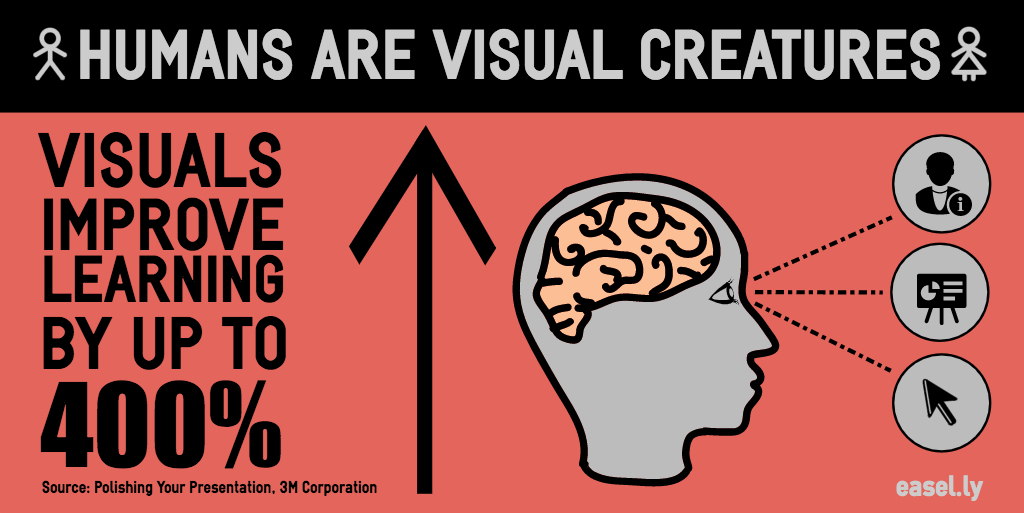
Source: Polishing Your Presentation: http://3rd-force.org/pubs/meetingguide_pres.pdf
What are positive results from having students create infographics?
If you’ve ever used infographics to teach a subject (odds are, you have!), you know the visuals often drive the point home better than simply reading about it or hearing the teacher talk about it.
Infographics let students:
- Think critically about a subject, data set, or complex idea
- Reiterate and reuse information in dynamic ways
- Meet standards for visual and tech learning
- Improve tech skills
- Become digital citizens
- Increase data literacy
- Evaluate validity and trustworthiness of source material
- Be creative!!
Source: TeachThought http://www.teachthought.com/critical-thinking/can-cultivate-critical-thinking-infographics/
What are your fears & challenges around creating #infographics?
One question we get here at Easel.ly is “How do I teach students how to use your platform without distracting from the actual subject or lesson we’re studying?” That is, of course, a valid concern! Luckily, we have thousands of education users who are pioneering this exact process and have plenty of advice to share with you.ousands of education users who are pioneering this exact process and have plenty of advice to share with you.
Here are our favorite resources for teaching infographics in the classroom:
- How one educator used Easel.ly in her classroom
- Video Chat: Using Infographics in the Classroom
- Teacher Video Chat – Infographics & Writing: Standards, Purpose Process
- Easel.ly as a Multimodal Literacy Tool in Education
- A 20 Year Teacher Talks Infographics in the Classroom
- Our FREE ebook covershow to introduce infographics in the classroom
- One of our favorite teacher interviews: https://easel.ly/blog/infographicsintheclassroom
We also know how important it is to maintain a rigorous privacy policy for students, which is why we shared:
We also created “Groups” so that teachers can protect and control student work/privacy. Here’s how to set up a group and add your class!
Accessibility is also a recent topic of discussion for our team at Easel.ly. We are always striving to add new visuals and infographics that:
- Can be used at all grade and age levels
- Can be used to enhance education for ALL students/users, regardless of disabilities/limitations
If you’d like to see our commitment to accessibility check out our V-PAT Accessibility Form.
Share do’s and don’ts of using infographics for teaching & learning.
This was one of our favorite questions of the chat because we have SO many teachers ask us the same thing all the time. Here’s our breakdown of the basics:
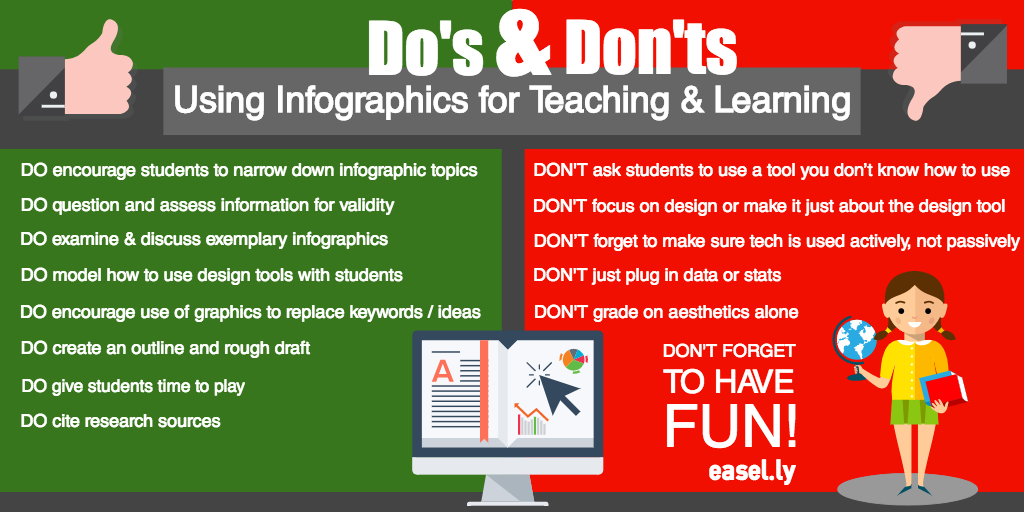
Remember, it’s all about engaging with information and technology without taking away from a fun, creative exercise!
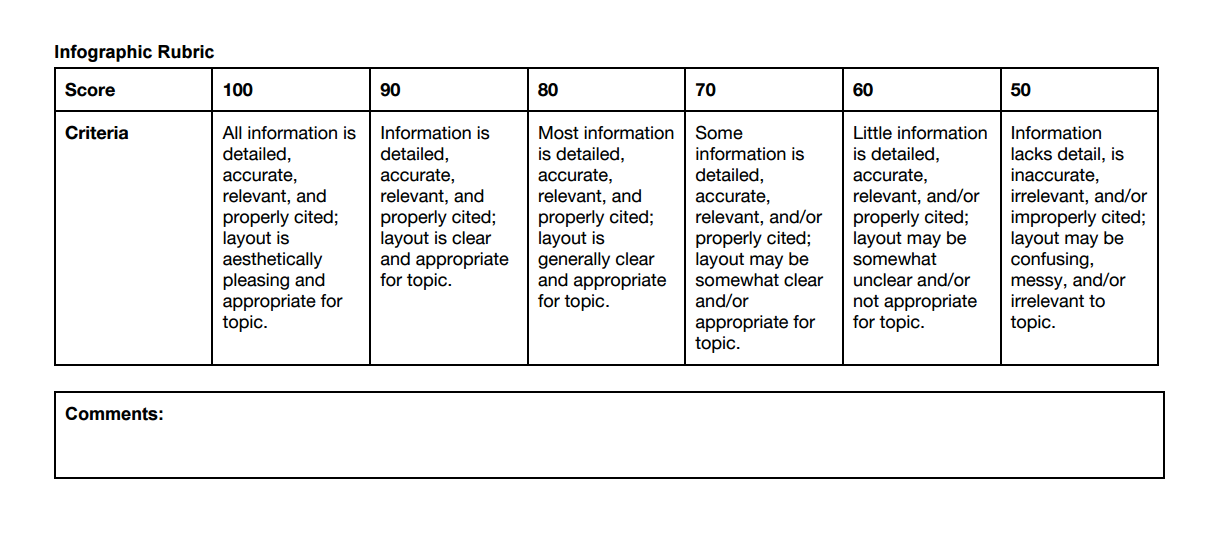
If you need help organizing your lesson plan and aren’t sure what you should and shouldn’t grade on, here’s a great template from one of our community member’s colleagues:
Now get creating!
We know that, at least in the U.S., school is (almost) out for summer. That means teachers hopefully get some much needed downtime but can also plan ahead for the next school year. If you’re planning ahead or trying to incorporate infographics into your current lessons, hopefully this Twitter chat has helped!
REMEMBER: Educators always get 50% off an Easel.ly Pro account!
Thanks to Eileen Lennon, @NYCSchools @InnovativeEdu for having us! We can’t wait to engage with all of you on Twitter and see your great creations.