Nowadays, nearly everything about anything can be found online and often in a much more appealing form than what’s typically found at school. Who’d want to pay attention to a drawn-out explanation, copying endless equations off a dusty blackboard, when they could have the essential points presented in plain language with a direct and real-time demonstration (possibly with some funky music in the background), all in a few minutes of a YouTube video?
Old school, new school: rods vs memory sticks
With digital learning becoming ever more dominant, it’s important to keep up with the way today’s students find and digest information. Lessons should be dynamic, energetic, challenging and presented in a visually appealing way. Blow the dust out of the classroom and teach the new generations in a new way: the infographic.
From the good old easel and marker, through PowerPoint, to Smartphone apps, creating engaging and memorable content has been made easy for people with any level of tech savviness. Not to mention, it’s a great way to turn those pesky devices into your allies instead of combating them for your students’ attention!
Infographic as an online language
An infographic is pretty similar to the “online language” or the SMS templates, in that it’s short, to the point, and put together in a way that makes it easy to remember what it said. Here at Easelly, creating one of your own from scratch is as easy as it gets. Once you click the button you can easily navigate through the whole process and bring your ideas to life quickly, effectively and creatively with all your options laid out clearly in front of you.
In fact, why not take it a step further and involve your students in the creating process? Capture their attention and make sure they’re involved by having them teach each other.
They’ll definitely find it challenging and fun to figure out their very own way of making those awfully long texts short, sweet and interesting to their classmates.
Also, the infographic medium’s nature will have them thinking about how to make the bulk of classwork more condensed and appealing without losing any information. This’ll make sure that they understand it better themselves, instead of just memorizing a bunch of data and risking forgetting it the minute they close the textbook.
A mobile classroom
Learn it on the go! “Excuse me, librarian” has turned into “Ok, Google” and taking your iPad out for tea is definitely preferable to flipping through an encyclopedia.
So how about creating a mailing list for the class and having all the homework, essays etc. in a ‘cloud’ somewhere, instead of suffering through a downpour of paper pages every weekend? Sure, keeping the tests analogue is okay, but meanwhile everyone could use a major de-cluttering operation. Have the classes ready on a USB drive and ditch the half-a-foot-thick Trapper Keeper. You could bet most kids would be excited to have the ban on their touch-screen tools lifted, if at least for one subject. Circling information would be made that much easier, and with a clean and creative infographic outlining the stuff that needs to be done, or making it clear what the next semester is gonna be about, you can count on dramatically increased efficiency.
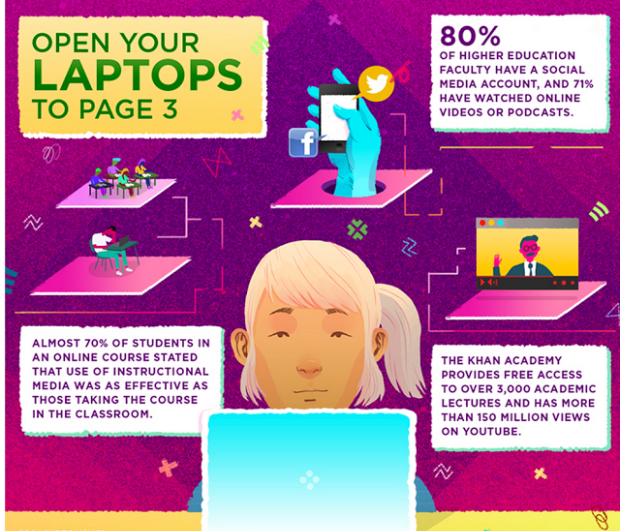
Also, increasing the amount of visual learning instead of endless reading sessions will allow better absorbing of lessons and help bring across more info in a shorter time, which is sure to bring about better grades – plus it’ll get you closer to your audience and have you communicating from a friendlier place. So, open your online easel, have fun, get results, and be ‘on the cool side’, without the teacher’s desk making you a boogeyman.