If you run or work for a nonprofit, you know the constant need to grow your reach, expand your network, and make more of an impact. While you may see the impact that you’re having on the people, places, or environment you’re trying to help, it’s often hard to quantify that information to share with others. Nonprofits also need to find information that guides their work and provides support for their campaigns in a specific demographic or location.
In essence, nonprofits need data to explain why, where, and how they are doing their work. Then they need to provide data that shows how well their efforts are working.
Easelly recently spoke to Heather Krause, the founder and principal data scientist at Datassist. She started her organization to help nonprofits collect, analyze, and visualize their data in order to provide “practical and actionable answers that spur meaningful change.” Heather spoke to us about the importance of data, data collection, and data visualizations for the nonprofit sector, and how nonprofits – big or small – can use data viz tools to expand their impact. This is only Part One of our in-depth discussion with Heather, so stay tuned for Part Two!
Why should we collect data?
Because “data” — information that is analyzed to reveal patterns, trends, and associations — is becoming a much more common term. Without this kind of information, nonprofits might not know who needs the most help, where they should do their work, or what sort of program to kickstart first. They might also overlook areas where their efforts are generating better outcomes, or might misinterpret the best ways to use their limited resources.
Many nonprofits are beginning to understand the importance of collecting data, but, of course, nonprofits have always done great work without it — or at least without the intense data collection process that so many organizations are adopting today. So why start collecting data now? How does data collection benefit any nonprofit?
Heather explained that the most important aspect of gathering data is: “answering any question you have about your nonprofit or the work it provides.”
What do you what to know about your organization?
What do you want to know about the people or places you’re trying to help?
What do your funders want to know that will encourage them to fund your organization?
Heather told us that understanding what your questions are, as a nonprofit, is the best way to guide your data collection. Your data can answer pretty much anything you want to know, you just have to know “what you want to know.” Do you want to know how to get more volunteers? Ask the data. Want to know if your funders are still interested in your program? Ask the data.
Ask a meaningful question to generate impactful data. Once you’ve got the data, it’s time to use it to create change, guide your plans, and figure out what is and is not working.
Why should we visualize data?
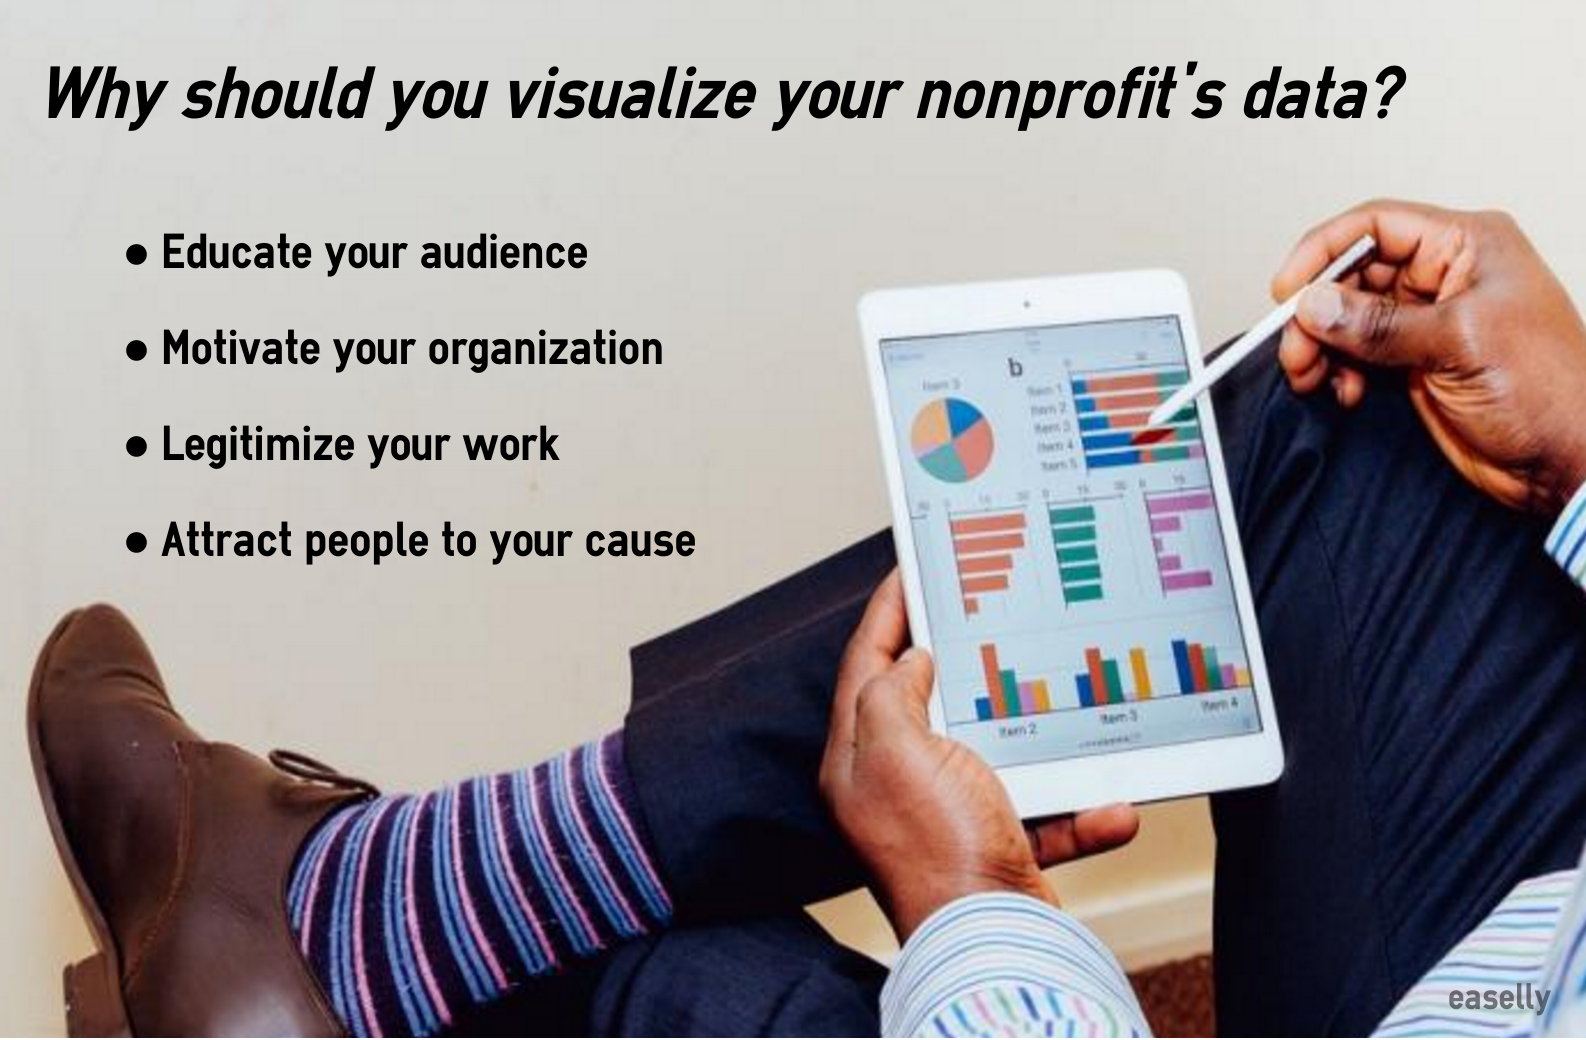
One of the questions we get most at Easel.ly is “Why do we need to visualize data? Can’t we just make an infographic about our latest blog?” If you work in the nonprofit sector and you’re not visualizing your data, you’re missing out on a ton of potential to educate, motivate, and legitimize your organization.
Taking the time to understand your data gives you a better picture of what is going on in your organization, highlights where things are going well, and where things need improvement. “When you break down that data, what’s happening on the ground is often not what’s happening in your head or on your desk,” Heather shared. Nonprofits need their data to stay on course, but they also need it visualized so they can better interpret it.
Data visualizations, images that explain data sets in visual ways, get people excited, motivate them, and remind them why they’re doing the work they do. While a spreadsheet of numbers may make sense to someone, visual data (like infographics, charts, statistics, etc.) shows everyone the impact your organization is having. Why? Visuals are easily interpreted by the majority of the population – 65 percent of people are visual learners.
And finally, Heather explains that, “…in this current climate, [data visualization] adds a sense of legitimacy.” Recording your goals and your successes with data usually equals more money donated, more funder interest, and a better social image. All of those things lend credence to your organization and show the public that your work is transparent, your impact is clear-cut, and that you’re putting in the work.
BONUS TIP: While we’re going to get into the social media side of things in Part Two, it’s also important to note here that people love unique visuals. Whether photographs or infographics, your nonprofit is best served by a visual campaign that wasn’t pulled straight off Google Images. Make your own images and show people that you’re committed to sharing your organization’s actual story.
Where do we find data?
Now that you understand the importance of data, you might be wondering where in the world you’d even start if you wanted to collect it. We often assume that “data” comes from a complex algorithm in a computer, one with lots of numbers that make our eyes cross. Heather, however, believes that data can be found anywhere, in any area of your organization, from the tools you use to the population/location you’re hoping to help.

She told us the story of one of her clients, who provides help to female farmers in rural Bangladesh. The organization provides digital machines to the farmers that measure the fat content in milk from their cows. The organization wanted to show the fat content of the milk to help farmers make more money (fattier milk sells for more), but the nonprofit discovered they could also utilize the machines to learn the gender of the person carrying the milk, the time of day the milk was collected and sold, and how much milk was provided by a specific cow. All of that information helped the nonprofit provide better services and also gave them more insight into the problems they were trying to fix.
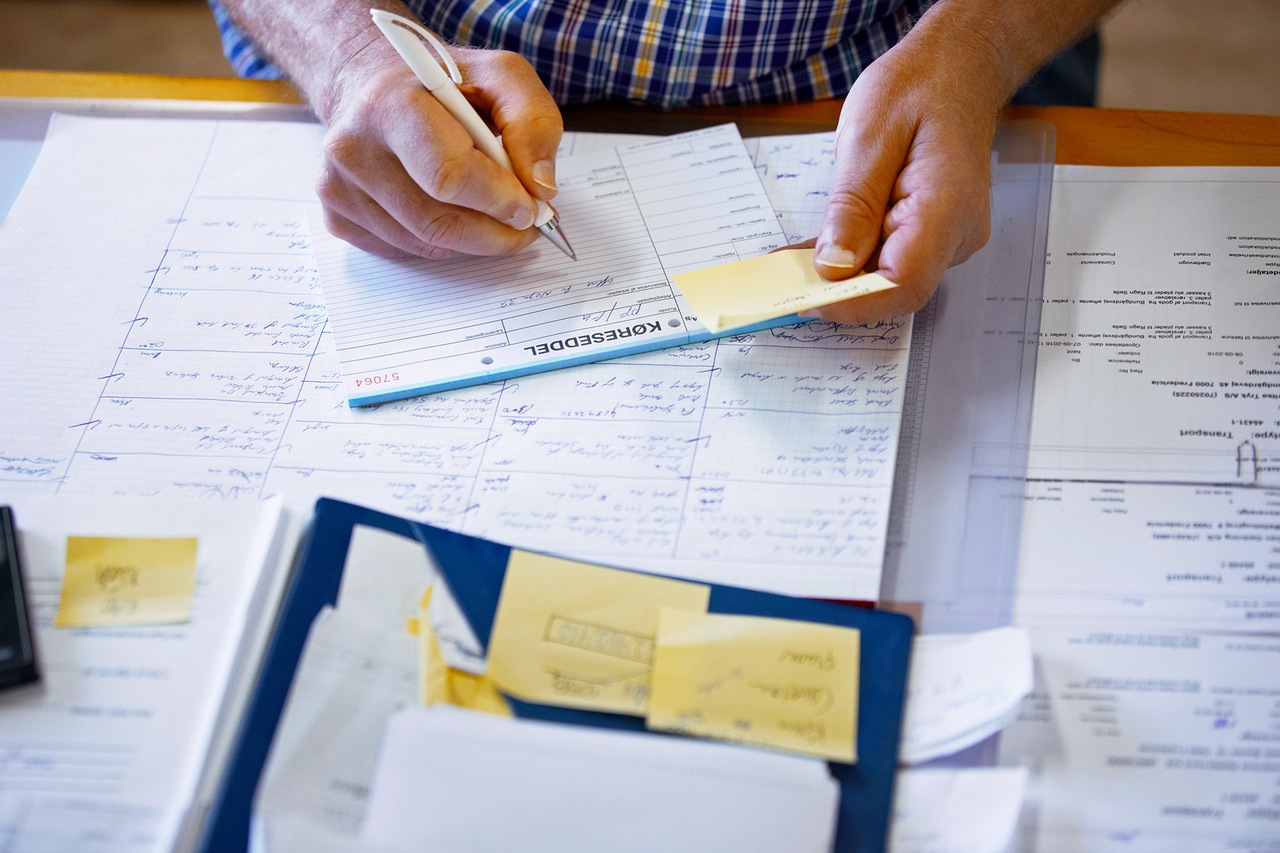
What about your organization? Are there tools you could be using more? Are there people you could be asking questions? What information do you need to guide your nonprofit? Where can that information be found? Heather recommends even doing something as simple as walking around with a pen and paper to decide what questions you want to ask and where in your organization, location, or target demographic you can find those answers.
To Be Continued…
We’ve given you a basic understanding of the what and how of data mining for your nonprofit, but in Part Two, we’re going to talk about how to create and share data visualizations (like infographics) that really help your nonprofit do its best work. For now, though, a parting thought from Heather:
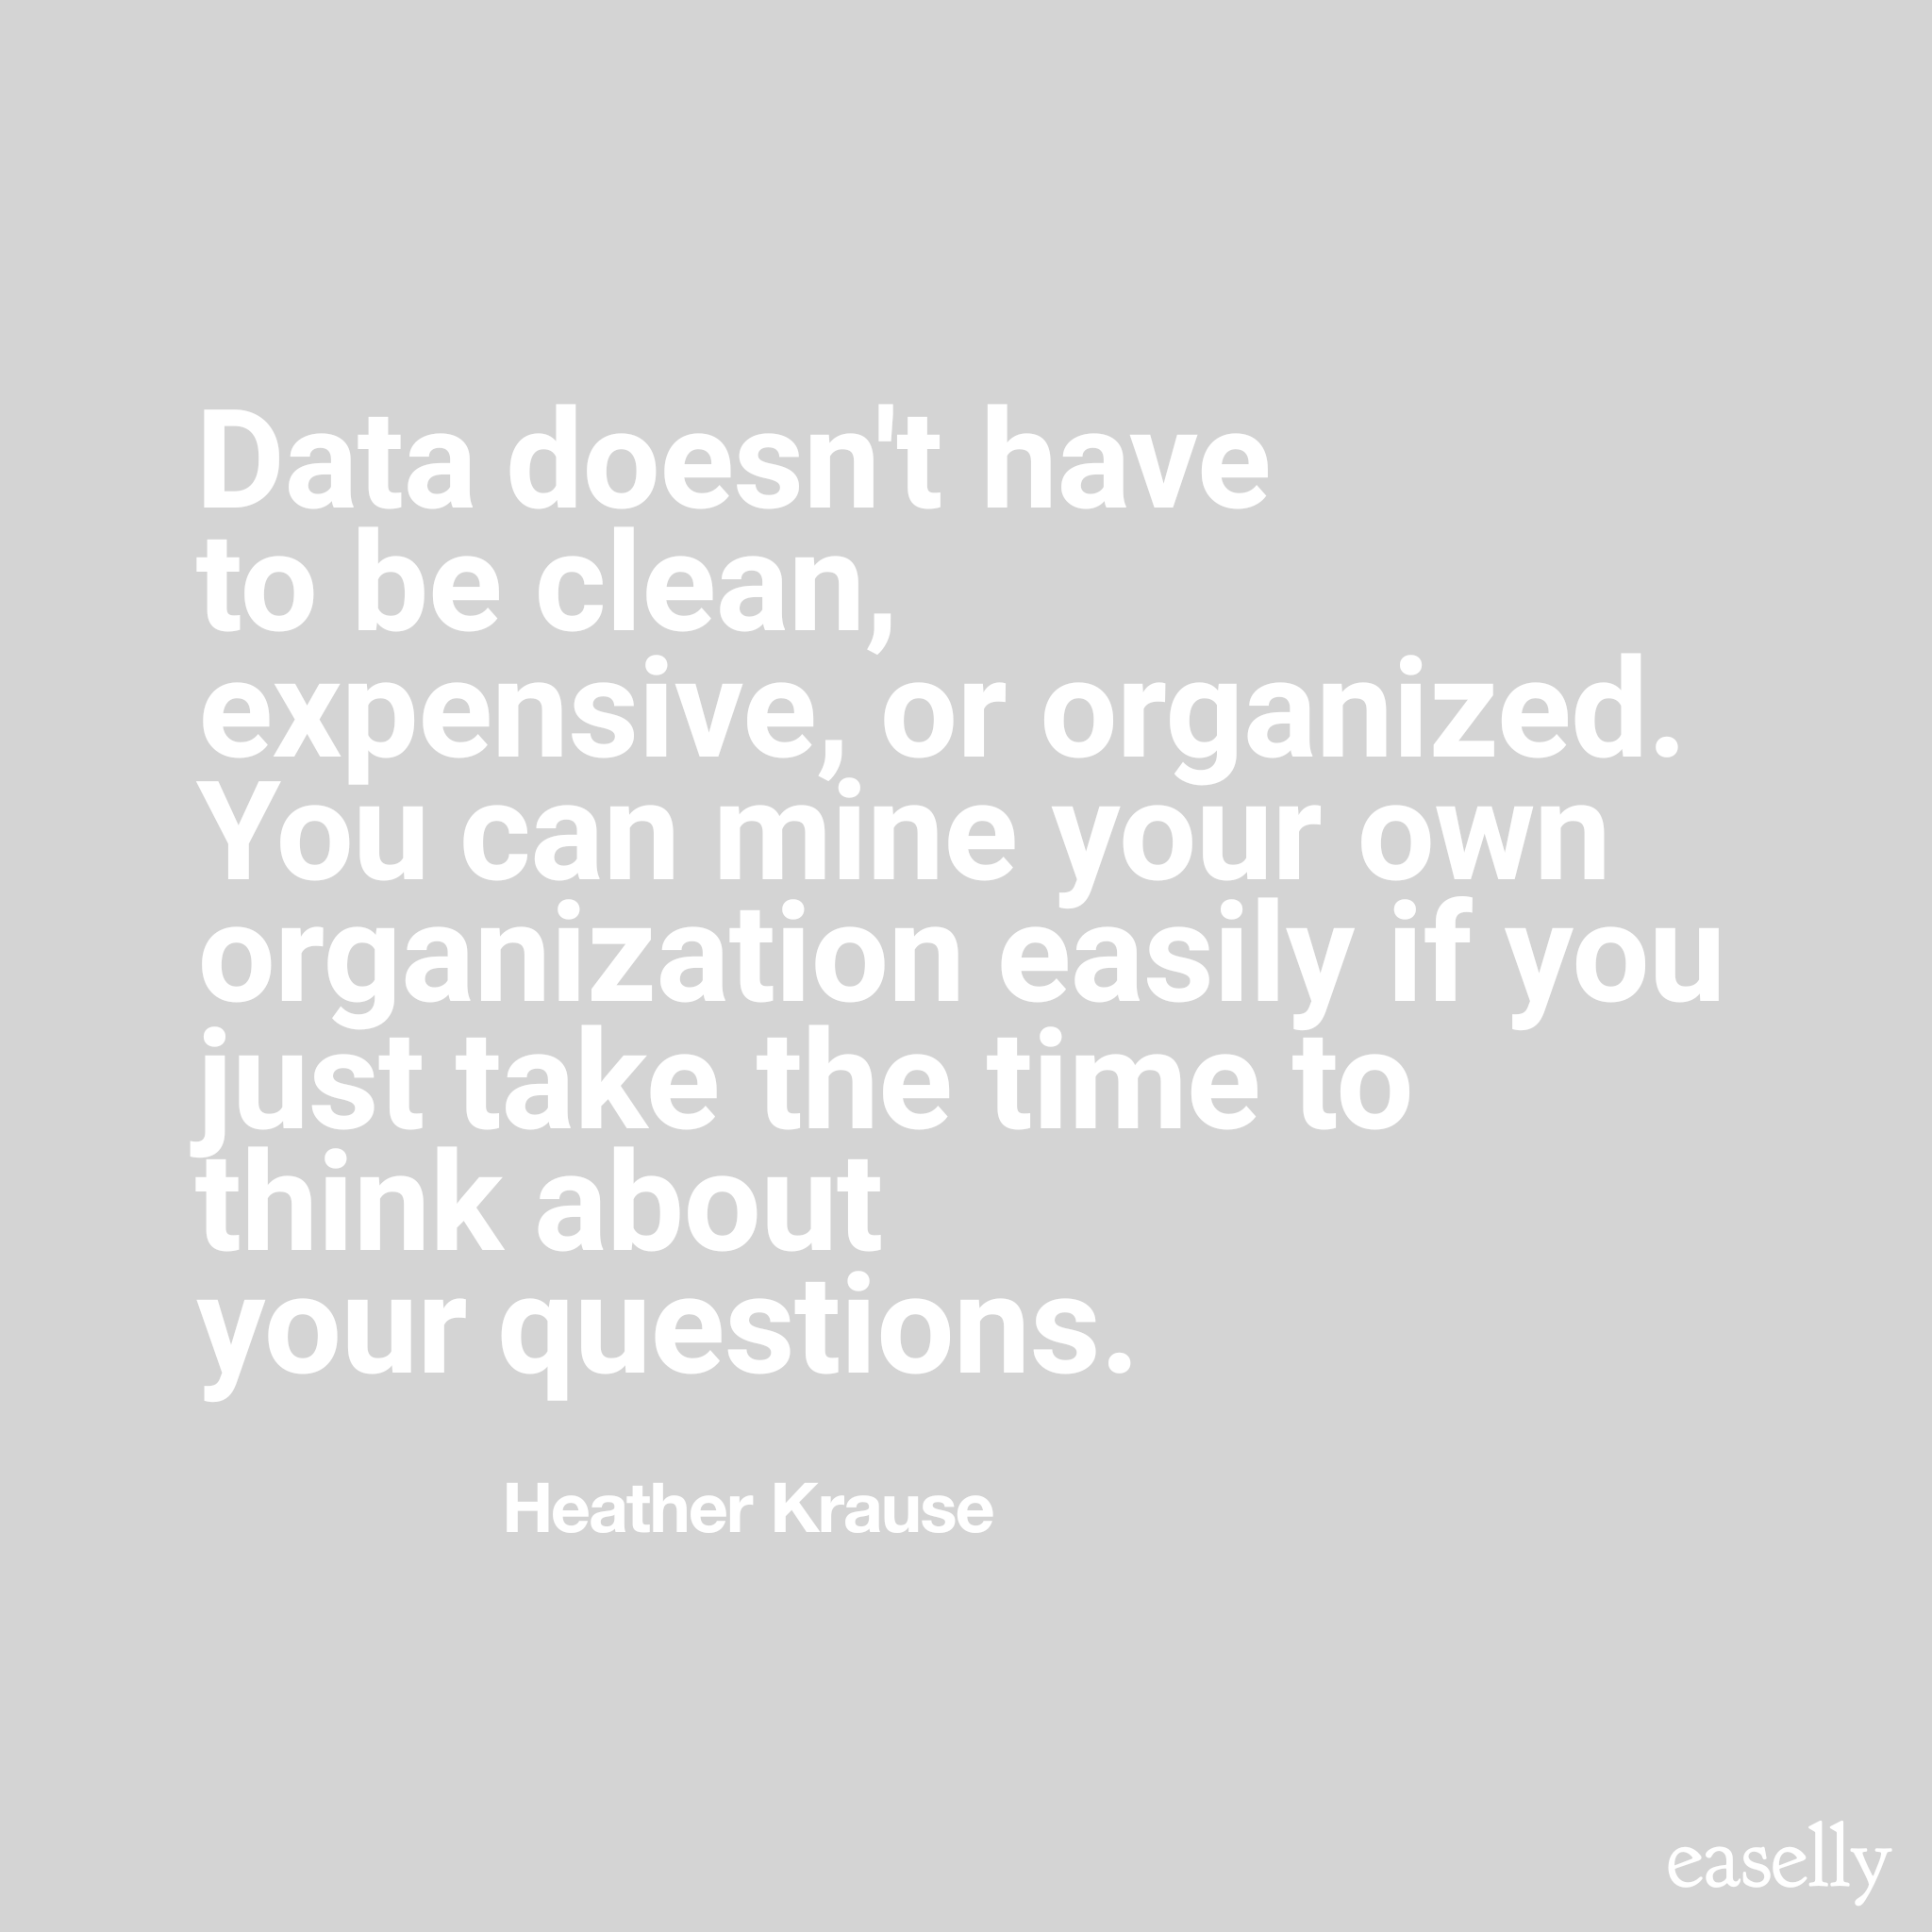
Think about what questions your organization needs answered this week. Next week, we’ll show you how to answer those questions with your data!