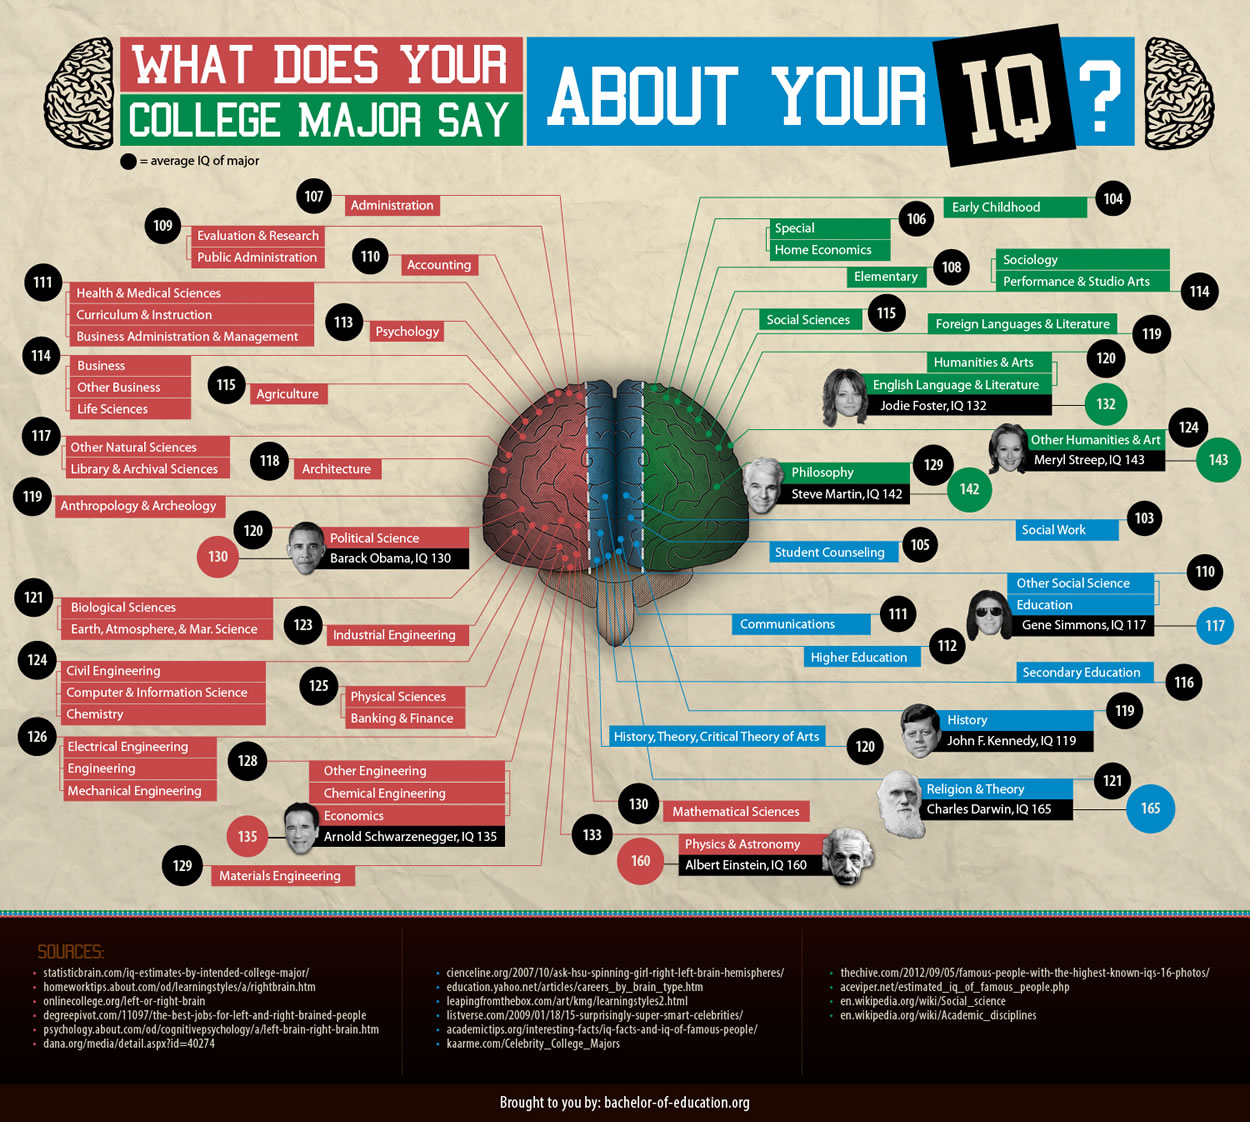
Nobody liked teachers shouting “Pay attention” when we were schoolchildren. They interrupted our “non-educational activities” which were much more fun than teachers. But they did the job. Teachers got our attention, even if it lasted for just a few minutes.
But what about the rest of the class?
Attention is the foundation of learning, but lack of it has become an increasing problem which teachers face every day.
How can we improve the teaching process?
All sorts of interactive methods of teaching proved to be far better than conventional.
Teachers already know that visual learning significantly increases learners’ interest and improves general students’ performance.
Even though it takes more time to prepare classes, the effects are really worth the effort. But very often teachers need tailor-made educational materials, which means they have to make them on their own.
Can infographics in that case help?
The answer is – yes. Infographics can be of great help to teachers.
What is an Infographic?
Basically, it can be described as a visual content designed to be perceived as eye-catching and appealing. It’s a combination of words, numbers, pictures, charts, illustrations, even colors – all in order to describe or explain something quickly, clearly, and in extremely effective and engaging way.
In other words, infographics help teachers make the content extremely visual. And since visual contents are easier to digest, our brains do less work. That means more time for quality teaching and learning, improved learning abilities, and longer and more stable memory.
A crossed out smoking cigarette sends a clear message to everyone, doesn’t it? “Ingen rökning” on the other hand, sends a clear message only to those who can speak Swedish. Infographics are the crossed out cigarette.
Science also recognizes visual learning as more effective. According to some relevant studies, 65 percent of human population are visual learners. We simply get pictures much faster than text.
Here at Easelly we want to make the whole process of education more successful, we think that educators should rely much more on interactive learning materials.
Let go of the boring, plain text process
“Tell me and I forget. Teach me and I remember. Involve me and I learn”, said Benjamin Franklin long time ago.
Just imagine how much useful information we forgot just because the process of learning was too boring and in most cases didn’t engage us at all?
For a long time education used text as a method of learning almost exclusively. Even pictures and illustrations were rarely seen or used.
Infographics are fun and make learning much easier both to teachers and students.
How do we make infographics?
The first step, and the most difficult part is to define ideas and goals. Creativity can be an advantage, but it’s not a must.
There are some questions teachers should have in mind before they start making an infographic:
- What would be the purpose of it?
- Will its message be effective enough?
- Will the students really understand or memorize it easily?
- Should it inspire or engage them?
- Will the form of infographic really be visual, etc.?
Once the goals are clearly defined, the easier part is to use numerous editing tools and make it. Infographic tools are powerful, but designed to make the whole process fun, simple and easy enough so anyone can use them effectively.

Infographics are timesavers. They are a constant source of much needed tailor-made teaching materials. They lift the whole teaching process up to a whole new level.
So, maybe getting more than a few minutes of attention mentioned at the beginning of the post is not that hard after all? Let us help you get it!

