Infographics are popular and for good reason. They’re visually appealing and perform better than other visual content when combined with text articles. But that’s not the only reason why infographics are popular. Infographics are readily shareable on blogs and social media, generating authority backlinks in the process. They have a 30 percent higher chance of engagement than text articles.
What does this tell you?
Sprinkle some infographics into your blog content, and you have an engaging piece and a regular SEO booster through backlinks.
What Makes a Good Infographic?
Two things make a good infographic: design and data.
An infographic is a visual blog post. But instead of long texts, you have colorful visuals that tell a story with quite a few numbers. Superb designs are a must. An infographic must have the right colors and an interactive design. That means more images, fewer words and readable fonts. No one will want to share what they can’t read, right?
As you can see, this infographic below is lacking in simplicity and design.

Readers are better off reading a text article than going through a cognitive overload deciphering this image. Plus, the lack of negative space makes digesting the information a chore.
Good infographics must also contain well-researched facts or statistics on a relevant topic. But you need to be selective with the information you put out. Fewer data points ensure your audience can easily distill and digest your information. So, target no more than seven to ten data points per infographic.
How Can Infographics Help You Get More Backlinks?
Optimizing your blog content with infographics is a reliable link-building strategy to bolster SEO and increase web traffic by 12 percent.
The reason being, graphic visualizations entice the human brain. Plus, we live in a digital world where people love to share information they like. So, when you create a relevant infographic for your target audience, chances are they’ll share it on social media or blogs.
As you’ve noticed, using infographics this way generates tons of traffic, engagement, and backlinks for your website. This infographic-SEO strategy has worked so well on many occasions and has case studies to show for it.
Now, let’s see how you can make an outstanding infographic for your SEO campaigns.
Infographics: How to Make Them
Designing an original infographic has a learning curve to it.
Luckily, anyone can create an infographic these days.
However, you’ll need a good CRM tool to research customer trends and behaviors before using the data gathered to create an infographic. To achieve this, CRM optimization is necessary.
So, how do you create an infographic? Follow these steps:
1. Choose a target market
Creating infographics is more than assembling raw data and statistics with colorful images.
Like every web content, you must consider user intent and search for a market audience already in need of answers and cater to them. You may start with the regular Google keyword search for viral infographics in your industry.
Or check Pinterest and Buzzsumo to find interesting, viral infographics your target audience is interested in. Pay attention to metrics like shares and likes to gauge the interest of the audience.
The research should give you a clue on how to structure your content to resonate emotionally with your audience. Also, remember to target a less saturated niche to increase your chances of going viral.

For example, this infographic above targets pregnant women. You can do something similar once you have a rough idea of what your target audience wants.
2. Choose a unique and relevant topic
Now, it’s time to pick a relevant topic and work on it. Millions of marketers churn out infographics and blog content daily, so yours must be exceptional from the start.
By choosing a unique topic, you streamline your resources and create an effective way to measure your infographic’s success. Though it might be a little tricky to choose a unique and relevant topic right off the bat, you can combat this by adding a twist to an already common narrative like this example here:

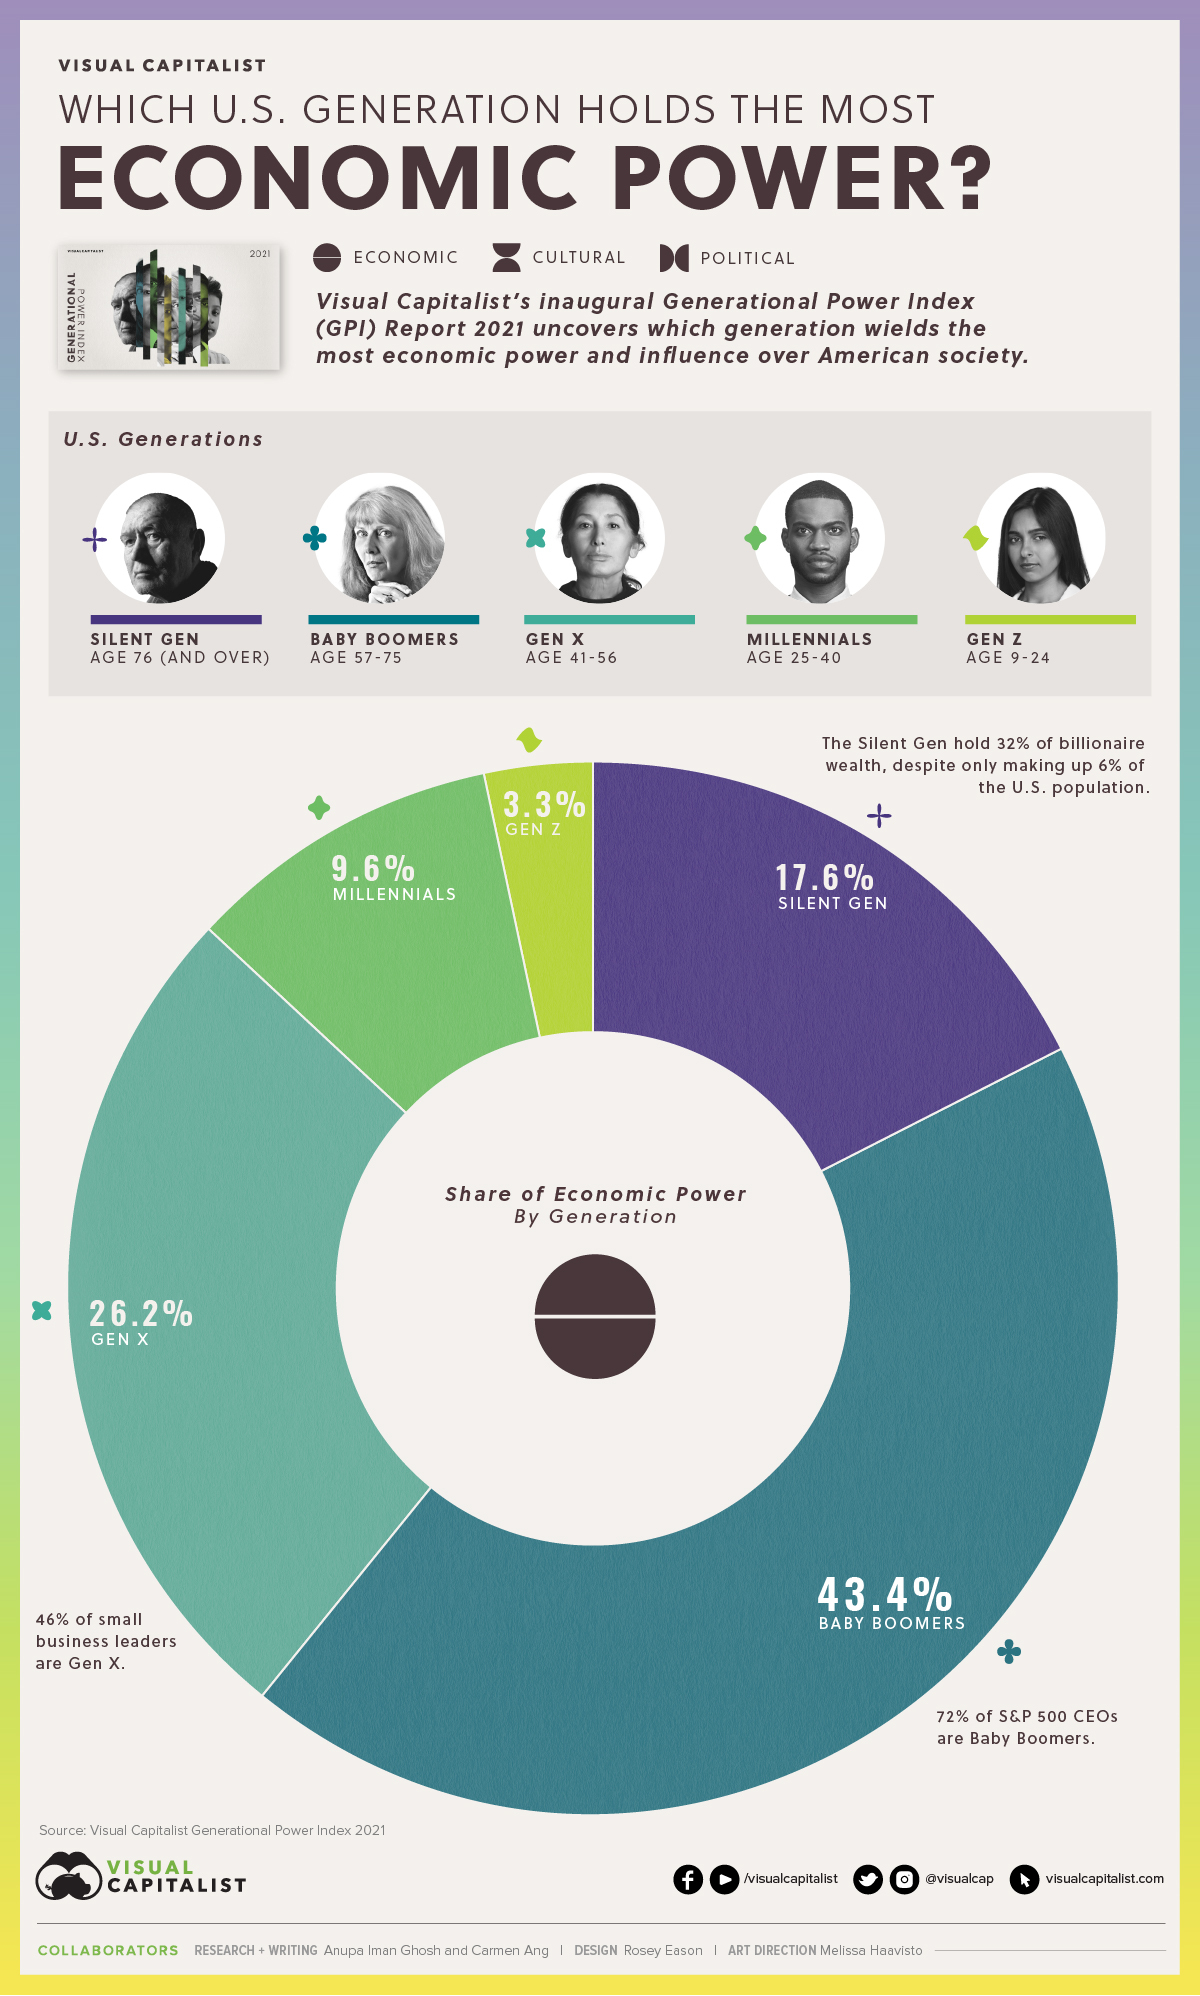
Visualizing the generation bracket with the most economic power takes a common narrative of wealth and puts a twist to it, making it relevant.
Alternatively, you could be on top of industry trends and create a related infographic with a different take on the topic. Again, if you’ve done your research correctly, your topic will be fresh and exciting to your audience.
3. Offer useful data statistics
When it comes to designing unique infographics, accurate data is something you can’t do without. Make your infographic valuable by offering data and statistics.
Gather data using surveys or business insights using a CRM tool. Online polls can also work.
Alternatively, compile relevant studies on your chosen topic into an easy-to-understand infographic. Of course, you can’t take credit for the information in it, but compiling it is a way of providing valuable information to readers.
Here’s an excellent example.

Keep in mind, though, that the goal here is visual storytelling. So, aim for a few data points per infographic, not a deluge of information.
4. Produce content based on your knowledge
Focus on a niche and position yourself as an expert in it.
For instance, if your website’s core focus is email marketing, you want to produce an infographic on something related to that — maybe, email funnels or conversions — not public relations.
Here’s an infographic from Shopify.

Shopify is a leading ecommerce brand. So, creating an infographic like this speaks well of their authority in that niche.
How to Use Infographics to Build Backlinks
We’ve covered the basics of how to design an infographic. But how do you use that infographic to acquire quality backlinks for your website?
The answer is simple — Promotion.
1. Make it available on your website
The first thing to do is publish your infographic on your website.
Since it’s original content, publishing the infographic on your website gives you creator or ownership rights if someone tries to plagiarize it. In addition, it ensures other digital marketers or creators can link back to your website, which is the goal.
Make your new infographic a part of a blog post or write new copy explaining the findings in the infographic. That way, there’s a unique and relevant context around it.
2. Look for potential websites
Now it’s time for outreach and promotion. But first you need to look for potential websites to reach out to. Fortunately, infographic directories like Pinterest and Canva allow you to make your content available to the public.
If you haven’t connected with these websites in the past, it’s okay. Begin your search with Google.
So, if your infographic was about email conversions, you could target websites or SaaS brands promoting newsletter templates or an email finder. Browse through Google’s suggestions and the website results on the first page.
I did something similar; look what I got:

Alternatively, you can use a tool like Ahrefs to compile a list of potential websites in an instant. Just click on “Content Explorer” on Ahrefs homepage and type in your keyword to see a list of websites. Then export it to a spreadsheet, so it’s easy to manage later on.
3. Make a list of their email addresses
Using the websites you exported to the spreadsheet in step 2, curate a list of email addresses.
It’ll be time-consuming and inefficient to do everything manually. So, use tools like Voila Norbert or FindThatLead to verify and curate the emails of bloggers or marketers related to potential websites.
Make a list of their email addresses. You’ll be needing them for email outreach.
4. Begin sending customized emails
With the curated email addresses in hand, it’s time for business.
You need to reach out to potential websites with a dedicated audience in a similar niche. It’s the guestographic method, as Brian Dean from Backlinko calls it. This process is similar to the regular blogger outreach where you reach out to potential websites and publish a guest post on their blog. However, instead of linking to a text article, you cite the already published infographic.
For this strategy, send out personalized emails to the email addresses you curated in the previous step and make them an offer. Of course, it’s possible to use email automation to send emails in bulk, but you’ll record better success if you send each a personalized email.
5. Offer them something valuable
Here’s where you put your persuasion skills to use. That’s why it’s advisable to make a soft and subtle sell. People usually get turned off when someone’s too aggressive in their sales strategy. With email outreach, you need to add value.
Make them a deal — a free mini guest post plus an infographic. The guest post should be within 150-300 words, and in it, a contextual link to your site.
Additionally, you want to email websites cited in your infographic, letting them know you used their content as a source. This might make them enthusiastic about sharing your content.
Repeat this process with multiple influencers or bloggers in your niche to acquire authority backlinks and boost your site’s SEO.
Two Examples of Viral Infographics
You can learn from infographics that went viral. So, in this section, we will look at two examples you can study. Follow their best practices. Who knows? Your infographic might just be the next viral one.
1. Entrepreneur: People who succeeded in their old age
This infographic shows an illustration of late bloomers who found success later in life. It received more than 13k shares.

Why? It follows best practices. Notice the bold fonts, use of vibrant colors, and white space? It makes it easy to understand at a glance.
2. Futurism: Universal basic income
The infographic below explains the concept of universal basic income and how it works in an easily digestible way.

The result? It gathered more than 19k shares. Although UBI is a complex topic, the people behind the infographic managed to describe the topic in simpler terms and made the infographic engaging.
Wrapping Up
There are many ways to boost your site’s SEO, and building backlinks is one of them.
Designing and promoting an infographic can boost your site’s SEO by generating contextual, high-quality backlinks. However, the first thing to consider is how to create an infographic that’s shareworthy.
Research your target market and focus on a topic they’re interested in already. Since it’s a DIY process, use web tools and templates to design your new infographic before publishing.
After designing, reach out to potential websites with a dedicated audience to publish on their site and link back to yours.
Ready to design your new infographic? Follow the tips in this guide to get started!
Martin Gessner is the Founder of Focus on Force. He has spent over 10 years working in various Salesforce roles including business analyst, project manager, consultant and solutions architect. Along the way he has earned twelve certifications, published “The Salesforce Career Playbook”, and helps Salesforce professionals learn more about Salesforce, develop their career and prepare for certifications.
