Creating an infographic is an entirely new world for many people, whether you’re a teacher, small business owner, or even a blogger. You know you want to share data in a visual and engaging way… but where do you even find the data?
The first step to creating a great infographic is finding data that is reliable and relevant.
So here’s our guide to the top five places we at Easelly use to find information!
Data.gov
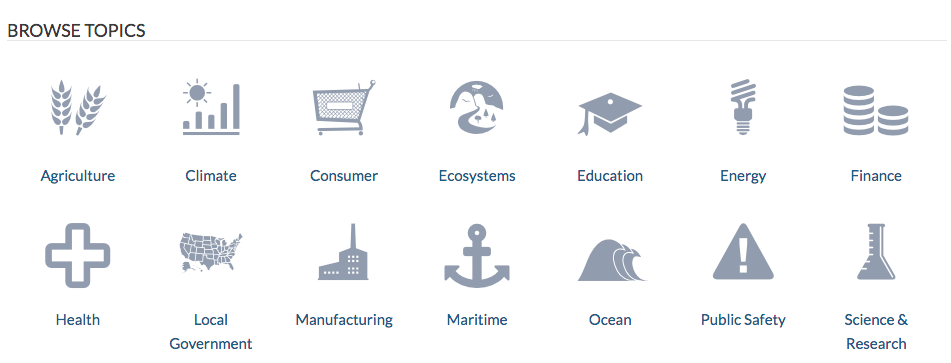
Data.gov is the United State government’s open source data “library.” Because it’s government-supported, the data is very reliable and vetted (which means you won’t get any weird, fake numbers). Keep in mind that these are generally data reports that the U.S. government uses, so they may not always apply to your audience or specific subject. However, it’s still a great place to start!
World Health Organization
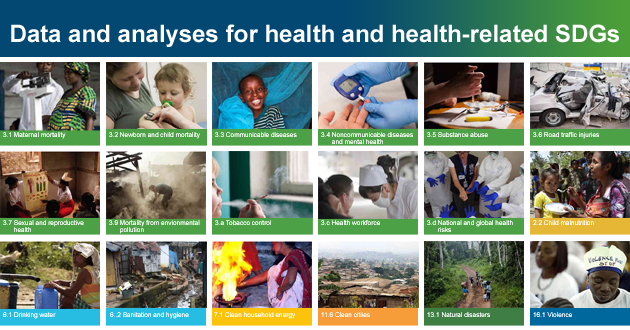
The World Health Organization (WHO) is a massive organization that collects data on different demographics, countries, and situations all over the world. From child mortality rate to sanitation in third world countries to rates of anxiety and depression, WHO is an amazing resource when it comes time to explore a specific demographic, area, or condition.
Bureau of Labor Statistics

It’s right in the name – the Bureau of Labor Statistics (BLS) collects data on the workforce in the United States. Whether you want to know what a person can expect when entering a specific job field or what the pay range is in different areas, the BLS database has tons of great (and very reliable) information. This is especially useful when doing research on your audience or your industry!
Google Public Data
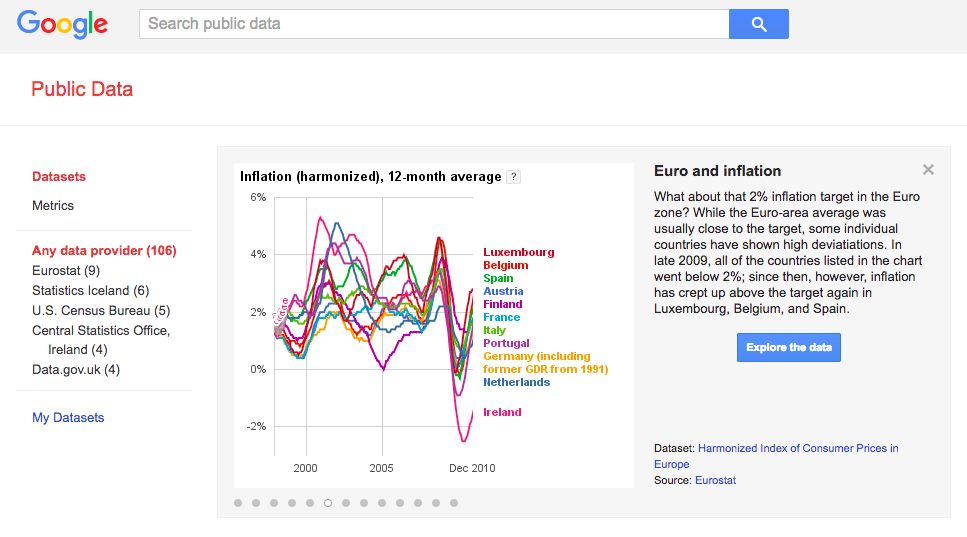
This is the Big Kahuna that many people don’t know about. Google Public Data is an open source database that you can search for a variety of topics, but keep in mind that it is still fairly limited to a handful of data sources. However, those sources are highly reliable and vetted against Google’s standards for reliable information. If you’re looking for a very specific subject or statistic, this is the place to go. You can also search specific databases individually in case you need particular data sets or methods.
You know those polls that are always trending in the news or on social media? Odds are they come from Pew Research Center. Keep in mind that polls are subjective, self-reported data, but they can be a huge resource for your next infographic. Use polls to create industry guides, create class reports, or event explain why your audience needs your product!
Bonus Data Sources
The best part about living in today’s online world is that our access to data is always increasing. In fact, we have created and stored about 90% of the world’s data in the past 4 years. Pretty crazy, right? That means that data is everywhere.
So we’ll let you in on one pretty cool secret when it comes to finding data for infographics: use social media!
Hashtags like #data or #dataviz or even #statistics will pull up a gold mine of information right in your Twitter, Facebook, or LinkedIn feed! If you like using LinkedIn, we highly recommend checking out the #DataWise hashtag – it is The Economic Times’ feed of random yet highly interesting data tidbits!

But keep in mind that, whenever you use data from sources that are not a well-known organization or database, you need to vet the material. Ask yourself:
- Where did it come from?
- Is there a clear agenda or spin on the numbers?
- Does it actually apply to my specific topic?
- Will my infographic audience want to know this?
Remember: You can’t just pull numbers out of thin air and plug them into your infographic – keep the data you use to high standards. Your audience, students, or customers will know the difference!