Infographics are a medium where less is always more.
We’ve said it before; the only area you should overindulge in is when you collect your facts and resources.
The adorable tumblr “Tiny Infographics” has produced numerous infographics that keep this principle in mind. They waste no space in illustrating an issue. Each infographic draws a comparison between two figures. With two colours and two labels, it’s hard to miss each infographics big point.
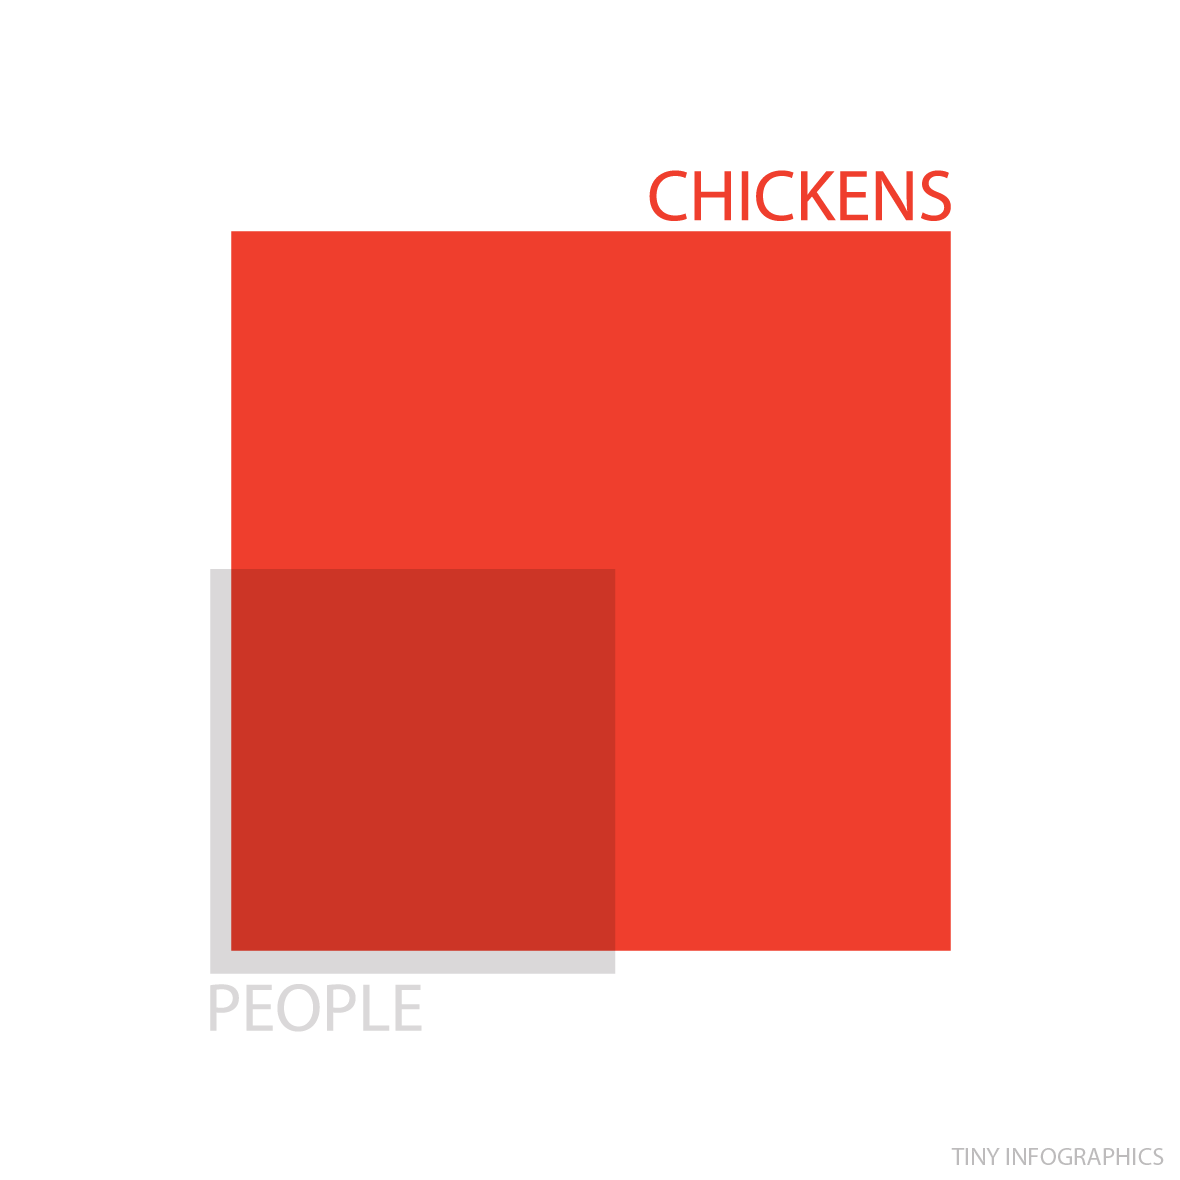
1. Chicken outnumber us by a wide margin
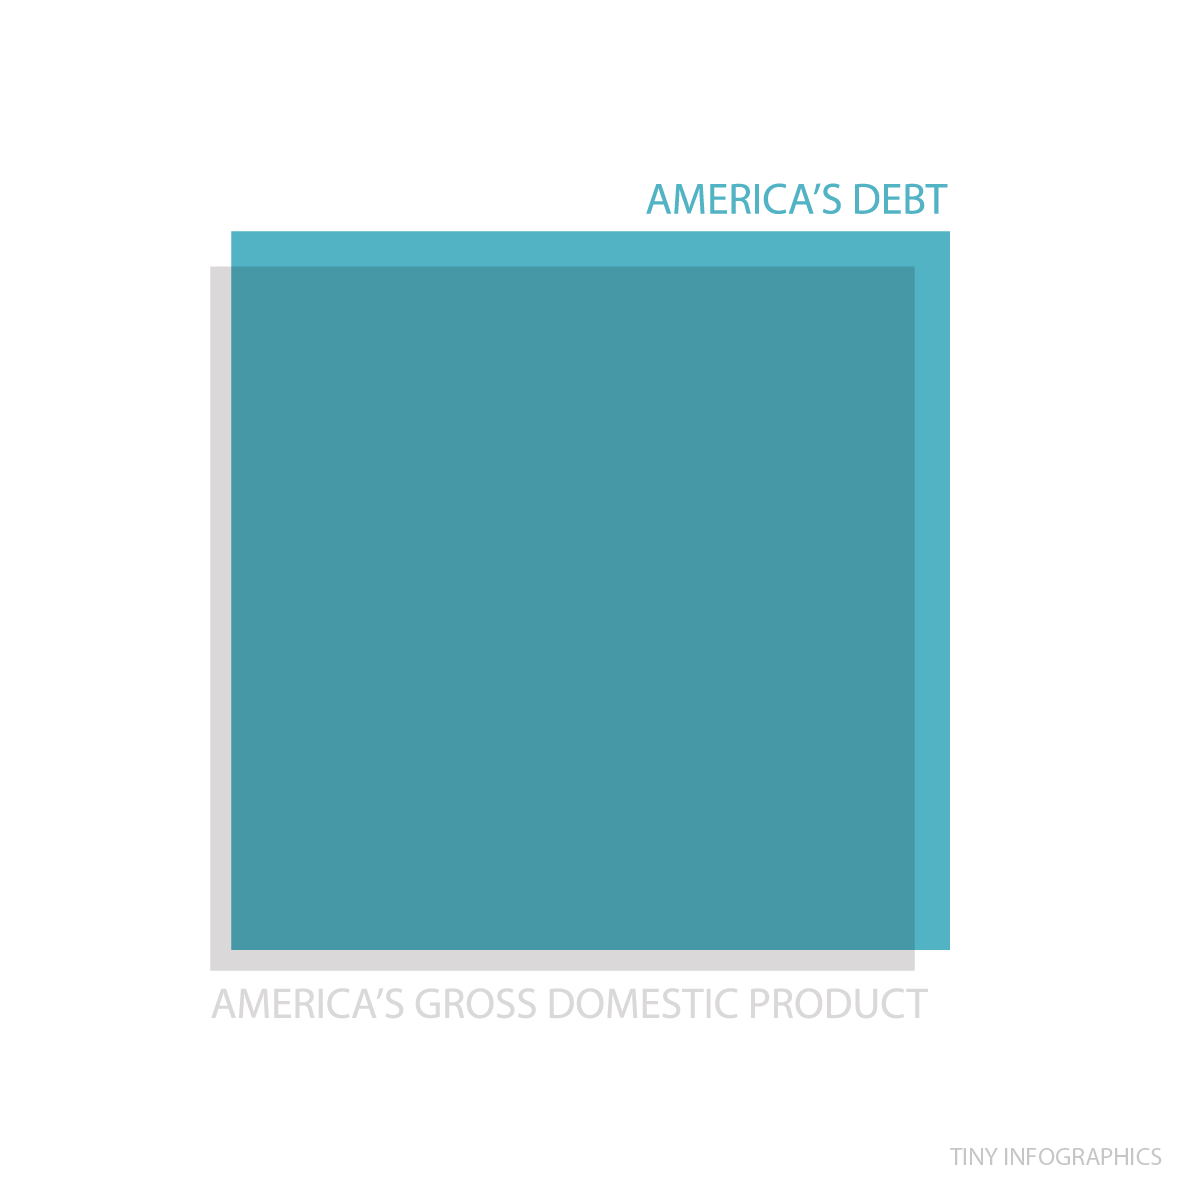
2. The USA’s GDP is the same size as its debt
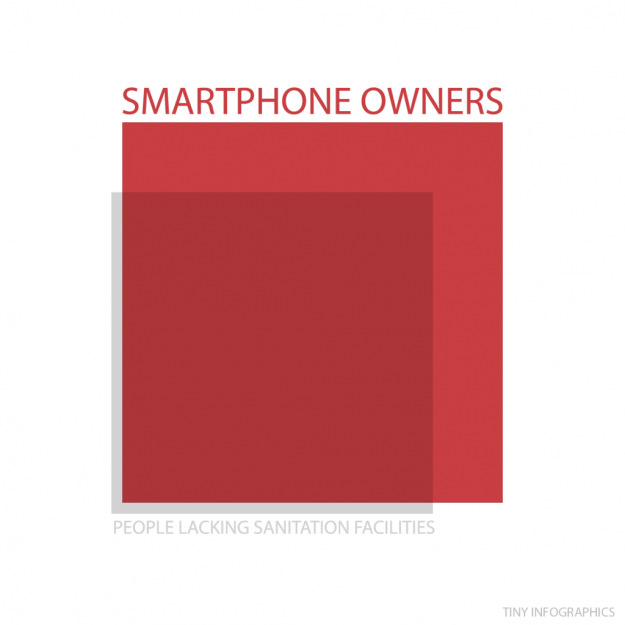
3. More people have smartphones than people have access to sanitation facilities
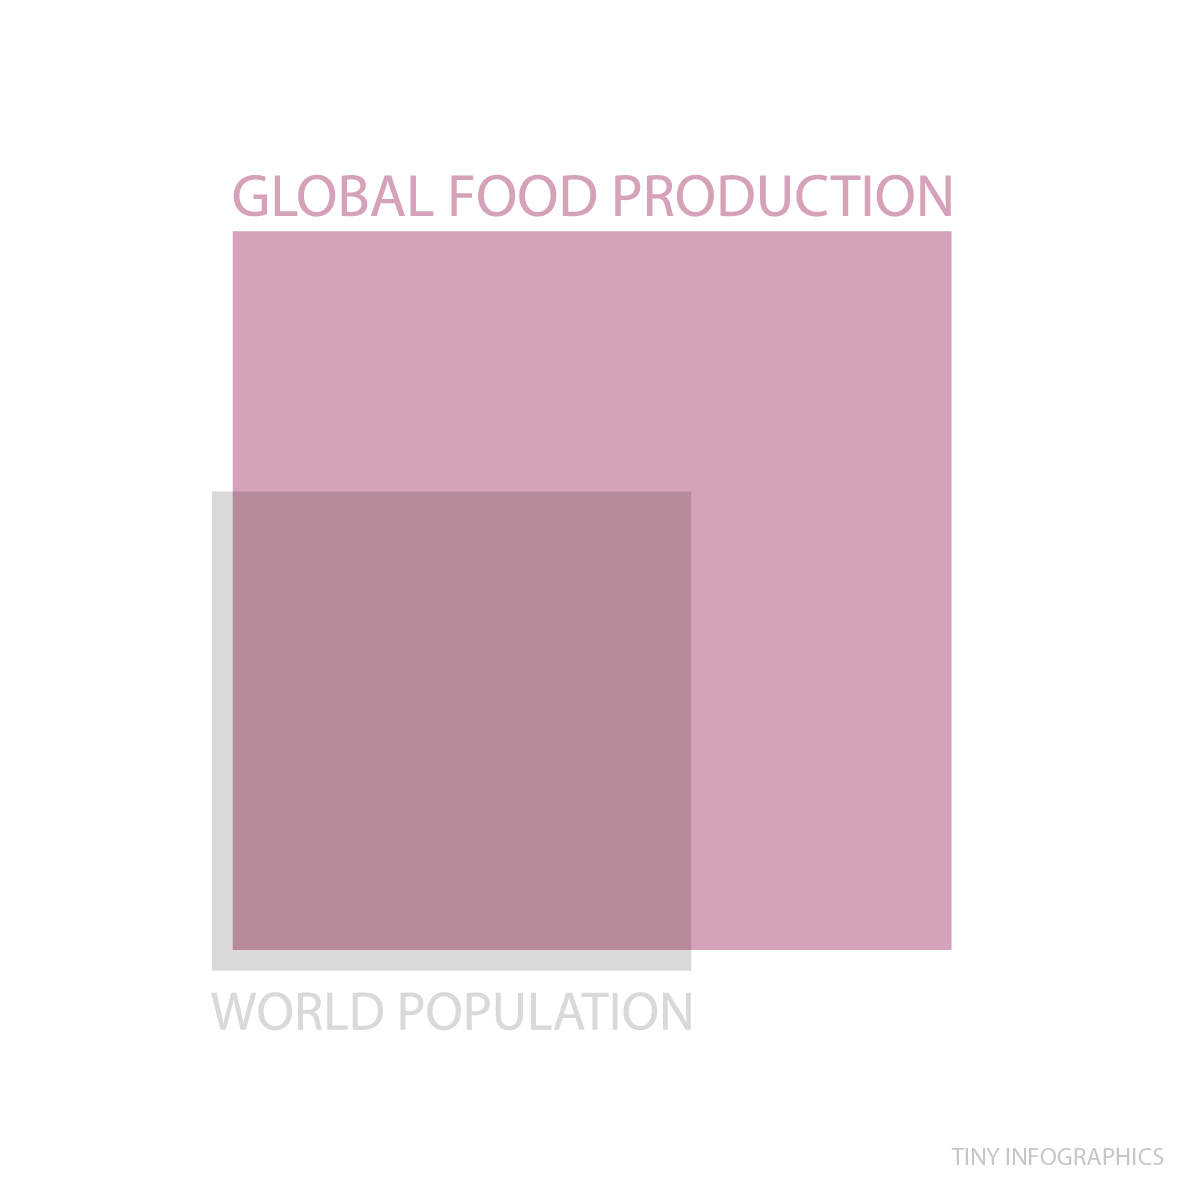
4. We produce more than enough food to feed everyone – twice
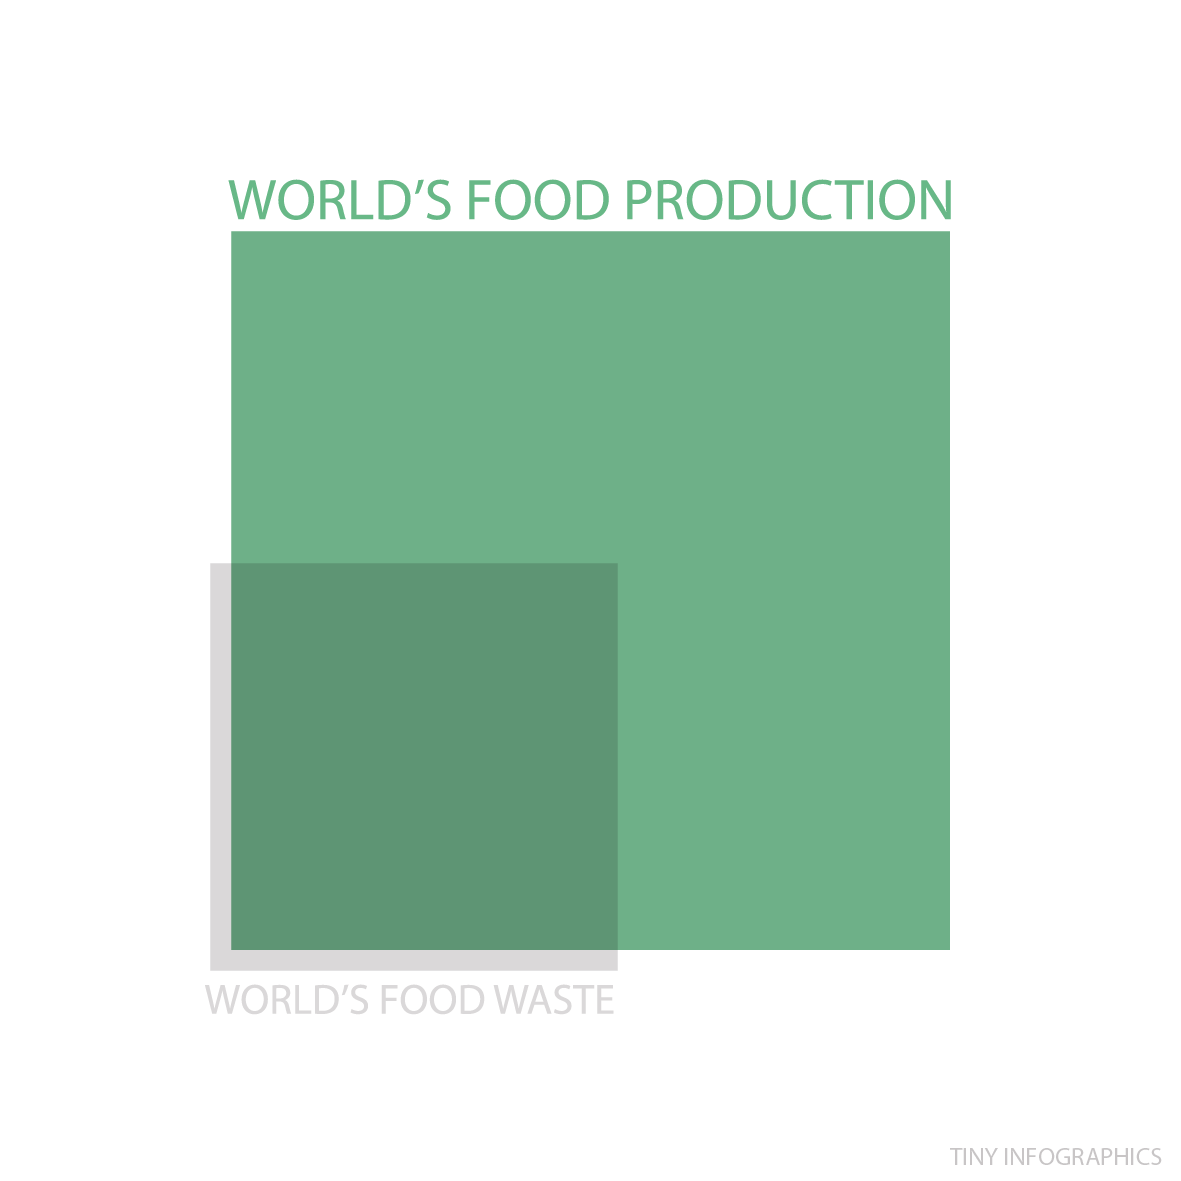
5. We waste nearly a quarter of the food that is produced
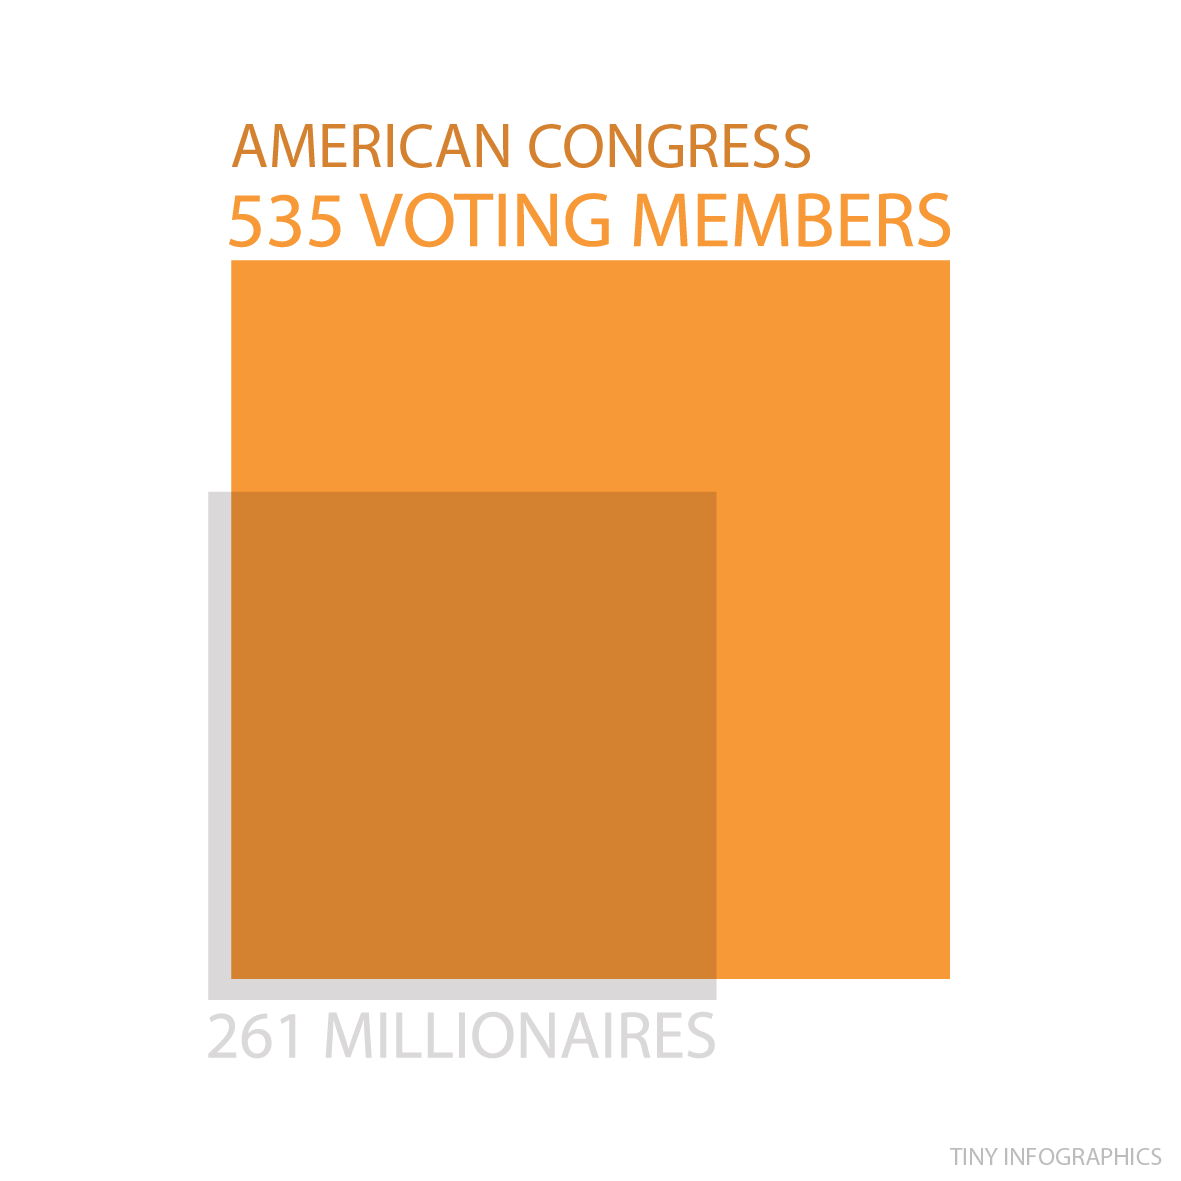
6. Nearly half of the people in the US congress are millionaires
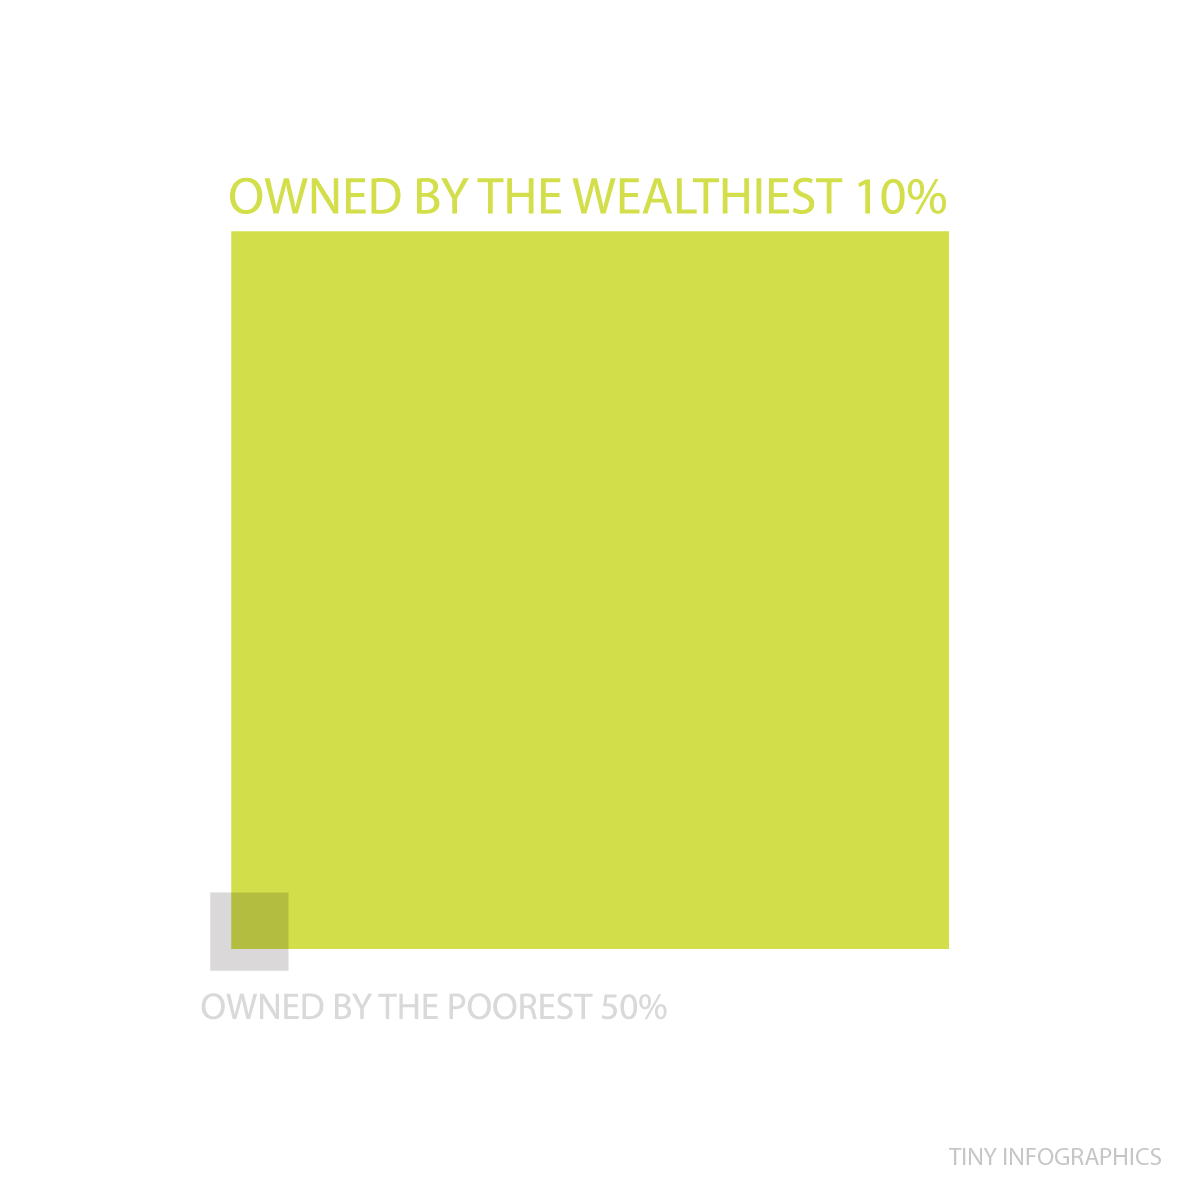
7. The stark contrast between the richest 1% and the poorest 50%
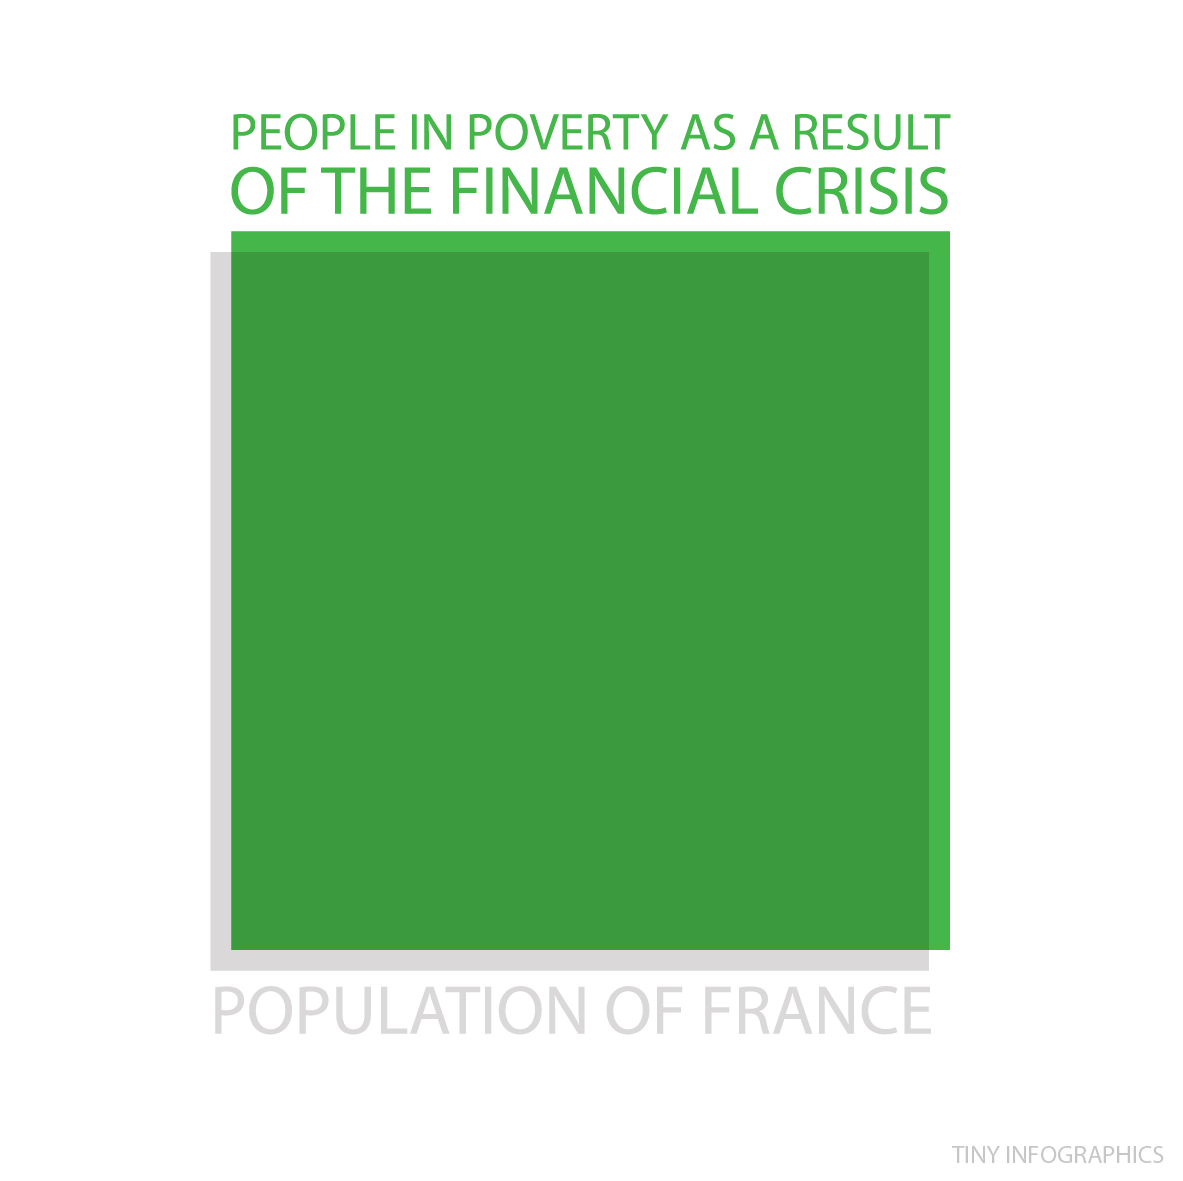
8. The population of France is equal to the number of people pushed to poverty by the 2007 financial crisis
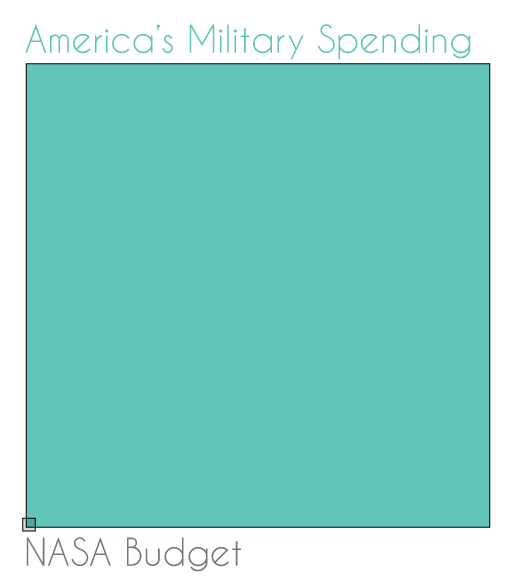
When these infographics appeared on Reddit, user Ftlguy88 created a couple more that illustrate the disparity between US Military Spending and NASA’s budget.
9. The USA’s military budget versus NASA’s budget
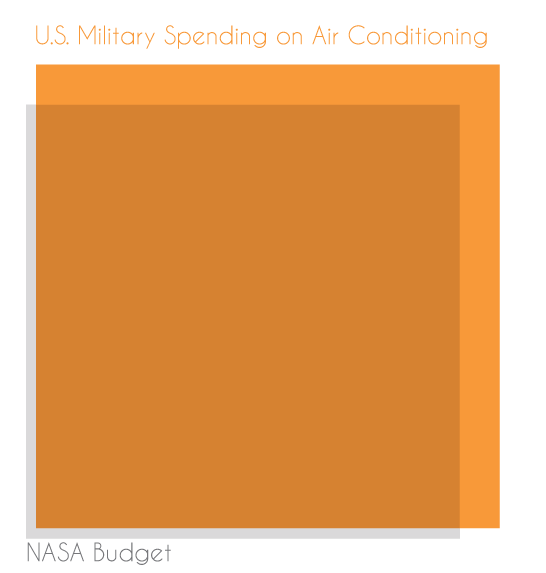
10. The US spends less on NASA than they do on air-conditioning for the military
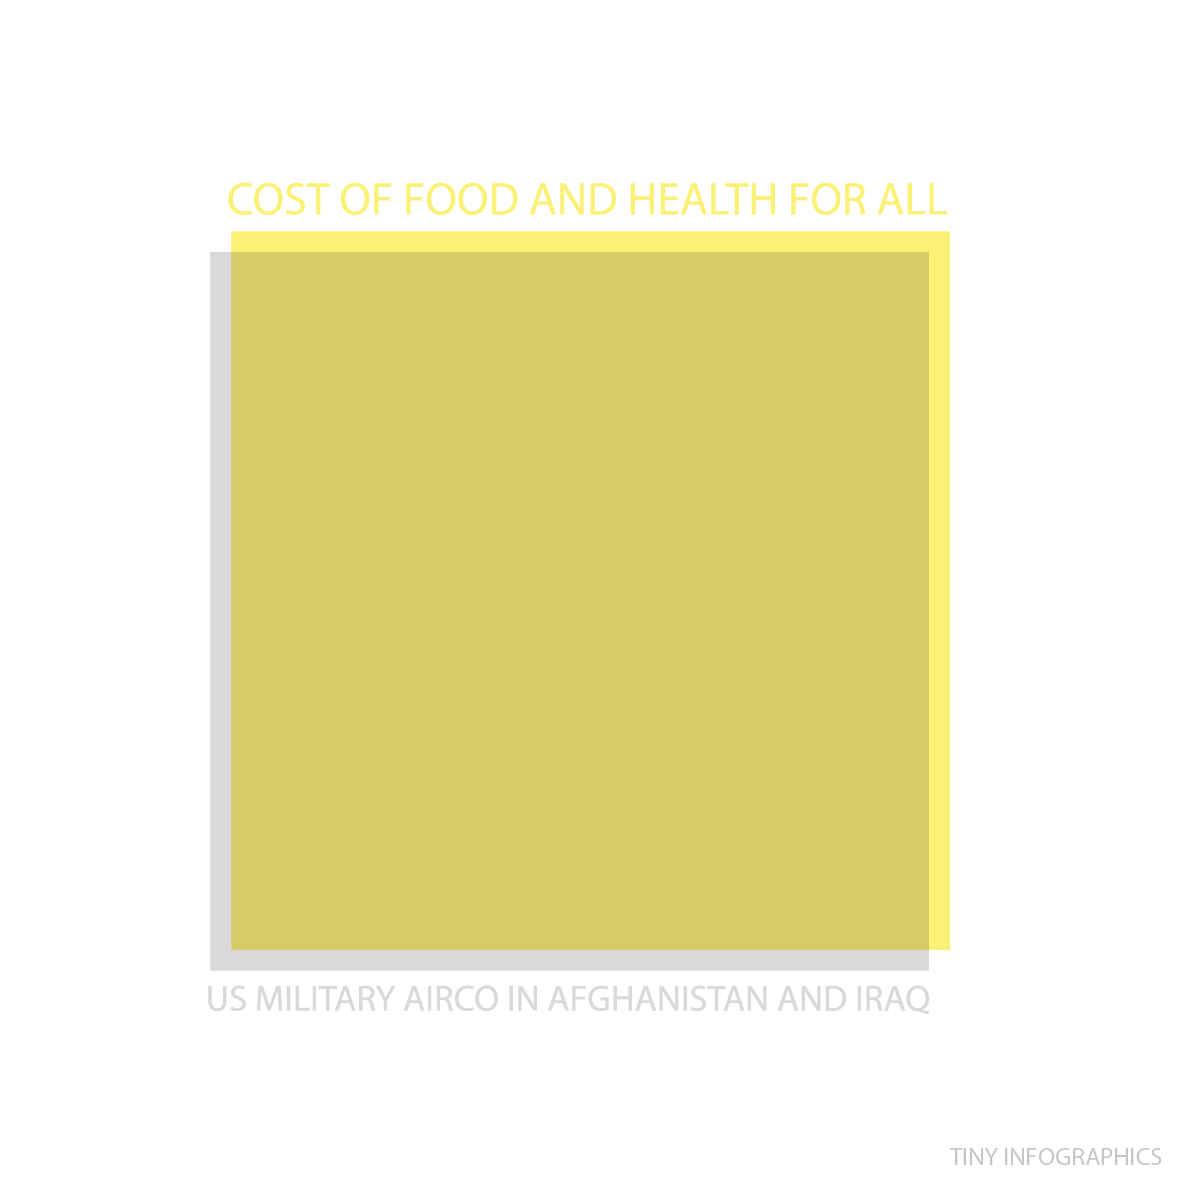
BONUS: The cost of food and health for all ($20B) is equal to the US army’s air-conditioning costs
(via the Tiny Infographics Tumblr)