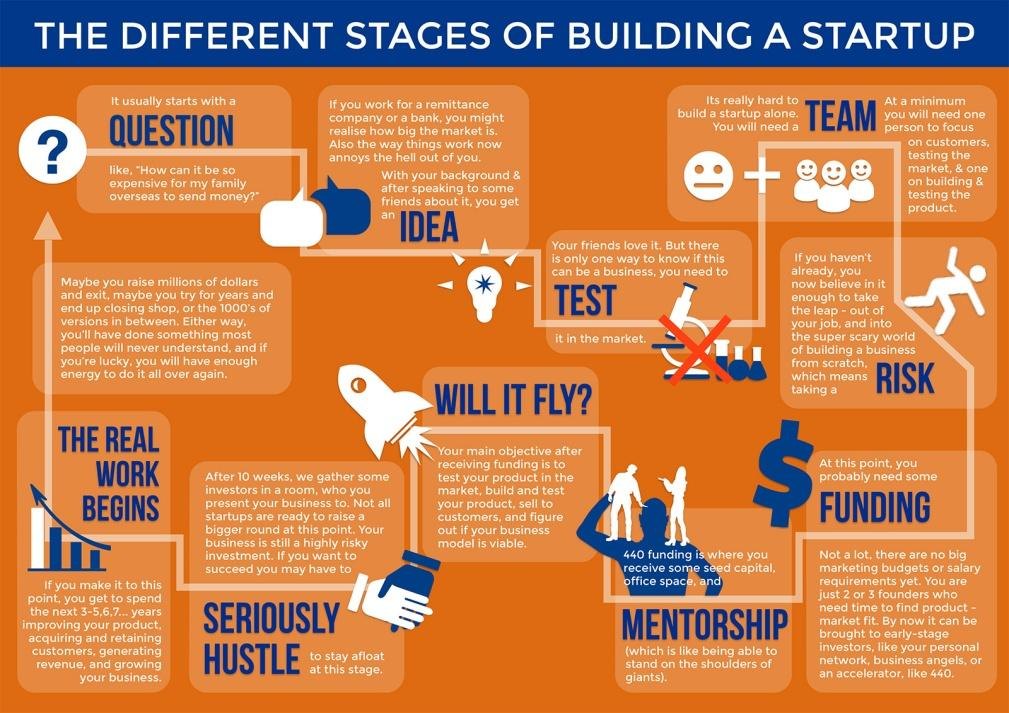
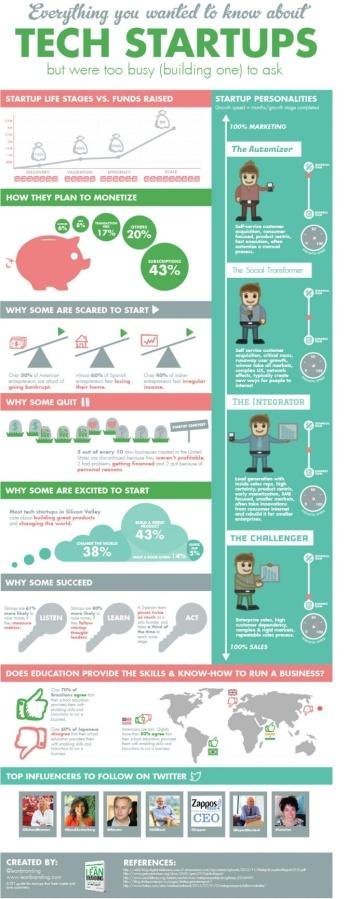
The tech industry is a tricky sea to sail. With everything changing at such a rapid rate, you’ll probably have to shift directions more than once, and it’s likely that you’ll come across some crazy competition, too. Being innovative is extremely important, and finding new and scalable business models is a huge part of that. Startups definitely fit the bill, but you can bet you’re not the only tech entrepreneur with that idea. So how do you increase your startup’s efficiency and make it stand out? One little visual aid can be a total game changer.
All in one: the perfect tool
Infographics are an awesome medium for anything a company, partnership or even a temporary organization might need when it comes to collecting, organizing, displaying or distributing information. From brainstorming, through polls and monthly strategies, to uniquely formatted reports, everything is so much clearer when it’s presented visually rather than textually.
Over the course of your startup adventure you will probably be dealing with piles of data. It’s easy to lose track of your numbers when there are hundreds of rows on them on a screen, and paper copies just evilly insist on getting messed up and disorganized at least once a week. This is where infographics jump in to help. How much money did we invest? How’s the marketing department doing? What’s the state of the market this month? It’s easier to follow all this stuff when you can look at a pie chart, a comprehensive timeline, a pole diagram or just a good old table. Not to mention, infographics have made the sharing of information both online and offline miles easier. You can attach them to emails, post them to social networks, project them onto a wall at a meeting, include them in any PowerPoint presentation or just print them out and have them handy in a binder.
Tackling the tech transformations
Any side of the business world is a challenge, but the tech field makes for a really tough game. It seems like barely a couple of days can pass before something new is invented or something older is updated, overhauled, re-designed, de-bugged, given new hardware or otherwise tumbled upside down. With all those changes going on and the customer demands and standards becoming higher and more diverse by the minute, finding new business models that ensure a good (or better) market-product fit and a high growth rate is really a race. Infographics can be neat little chips that might just turn the tables in your favor.
Whichever technology you may be dealing in, you’re going to need to keep track of trends. Having a comprehensive overview of what works for others who might prove to be rivals, what made some others crash and an overall presentation of how the market is moving would probably be a huge factor in developing your strategy. Having all that info at your fingertips is made miles easier with concise, direct visual aids.
You can make twelve templates for the year and use them to keep track of your successes and faults on a regular basis, to get a clearer idea of how things are developing. Infographics are perfect for laying out your plan of action step by step in a way that’ll make it easy for all your teammates to understand. They’re also an awesome way to gather data on your target customer group and their attitudes toward your products. You can have a “What’s the best thing about us?” type, with a map of your highlights, pinned to your website’s homepage or social media pages and visitors can vote in the comments.
For keeping track of everything: investments, developments, strategies and trends, to new and creative ways to reach out or report, a well designed infographic will give a kick start to any activity. And the best part is that you can totally tailor them to your needs and purposes. Head on over to our infographic maker tool and check out all the templates we’ve got ready for you. Various themes, backgrounds, organizational elements, images and fonts of all types and colors come together to help tackle any tricky task that might jump out, and Easelly is here to make sure your tech startup grows fast and efficient in a completely unique way.

