Tomorrow marks the end of the election cycle – the day we’ve all been waiting for.
The votes will be rolling in, ballots will be counted, and we will soon know who our next POTUS is. We’ll also know which members of Congress will be leaving or joining us, and states will have their own representatives and ballot measures to keep an eye on.
While we all get distracted by the nasty TV ads and the cross-talk debates, the quiet data scientists and polling institutions have been hard at work, tracking this election step-by-step.
If you’re not sure what’s going or where to find objective information about the current state of the election, we’ve collected a ton of resources for you to track the latest polls, and to see how far we’ve come in this general election.
Hold on, everyone! We’re almost there!
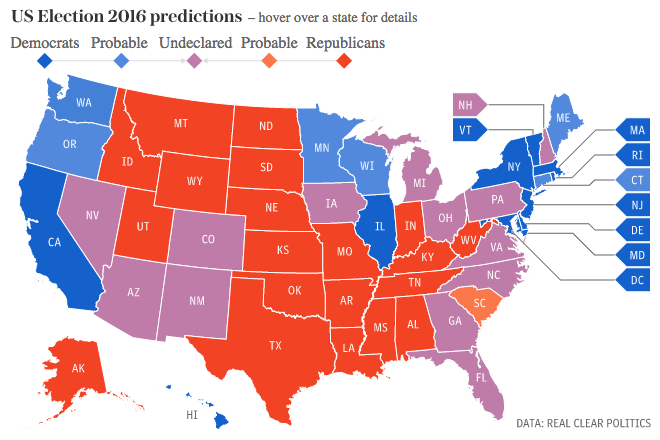
The Notorious Blue and Red Map of the US
Most of us are familiar with the map of the US that shows the “Red or Blue” nature of each state. This map indicates the number of electoral votes in each state that are associated with one party or the other; if a state has more Republican electoral votes, it’s considered a Republican state.
But you don’t have to just assume it’s all over for your state and that your vote won’t count if you’re not voting for that candidate! If you’re in a Blue state and you’re bleeding Red – get out and vote!
If you’re in a purple state, we especially need you! Remember, it’s our civic duty to get out there and vote.
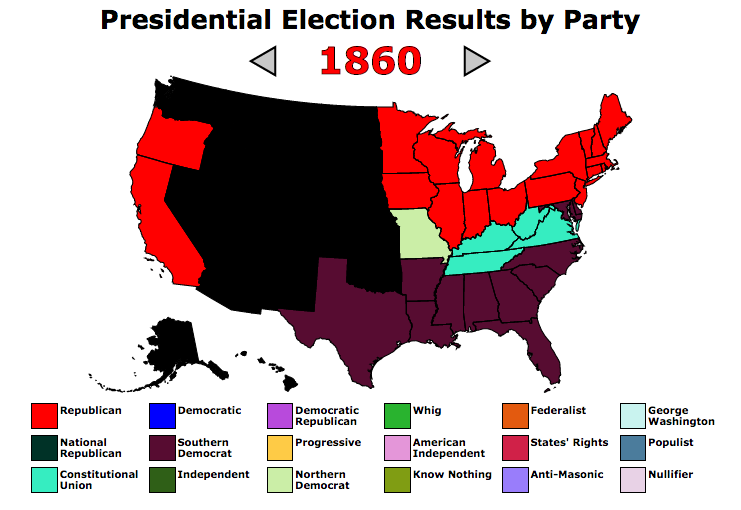
Fun fact: There were (generally) at least three parties involved in our election until the 1900s, when the election became a majority two-party vote. Check out this awesome interactive map of the history of Presidential election parties from Metrocosm to see how the times have changed.
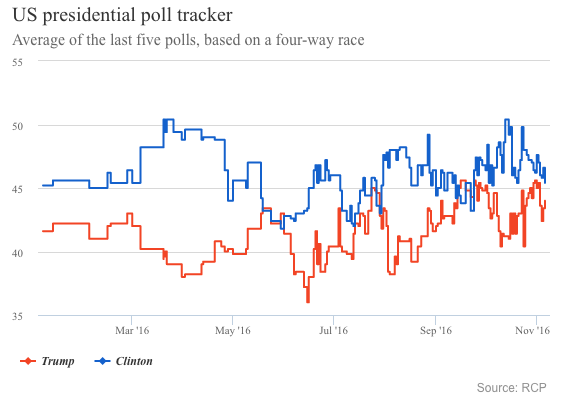
Polls are Changing, But Are We Really Changing Opinions?
If you’re like us, you’ve had trouble keeping up with what the latest polls have been saying. Well, here are the average polling numbers from the latest 5 polls. You can see that Hillary has always had the majority, but that majority has gotten much, much smaller since July (which is, of course, when Trump became the GOP nominee).
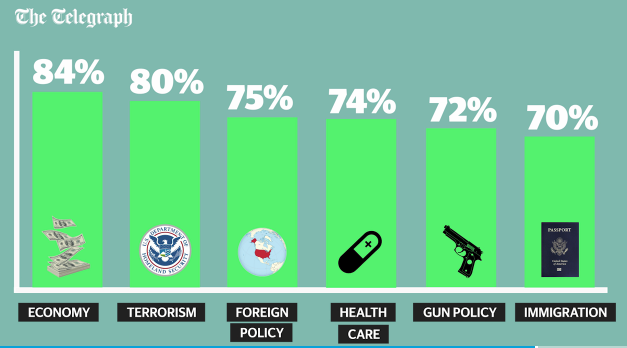
What’s Driving People to Vote?
There are a ton of hot button issues associated with this campaign, and we’re not going to get into that here. But the issues are important to voters, and it’s important to know what you’re voting for!
Not Voting IS Voting
Fun fact: There are nearly 219 million registered voters in the US.
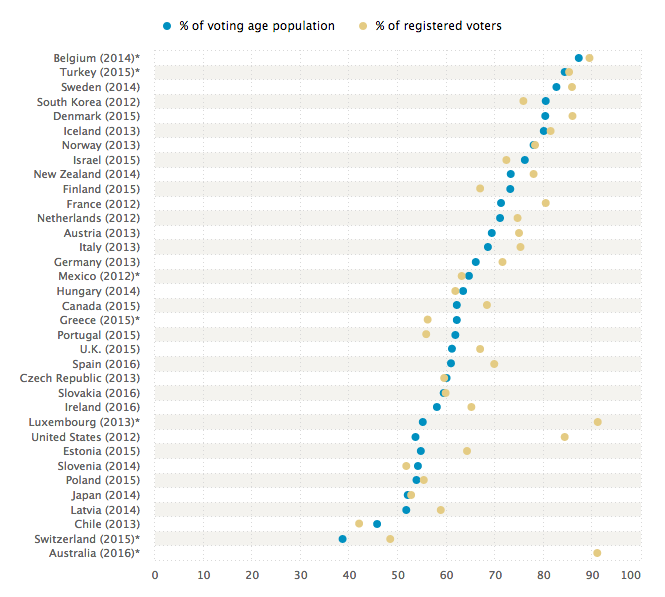
Another (not-so) fun fact: Only about 58% of registered voters actually voted in 2012
Even more upsetting? We’re ranked 32nd out of 35 countries for voter turnout.
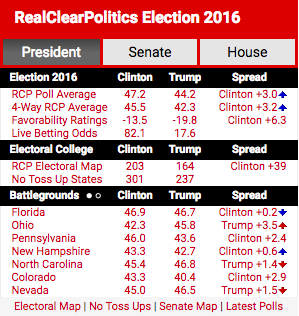
We are also going to have a high non-turnout rate in 2016, according to a recent poll by RealClearPolitics. To boot, nearly 18 percent of registered voters who say they will pick neither Trump nor Clinton.
So with maybe only 40 percent of people voting for the two main nominees… what will happen?
What to Do With All This Information
You’re probably thinking, “That’s all great, but that doesn’t change my vote!” But that’s not the point. The point is knowing the current state of affairs and being aware of what’s going on as Election Day draws near. With only about half of our voter population actually voting, it’s definitely time to reacquaint ourselves with our civic duty – our right! – to vote!
Resource List
If you’re a teacher and you’re wondering how to get kids interested in the election, or how to integrate infographics into a lesson about the Presidency or civic duty, check out our other article on teaching your students about the election with infographics.
If you don’t want to watch news outlets or try to wade through biased posts on social media, keep up-to-date on Election Day with Politico’s Electoral Vote Tracker. Remember: the next POTUS needs 270 delegates to win!