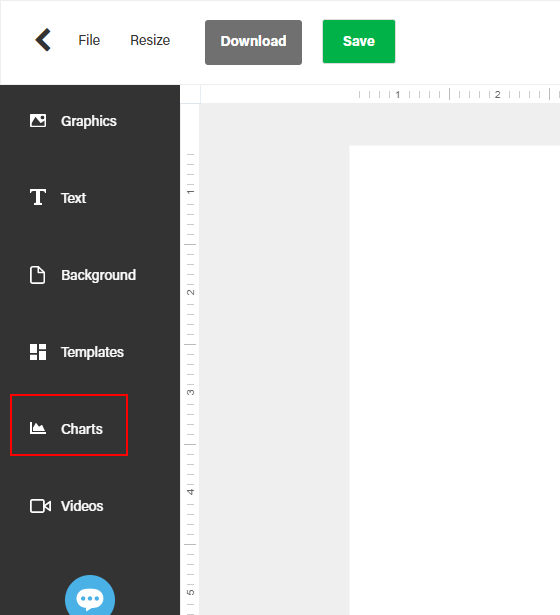
1. Select the “charts” button from the main toolbar.
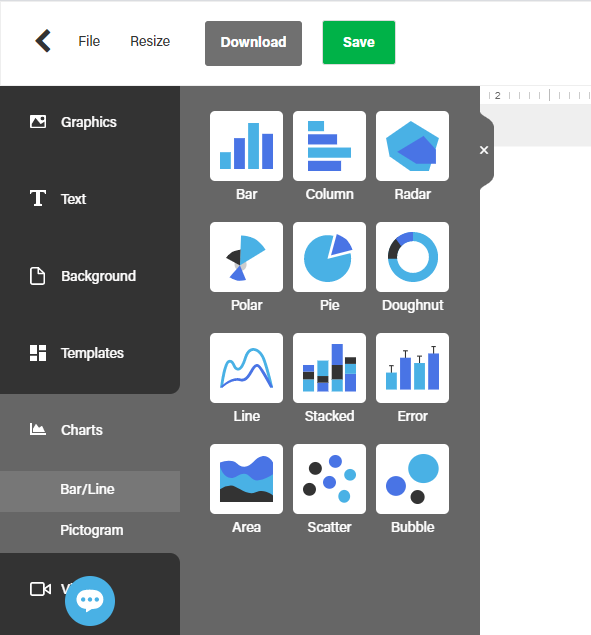
2. From the following toolbar, click & drag the desired chart type onto your canvas.
3. Double click the chart you just dragged to your canvas, you should see the charting dialog below.
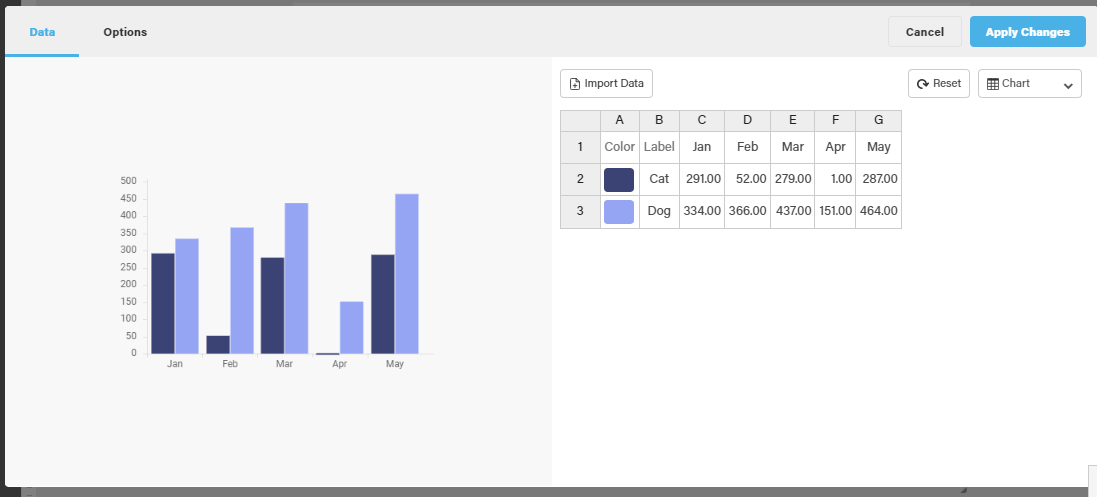
Click on the drop down for “Chart” and you should see the following options:
- “Add” or “Remove” column – adding/removing columns
- “Add” or “Remove” row – adding/removing rows
Beside “Chart”, you will see the Reset button which will clear all changes applied.
The data table itself can be manipulated by text or values. For example, you can select the color by double-clicking it and then either select a predefined color, enter the name of the color, pick one using the color picker or even input its hex value.
“Import Data”- import table from a file (Google sheets, Excel…)* – selecting this will open up a prompt window asking you to provide the said file containing the data you wish to implement.
4. Depending on the chart you choose, the options available are:
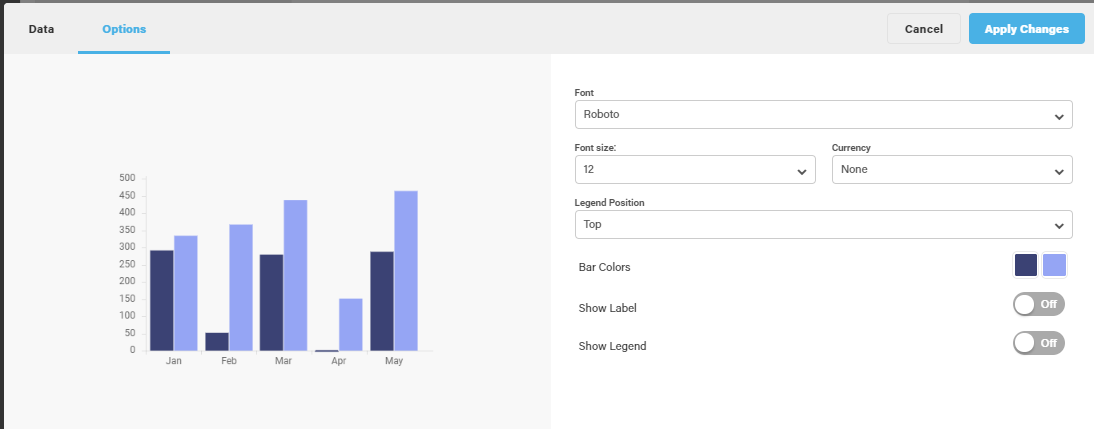
5. Hit “Apply changes” and you’re done
Note: If you want to enable your infographic to have “Live” or “Interactive charts“, you will need to embed the infographic into your website. I’ve included a video below on how to do this.