
eLearning has enjoyed steady growth for the past decade with the rise of distance learning tools and massive open online courses (MOOCs).
Over the last few months, though, distance learning has grown exponentially due to schools’ massive closures as a measure to slow down the spread of COVID-19.
While adoption to remote learning approaches was smooth and effortless for some schools, eLearning can be a struggle for educators who are new to developing an online learning curriculum.
If you’re a teacher or parent who is looking for creative ways to develop and implement eLearning strategies that will match your students or children’s interests and needs, consider adding graphics and animation to your text-based lessons.
How to use eLearning infographics
Graphics for eLearning include photographs, infographics, gifs, pictures, pictograms, diagrams, animated infographics, and icons. You might not have thought of it but memes can also enhance distance learning strategies!

In this guide, we’re going to take a closer look at how to use infographics for remote learning. You’ll also find downloadable infographic templates that you can use in class.
Why infographics should be a staple in eLearning
Apart from the fact that infographics have been proven effective in the classroom, they can make remote learning fun and accessible through the following:
- Draw attention to a specific element in your educational content. It can also help weed out irrelevant information.
- Suggest analogies or comparison between familiar information and new knowledge.
- Support understanding of difficult concepts.
- Simulate real-life situations.
- Make lessons more interesting.
Meanwhile, animated infographics like the one below have the following advantages:
- Enable learners to focus on only one object at a time
- Help steer attention to selected details by adjusting the direction of motion in the infographic
- Allow learners to access lessons at their own pace.
5 ways to use infographics for eLearning
If you’re about to try infographics and animated infographics for your eLearning adventures as an educator or parent, here are 5 fun ways to use infographics in the virtual classroom.
You’ll also find infographic templates that you can download and customize for each section.
1. Teach students how to analyze and interpret infographics.
Before diving into infographic creation with your students, it makes sense to get them started on how to interpret and analyze infographics.
Ask students to find out about the people who designed the infographic, the data sources, the techniques used to make specific information stand out, and what might be missing in the infographic’s overall message. This enables students to sharpen their critical thinking skills.
In their Infographics in the Classroom Teacher Toolkit, the California Academy of Sciences recommends the following guide questions when teaching students how to read and interpret infographics:
- What ideas or pieces of information does the author represent?
- What is the main conclusion or story you can identify from the infographic?
- What do the numbers in the infographic represent, i.e., what are the units?
- Where did the data come from, and how was it collected?
- How are the numbers/data in the graphic represented? (E.g., does the author use graphs, charts, maps, etc.? Do they use color, pattern, size, or position to communicate about the data?)
- What other ways does the author tell the audience about the key message(s)?
- What questions do you have about the graphic? What confuses you
- What do you like and dislike about the graphic?
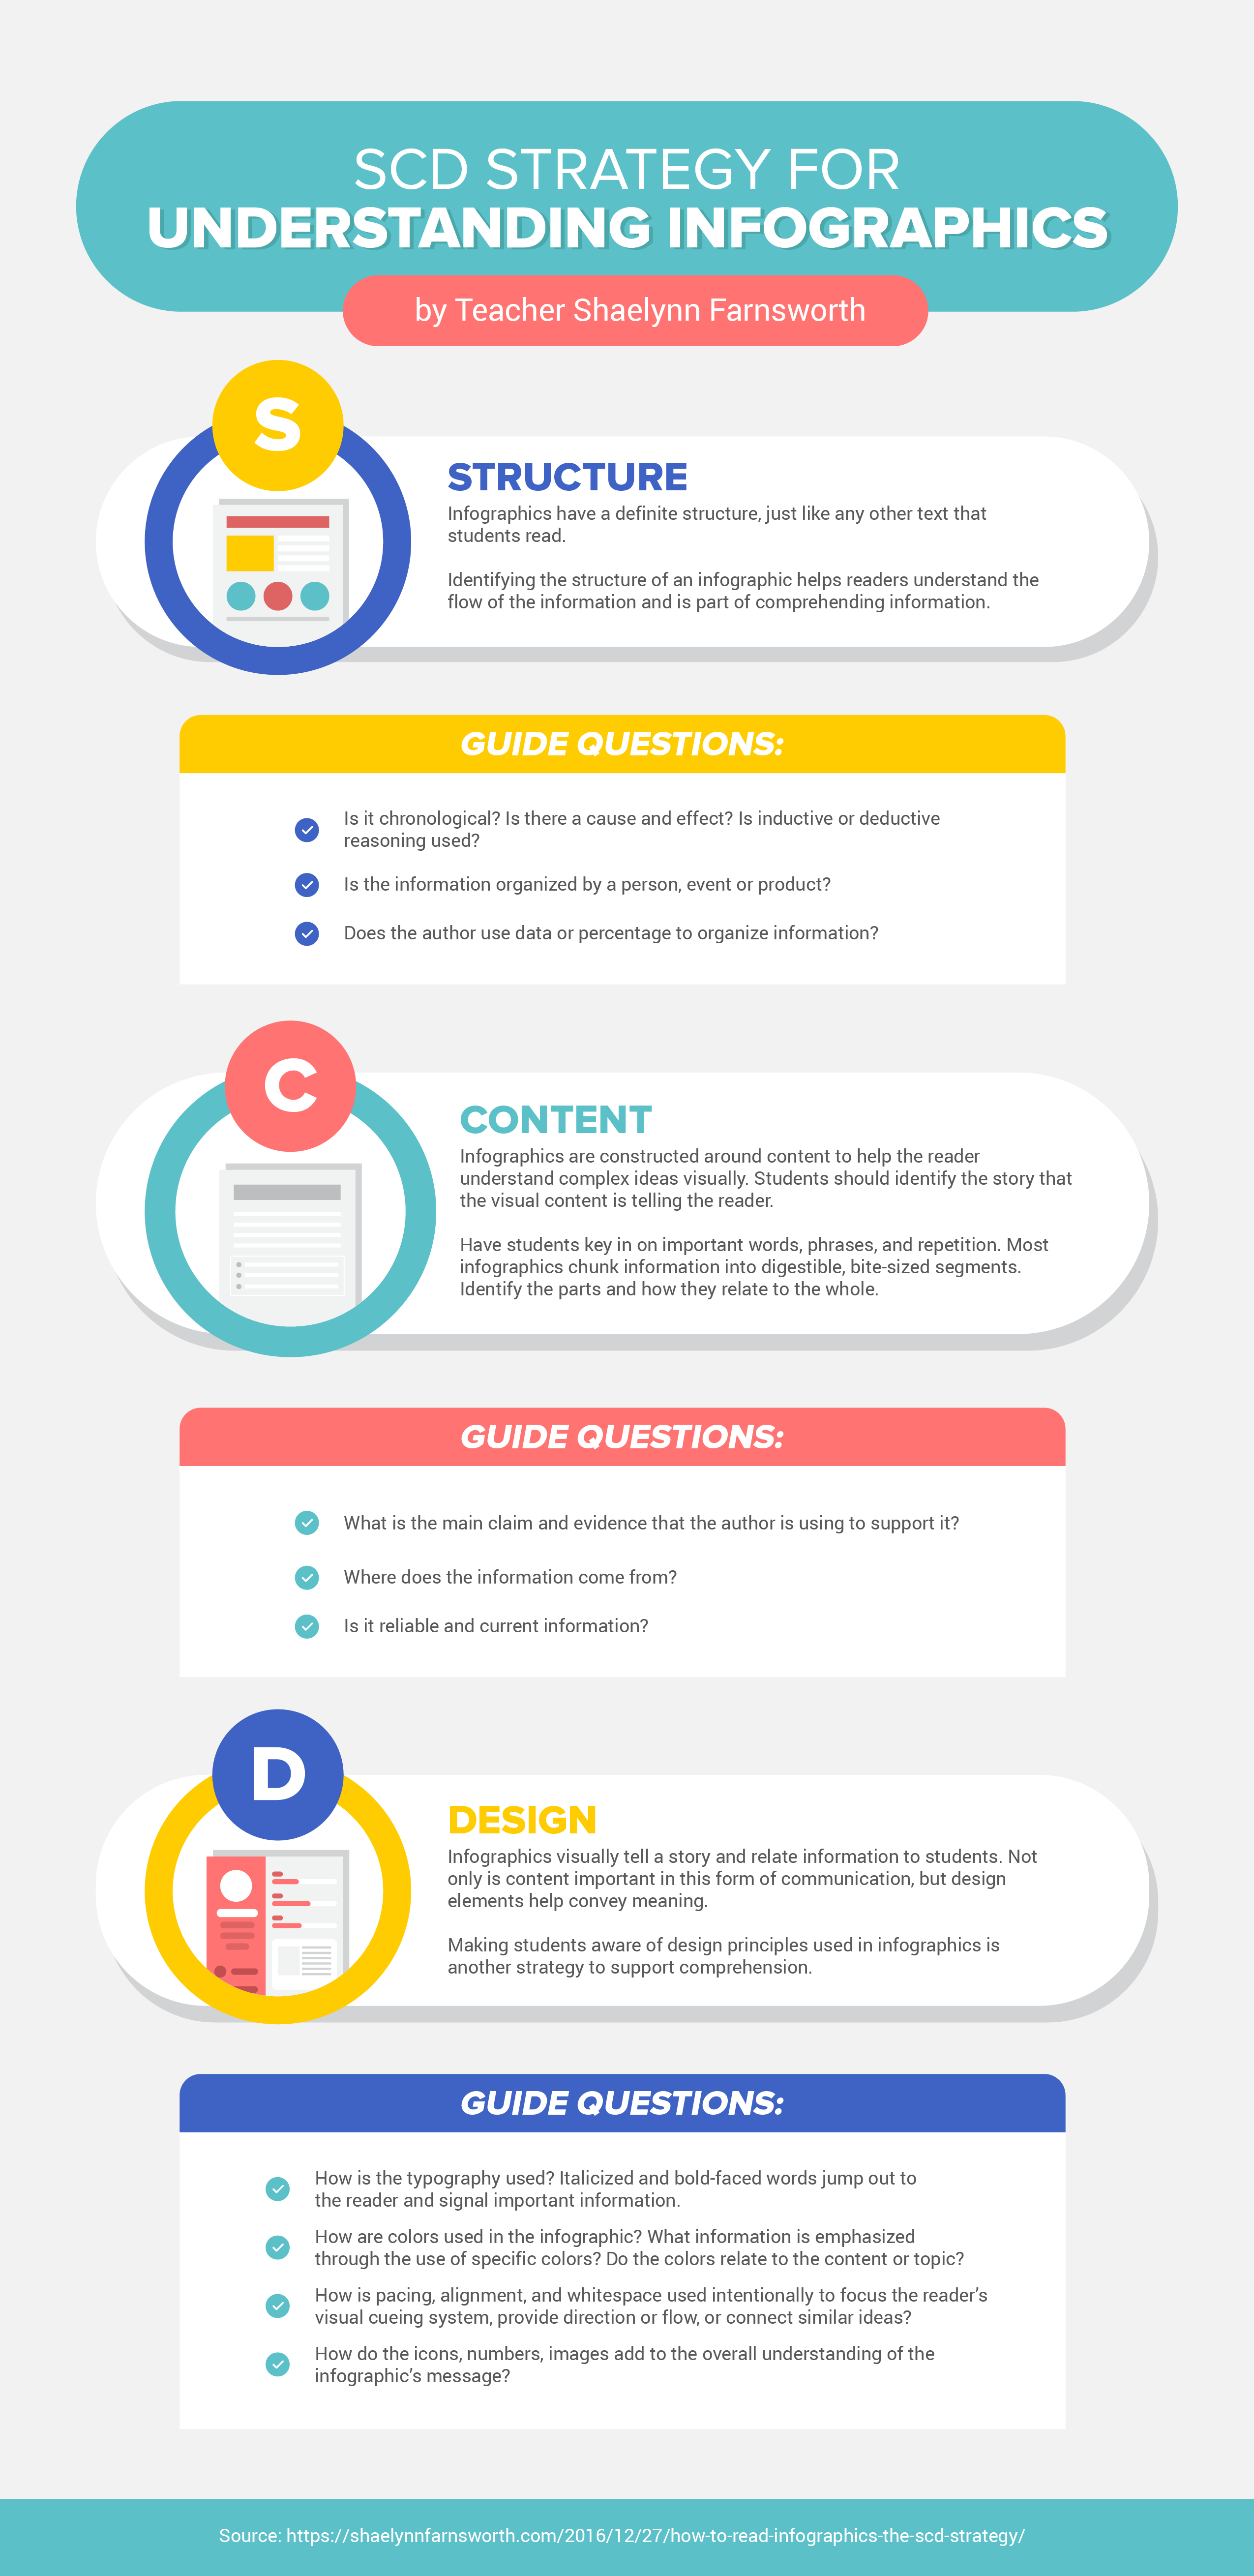
Another alternative is teacher Shaelynn Farnsworth’s SCD ( Structure –Content – Design) strategy on how to read infographics. You can download the poster on the strategy below for your next eLearning infographic activity.
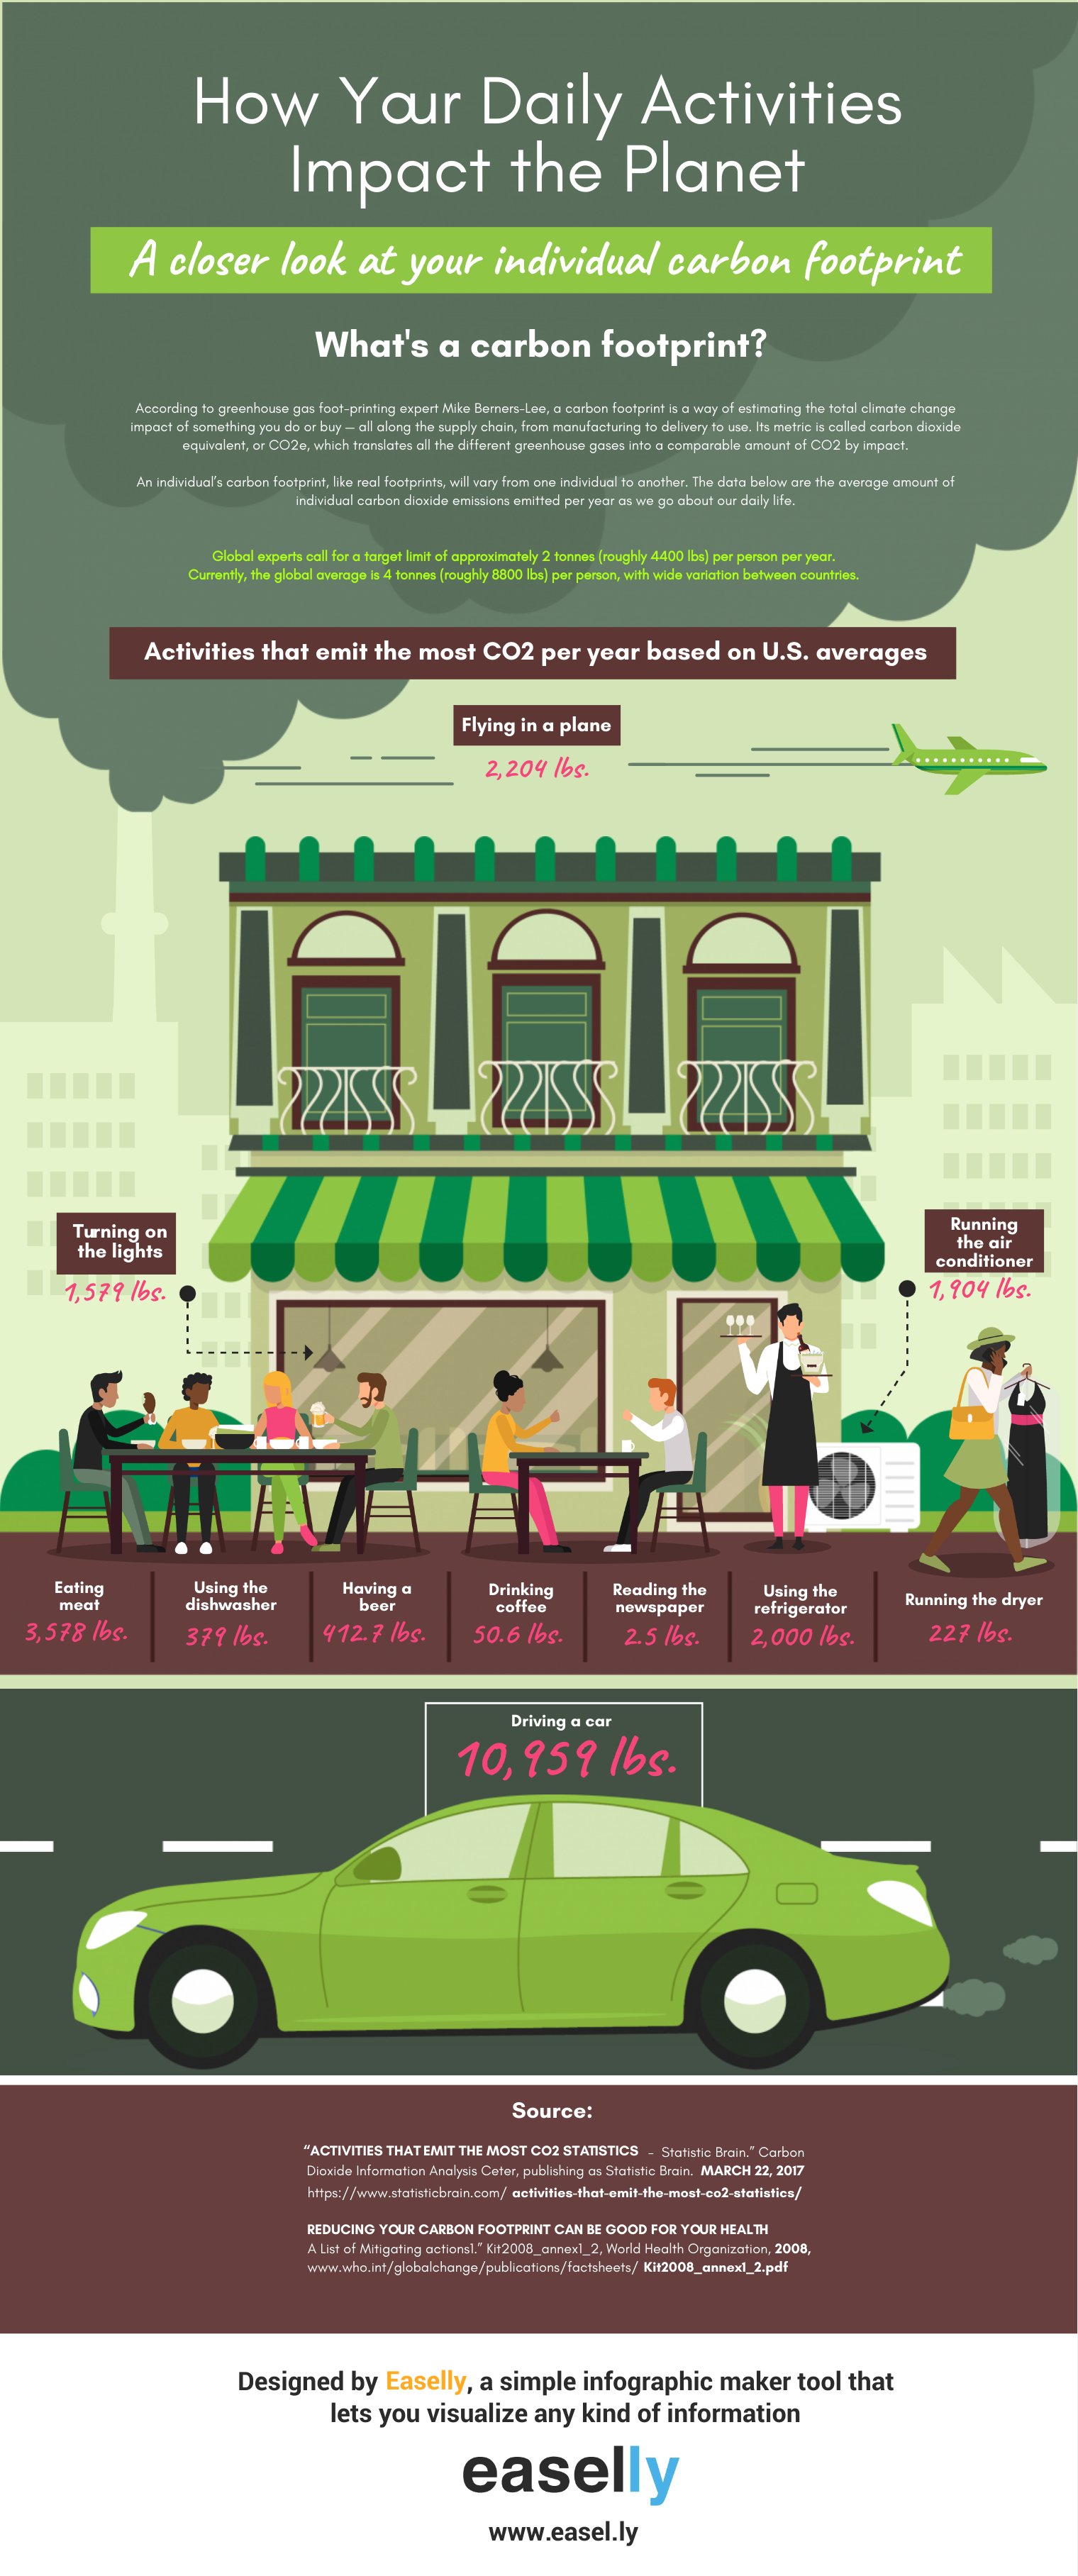
Meanwhile, you can use the carbon footprint infographic template below as a good starting point of your infographic analysis with students.
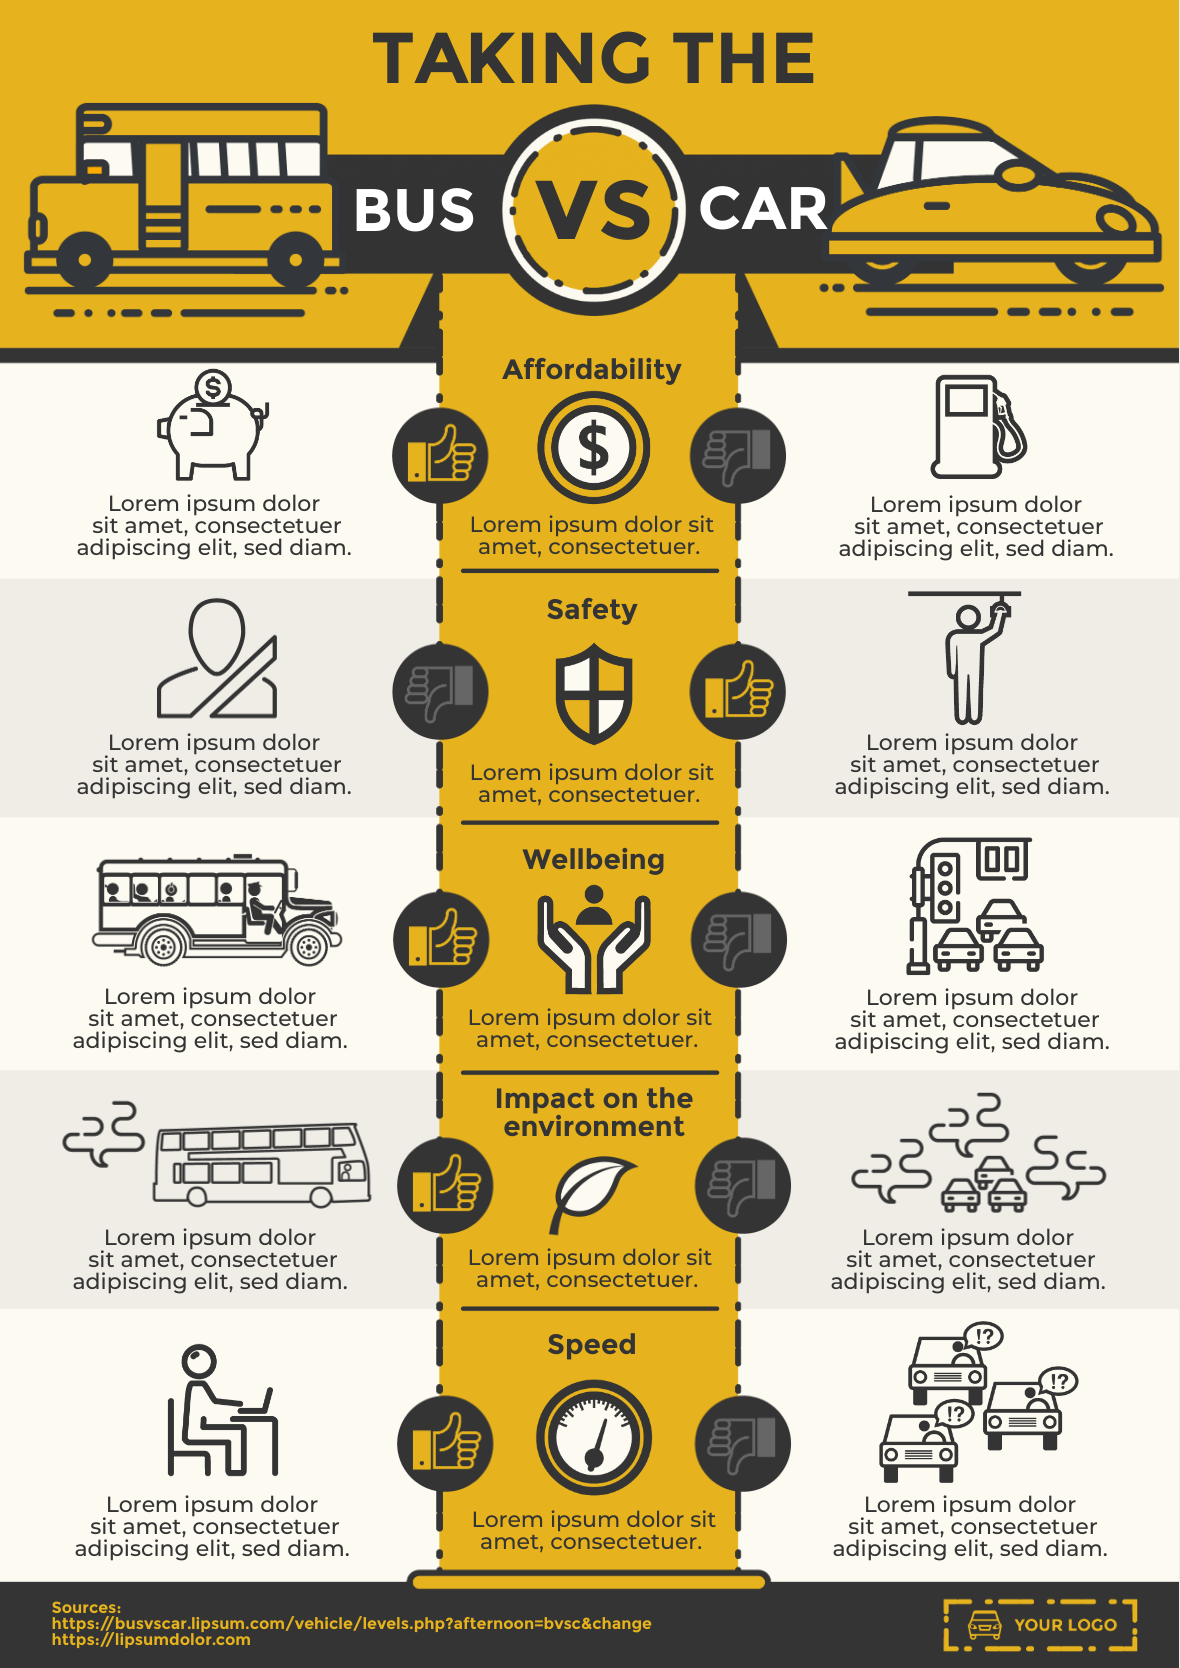
2. Encourage students to compare two objects, ideas, or places.
Infographics are excellent tools to highlight similarities and differences because it’s easy to add information next to each other.
Apart from the usual side-by-side comparison format, comparison infographics are ideal for contrasting numbers and figures through data visualization such as charts, graphs, and pictograms.
Comparison infographic ideas for your next eLearning activity:
- Compare the student’s present city, town, or country to a previous city, town, or country of residence.
- Compare two modes of transportation.
- Highlight the differences between pets at home.
- List down the pros and cons of a specific practice, idea, or product.
- Debunk myths by comparing it with facts.
Here are a couple of comparison infographic templates to help you and your students get started with your remote learning activity with infographics.
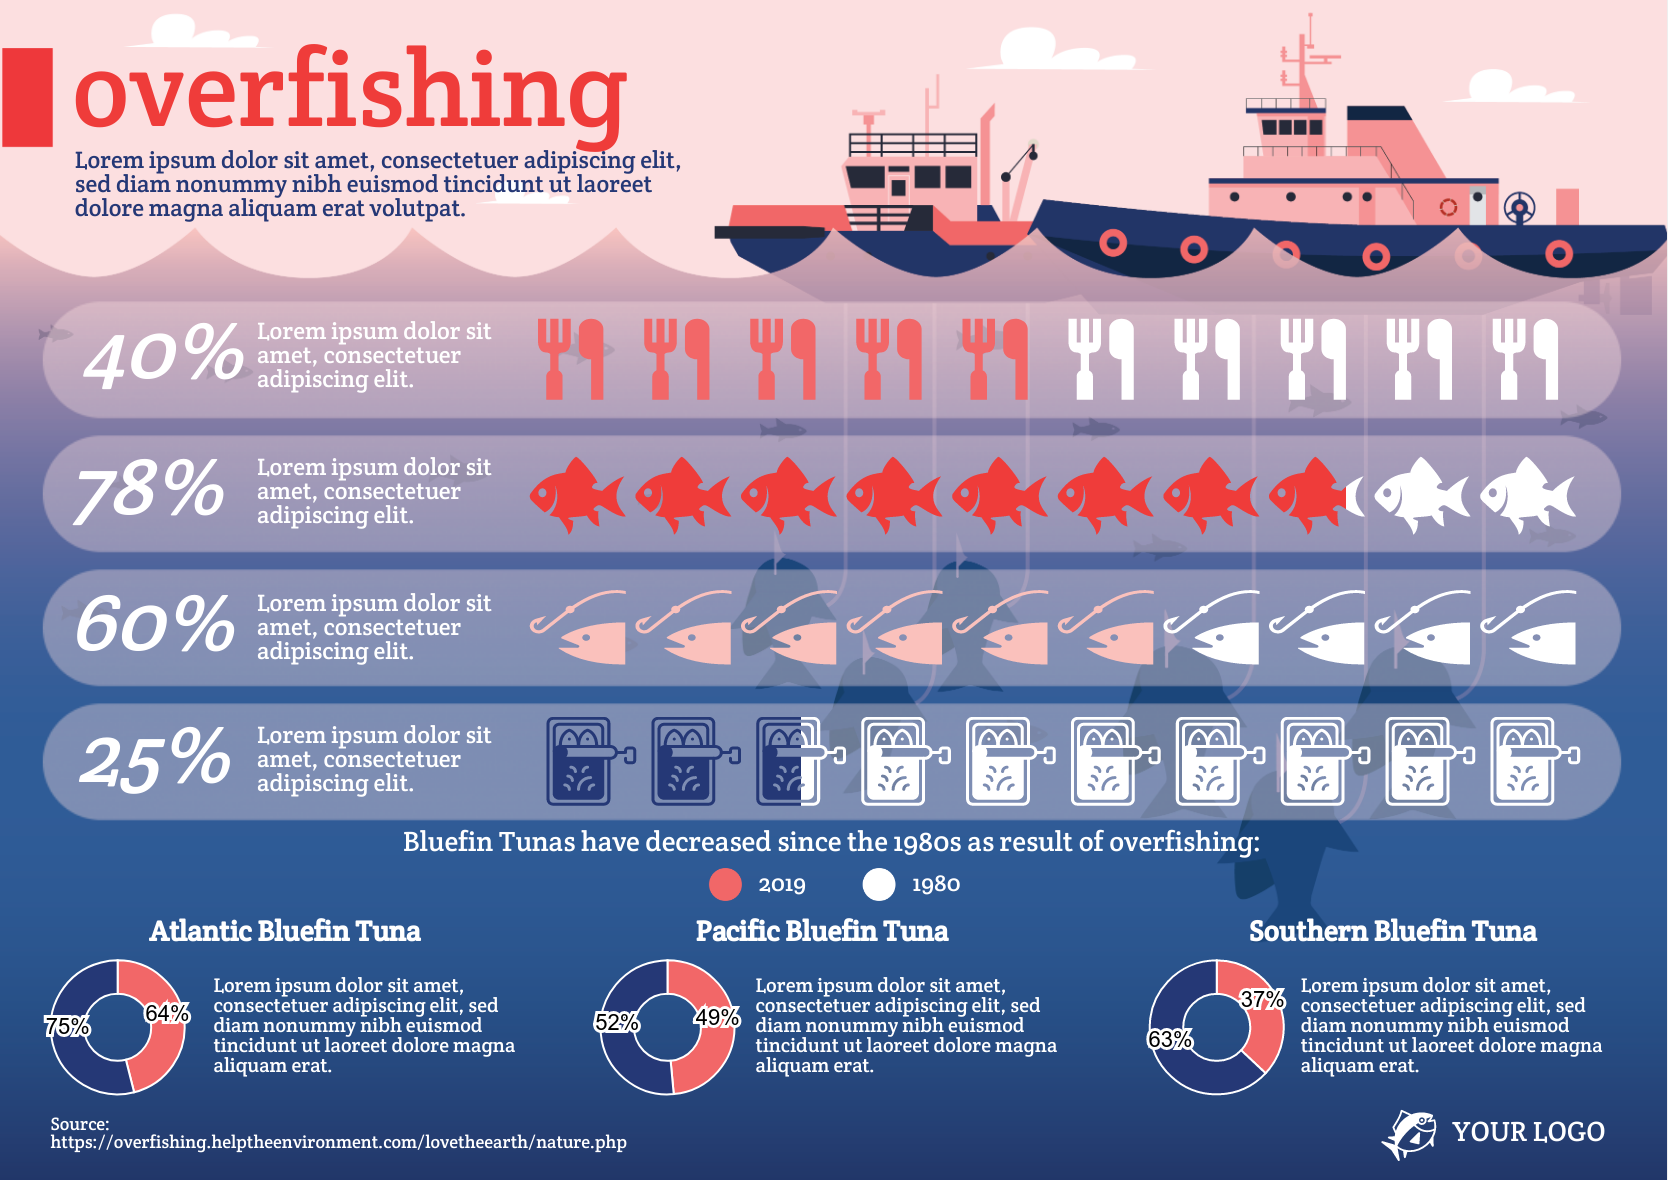
3. Ask students to visualize data and information.
Data visualization is an important 21st century skill. Creating visualizations for numbers and statistical information is a great way to help students quantify and understand abstract concepts.
Another good use of infographics as a data visualization tool for your eLearning activities is how they can be used as a quick reference guide for students.
Take your pick from these two data visualization activities:
Activity 1
Pick various data sets, and encourage students to decide on the best way to visualize and communicate any meaningful patterns in your data set. Encourage students to try pictograms, pie charts, bar graphs, and timelines.
The infographic template below is a great way to get started with your data visualization activity in class.
Activity 2
Help students understand the different visualization formats that they can use by asking them to present the same data in an infographic to a different data visualization format. You can use the infographic template below for this activity.
What colors and images would they like to use for the new version of the infographic? You can also ask them to create a new version of the infographic headline or rewrite infographic content to make their version more persuasive and informative.

PRO TIP: If you’re new to data visualization formats, use this guide — Data Visualization Guide: Choosing the Right Chart to Visualize Your Data
4. Use infographics as part of a scenario-based learning approach.
A scenario-based learning approach in eLearning is essentially “active learning”.
As a teacher or parent, you use real-life situations to aid decision marking, drive behavioral change, and turn your students into critical thinkers. It also helps them shift perspectives and develop a growth mindset.
The immersive nature of this approach also makes eLearning more engaging for learners.
You can ask students to gather multiple sources of information as solutions to the problem and evaluate each source’s accuracy and credibility. Afterward, they can present their solutions in infographic format.
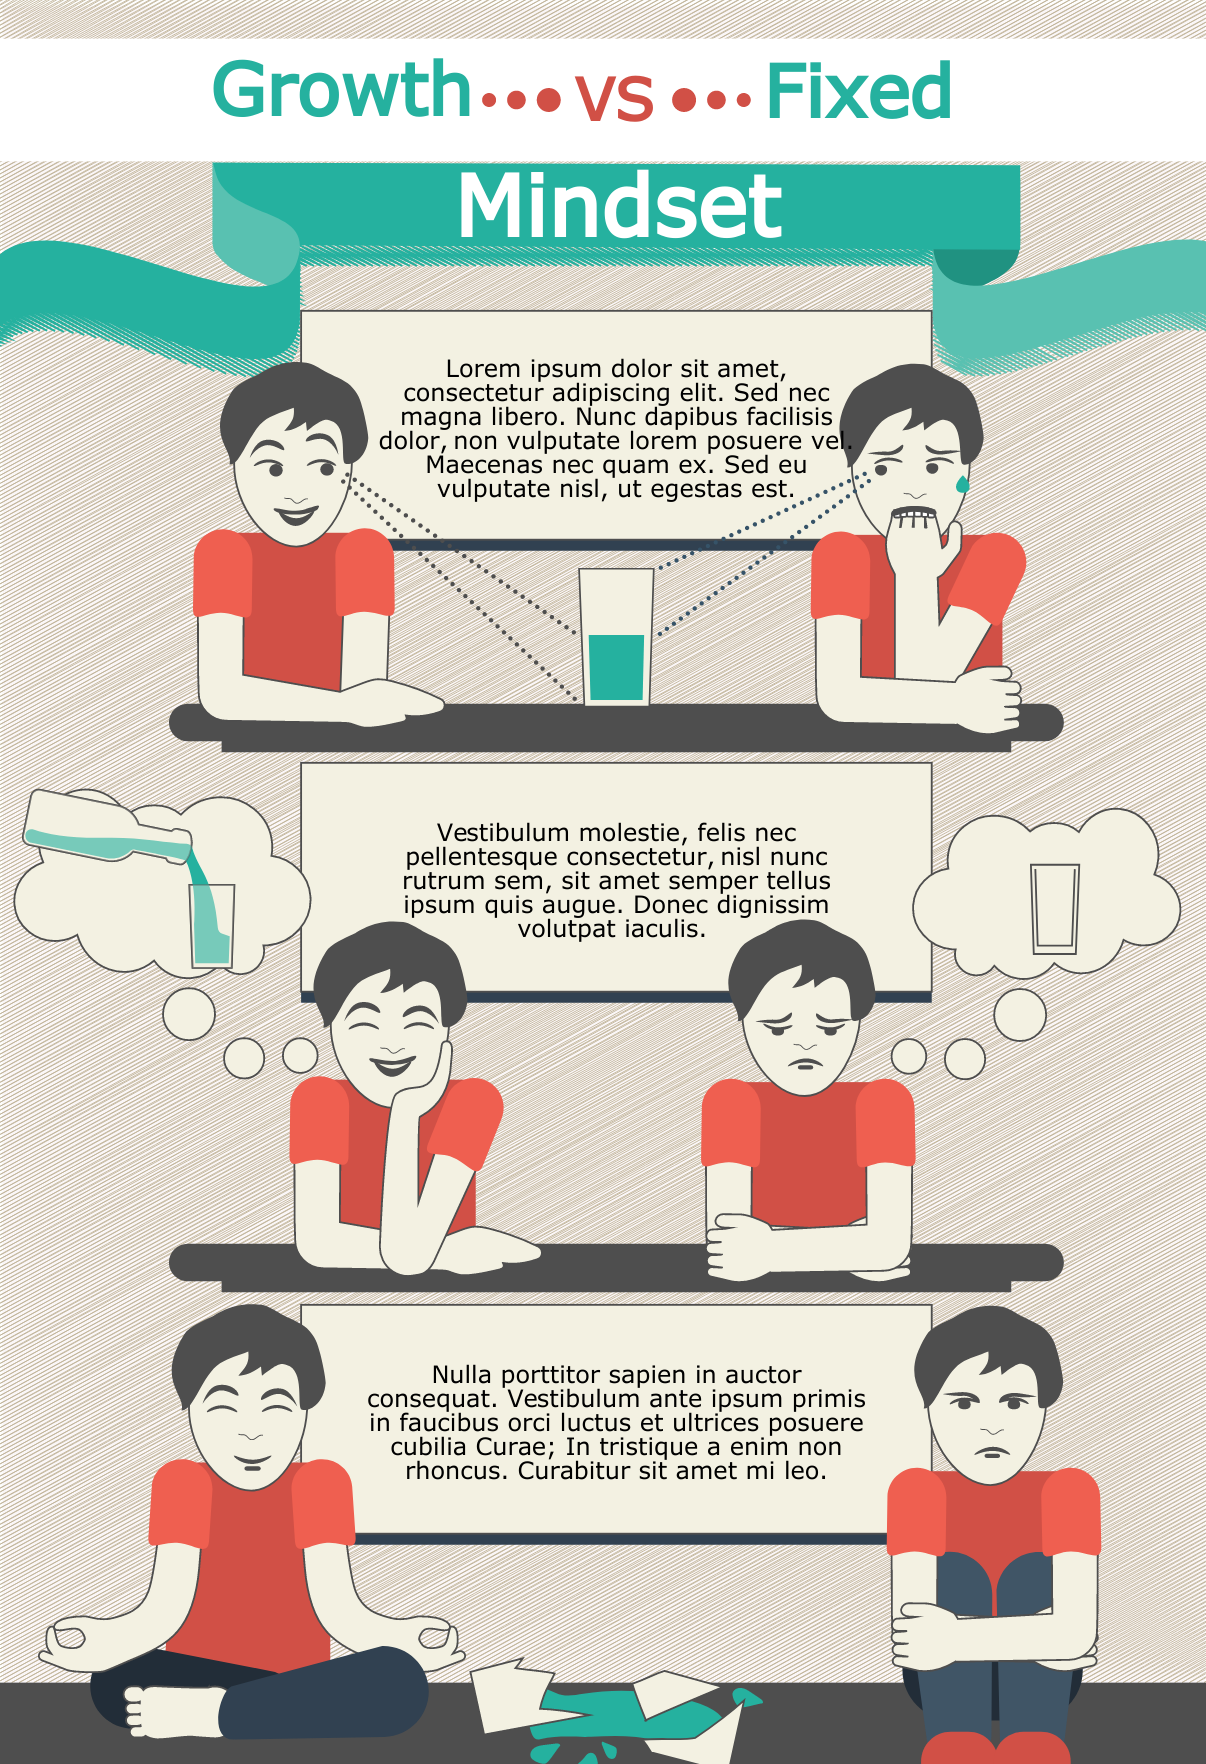
The animated infographic template below is an excellent example of using a scenario-based learning strategy for remote learning.
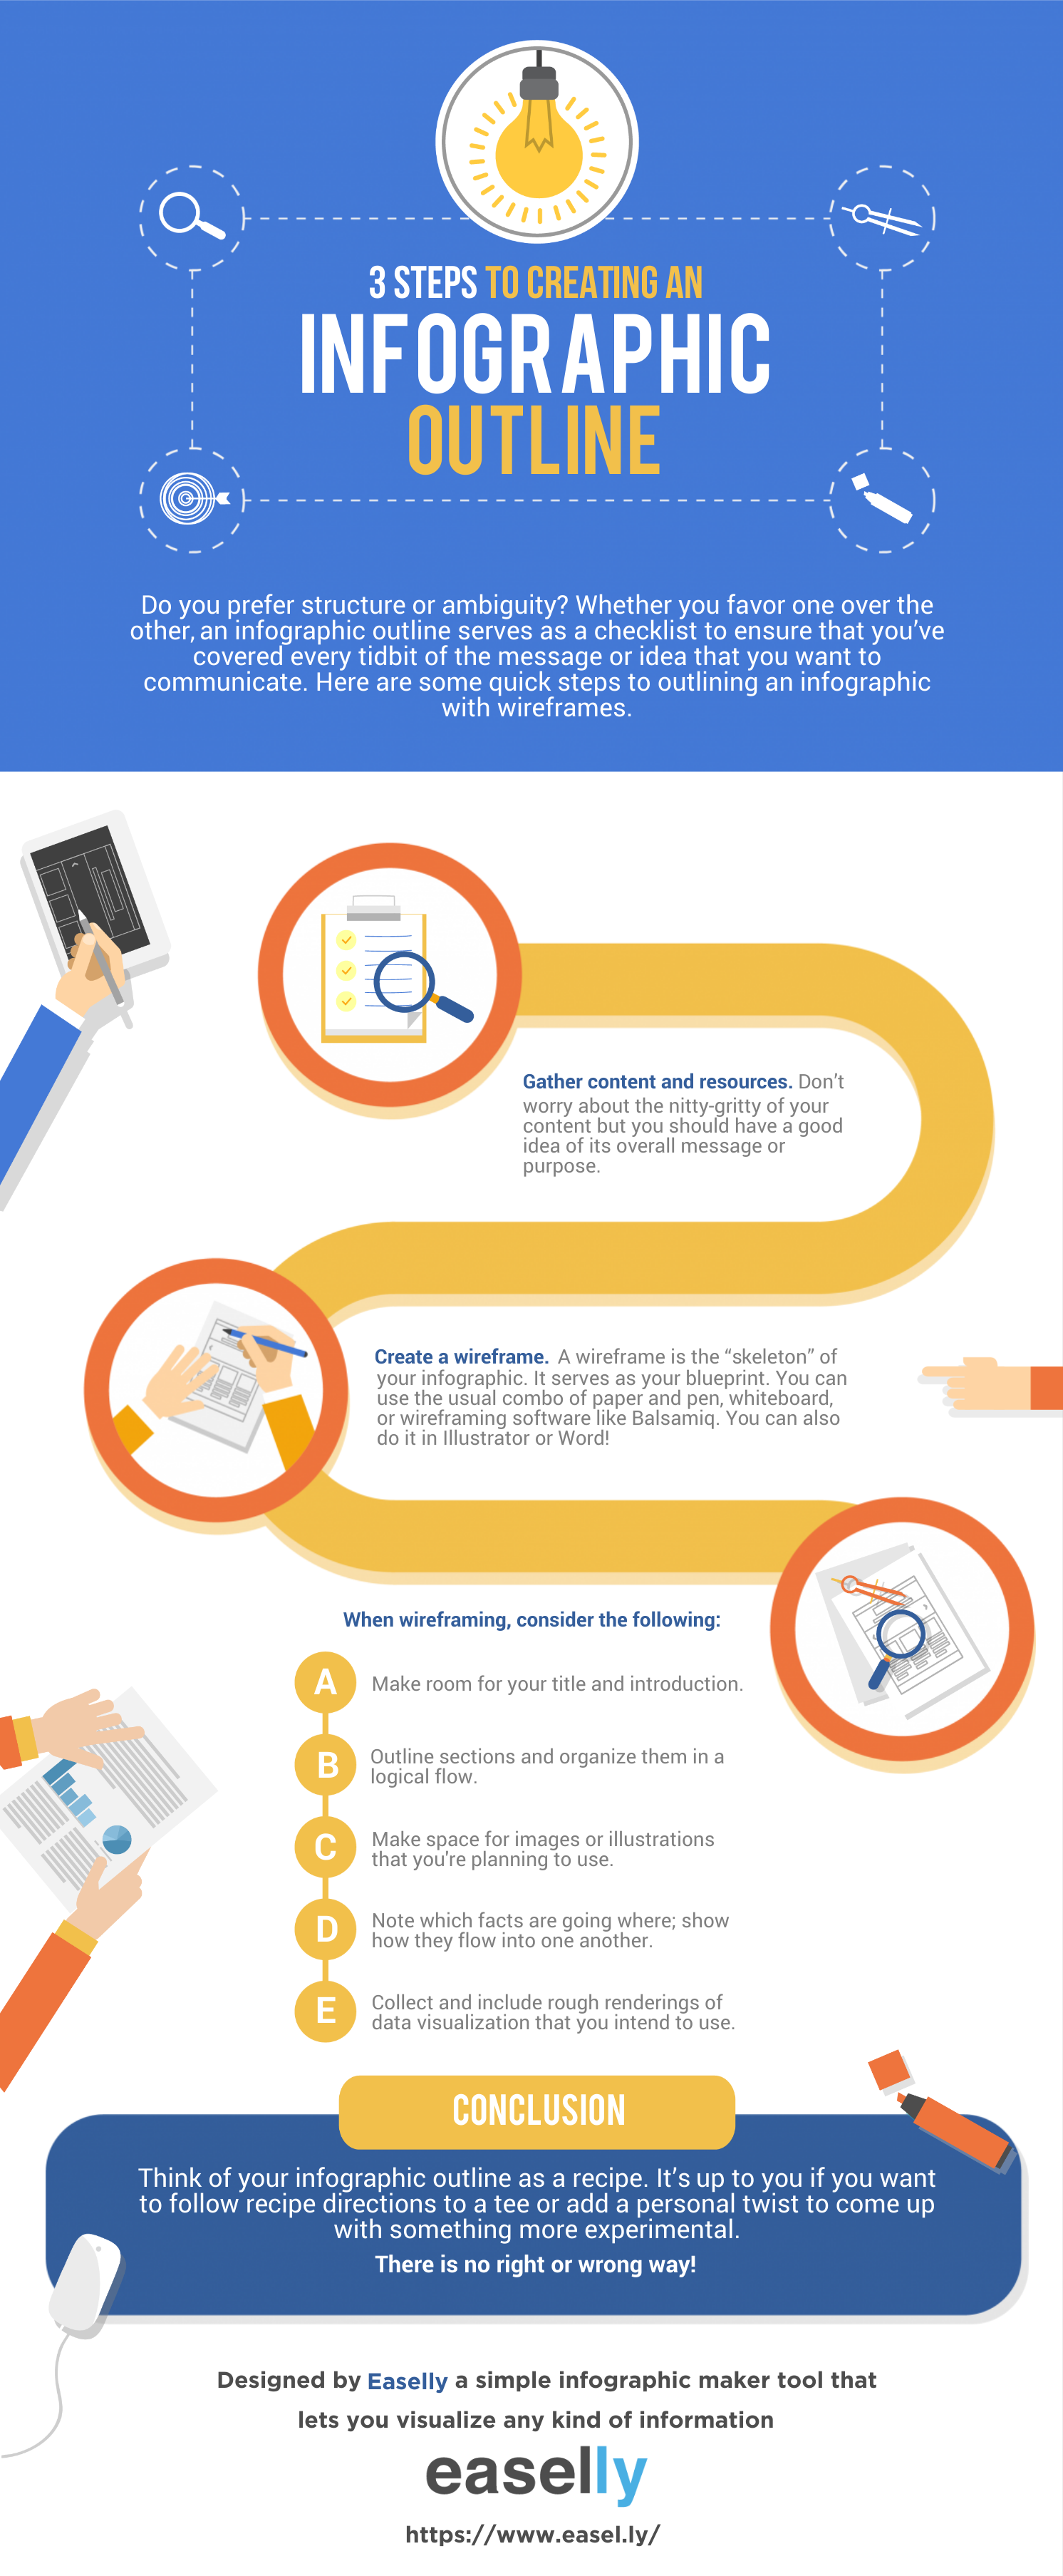
5. Encourage students to tackle a complicated procedure or technical information with process infographics.
Need to show your students how to do something or simplify a complex concept?
You can’t go wrong with a “how-to” or process infographics!
These infographic formats are helpful as they can walk through learners to every step of the process. It also helps them deconstruct systems. Plus, spelling out each step in the process with matching illustrations encourages students to follow along.
Getting started with your eLearning infographic activities
Many educators and parents struggle to find good inspiration for their eLearning infographic exercises when it comes to incorporating infographics into online learning. Budget, time, and technology constraints can also be a challenge.
The good news is you don’t have to make infographics from scratch with students. You can design infographics using templates!
With infographic templates, you can save time, and they are reusable for other eLearning sessions. Also, infographic maker tools like Easelly do not require app downloads and can be used right on your browser.
Happy teaching (and learning)!
Recommended resources:
- How to Plan an Infographic Project for Your Class
- How to Write the Perfect Infographic Design Brief
- The Complete Infographic Checklist for Your Next Easelly Infographic
- 10 Tips to Jazz Up Your Science Classroom with Infographics
- How Two Educational Specialists Use Infographics to Empower English Language Learners
- 5 Infographic Activities for Students (video)