Nonprofits

Your 3-Step Checklist to Effective Infographic Design with Examples

Before you start down the path of designing infographics, it pays to understand what truly makes an effective infographic. Striking colors? Wonderful use of typography? Attention-grabbing headlines? Sure, a lot of people will likely say that there’s no definite set of criteria to follow because people’s perception of what’s effective can vary. For example, Joanna …

Your 3-Step Checklist to Effective Infographic Design with Examples Read More »
types-of-infographics-nonprofit

 What Types of Infographics Should I Use for My Nonprofit?

Nonprofits need to relay ideas quickly and visually in order to reach a lot of people. This helps them grow their cause and raise money. But when it comes to marketing a nonprofit online, or even getting your organization’s message across, what sort of medium should you use? Infographics for nonprofits are not only visual, …

 What Types of Infographics Should I Use for My Nonprofit? Read More »

successful-nonprofits-using-infographics

How Successful Nonprofits Use Infographics

Nonprofits have a big job. They don’t operate like traditional businesses (i.e. for profit), so they need donors and volunteers to help them do their highly important work. To attract potential donors, companies and even volunteers to help their cause, nonprofits have to market themselves constantly. Enter infographics. Infographics for nonprofits Infographics are images that …

How Successful Nonprofits Use Infographics Read More »

nonprofit-infographics

How Do I Communicate What My Nonprofit Does With Infographics?

Infographics are images that relay information, and you’ve probably used them in some shape or form for your nonprofit’s internal messaging or statistics reports. But infographics can come in a variety of sizes and templates, which allows them to be utilized across multiple platforms for multiple purposes. How to use infographics for your nonprofit organization …

How Do I Communicate What My Nonprofit Does With Infographics? Read More »

chart-graph-infographic

How to Choose the Best Chart or Graph for Your Infographic

As an increasingly visual society, it makes sense to relay information in a visually concise manner. Infographics are great for this. It’s much easier for people to digest information when text is coupled with an illustration — but if you’re trying to create an infographic, it’s hard to know which kind to use. And if …

How to Choose the Best Chart or Graph for Your Infographic Read More »

How to Collect Reliable Information for Your Infographic

Trying to create a compelling infographic but struggling to find reliable information? In today’s world, information found on the internet is not necessarily vetted for accuracy or even its level of objectivity. In fact, information found in mainstream search or on social media may be biased, even though its facts and statistics are typically checked …

How to Collect Reliable Information for Your Infographic Read More »

promote-nonprofit-event

Promote Your Nonprofit’s Events With Infographics & More

This article was written by Cara Benson, Community Manager at Eventbrite Nonprofit organizations, by definition, prioritize worthwhile causes above financial gain. Their structure depends solely on their ability to spread a message and incite action. With typically tight budgets, every marketing effort needs to pack exponential bang for their proverbial buck, including nonprofit events. Why …

Promote Your Nonprofit’s Events With Infographics & More Read More »

5 Creative Ways to Use Your Infographic

Many of our users love our awesome infographic templates, objects, and hyperlinking features. But we’d like to highlight a few other ways that people (as well as businesses and marketing professionals) can use our infographic creation tool to get the most bang for their buck. After all, it’s not just about creating infographics to share …

5 Creative Ways to Use Your Infographic Read More »

diversity accessibility easelly

Diversity and Representation in Our Creation Tool

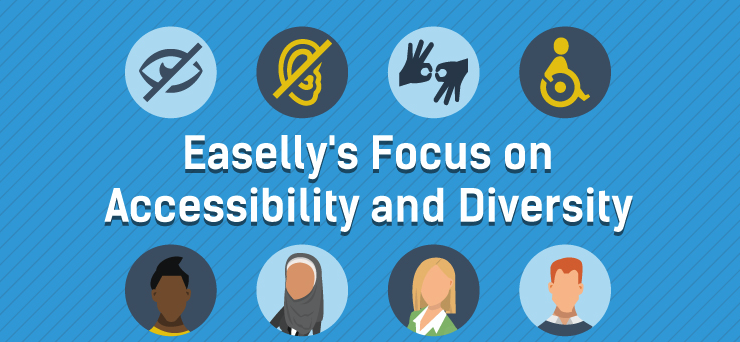
Whether you use Easelly in a classroom full of students or for a boardroom presentation, we believe in representing the diversity of all our users. Thanks to our developers, we have created a tool that allows users of any age or ability to create visuals, including those with sensory, developmental and physical impairments. Read more about …

Diversity and Representation in Our Creation Tool Read More »

How to Communicate Better With Infographics

Did you know that over 65 percent of people are visual learners? Or that visuals make it easier for the brain to process information faster than text or speech? For these reasons, visuals are becoming one of the best ways to communicate information in today’s world. As a business owner, it’s your job to communicate …

How to Communicate Better With Infographics Read More »

Easelly’s Focus on Accessibility

Education and the tools that support it should be universal. Now more than ever, it’s important for children and educators to have access to tools that help them learn and embrace diversity at the same time. At Easelly, we take this very seriously, which is why we’ve worked with educators and designers to create VPAT Accessibility …

Easelly’s Focus on Accessibility Read More »

choosing the right color combination for infographics

How to Choose Infographic Colors with Color Theory

When it comes to creating an infographic, the first thing you need is an idea. Once you’ve developed your idea more, you should then focus on how you’re going to share your idea visually. One of the most important aspects of telling a visual story is knowing which infographic colors to choose. In this blog …

How to Choose Infographic Colors with Color Theory Read More »

Scroll to Top