School is out for the summer (in the United States at least), but that doesn’t mean teachers aren’t already gearing up for the next session.
If you’re a teacher and you find yourself already bogged down in lesson plans and deciding how best to organize your classroom, here are a few ways that infographics can make your job a little easier.
Fun fact: About 65 percent of the population are visual learners, and visual content can improve learning up to 400 percent.
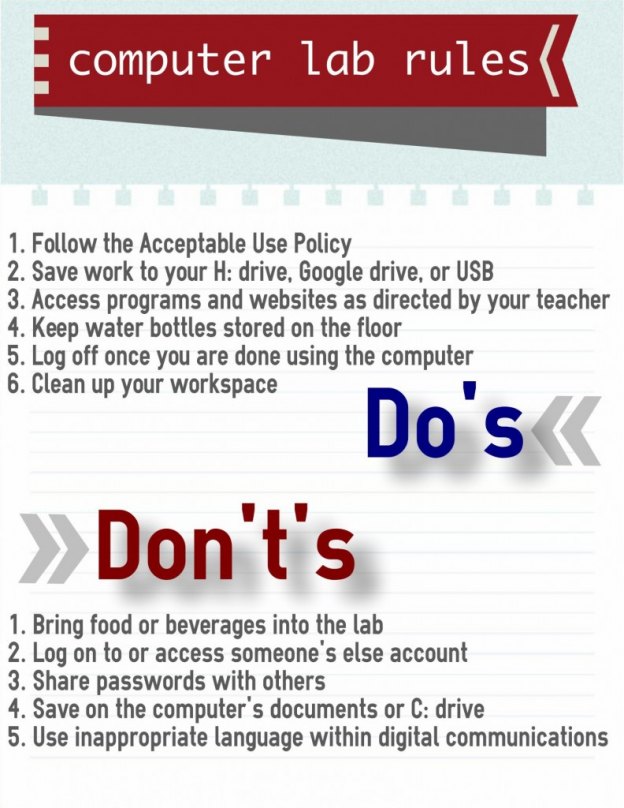
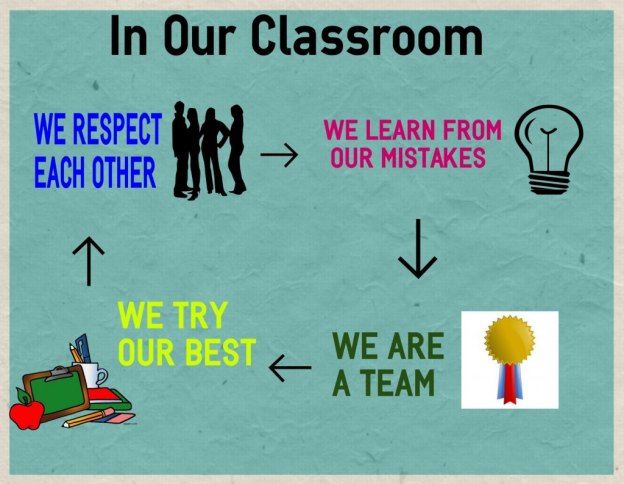
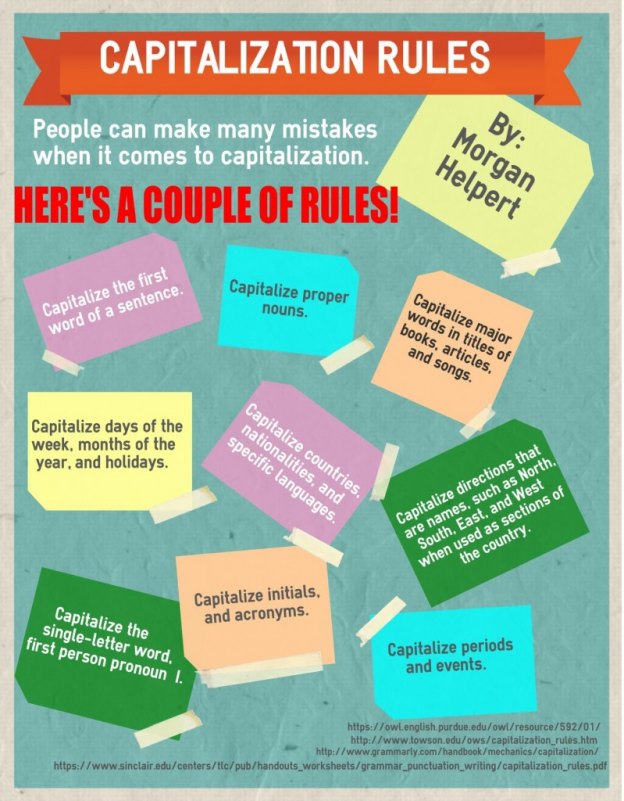
Just because there are rules doesn’t mean kids will always remember them. Use infographic templates from Easelly to list rules. Print off the sign and post it wherever you need to!
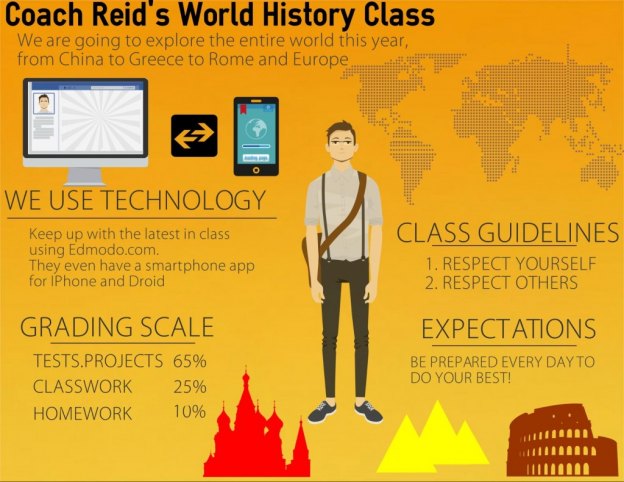
Plus who really ever reads the syllabus? Make it an infographic instead!
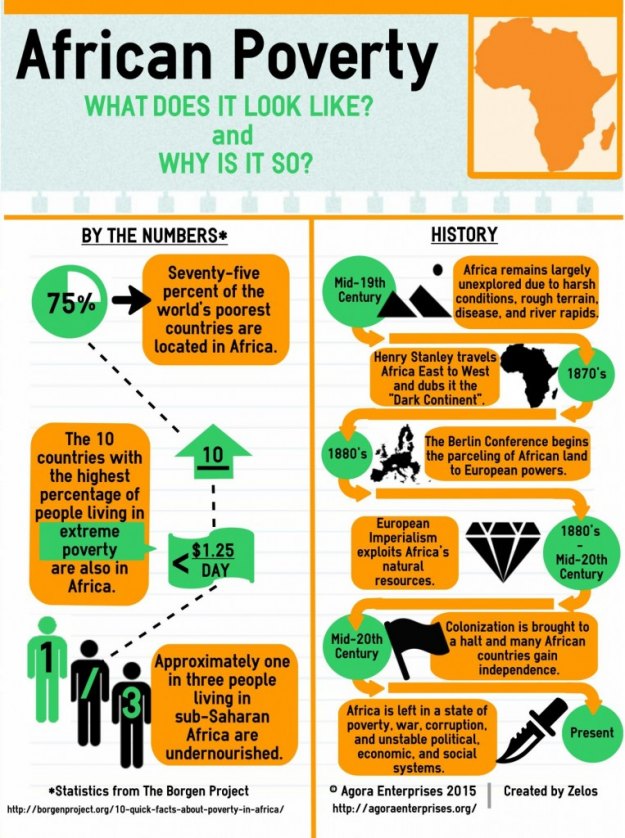
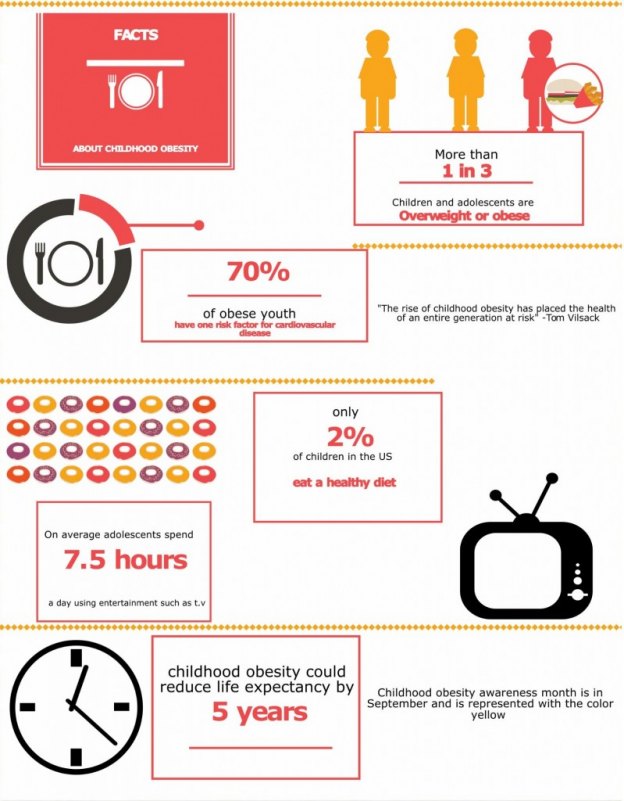
What about teaching a specific unit or trying to highlight a point with an overhead or slideshow demonstration? From history, geography, math, and even grammar… You can make infographics for just about anything. Don’t expect kids to retain something they just read; give them something to see!
Fun fact: Visual input can be recalled with 65 percent accuracy ten days after receiving it, compared to 10 percent for reading.
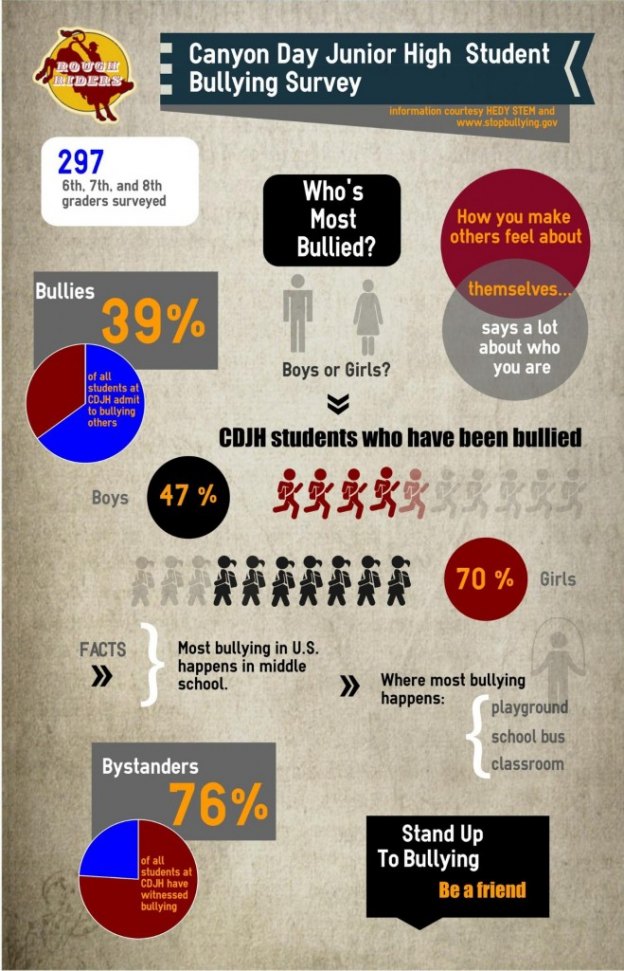
You can even use infographics for a school wide policy change, increasing awareness, or sharing a an important message.
The more visual input you allow into your classroom (and school), the more you’re allowing your students to be stimulated and retain information at the same time. Hopefully these infographics have made your summer a little easier. Check out more educational templates with Easelly’s pro account – there are discounts for teachers and students!